DOI: 10.1534/genetics.105.049916
Variation in Mutation Dynamics Across the Maize Genome as a Function
of Regional and Flanking Base Composition
Brian R. Morton,*
,1Irie V. Bi,
†Michael D. McMullen
†,‡and Brandon S. Gaut
§*Department of Biological Sciences, Barnard College, Columbia University, New York, New York 10027,†Department of Agronomy, Plant Sciences Unit, University of Missouri 65211, Columbia, Missouri,‡Plant Genetics Research Unit, USDA-ARS, Columbia,
Missouri 65211 and§Department of Ecology and Evolution, University of California, Irvine, California 92697
Manuscript received August 22, 2005 Accepted for publication October 4, 2005
ABSTRACT
We examine variation in mutation dynamics across a single genome (Zea maysssp.mays) in relation to regional and flanking base composition using a data set of 10,472 SNPs generated by resequencing 1776 transcribed regions. We report several relationships between flanking base composition and mutation pat-tern. The A1T content of the two sites immediately flanking the mutation site is correlated with rate, transi-tion bias, and GC/AT pressure. We also observe a significant CpG effect, or increase in transition rate at CpG sites. At the regional level we find that the strength of the CpG effect is correlated with regional A1T content, ranging from a 1.7-fold increase in transition rate in relatively G1C-rich regions to a 2.6-fold increase in A1T-rich regions. We also observe a relationship between locus A1T content and GC/AT pressure. This regional effect is in opposition to the influence of the two immediate neighbors in that GC/AT pressure increases with increasing locus A1T content but decreases with increasing flanking base A1T content and may represent a relationship between genome location and mutation bias. The data indicate multiple context effects on mutations, resulting in significant variation in mutation dynamics across the genome.
E
VOLUTION is ultimately dependent on mutation and thus characterizing mutation rates and biases, within and among genomes, is a prerequisite for study-ing genomics and molecular evolution. For example, comparative genomics requires an understanding of mu-tation dynamics in different lineages (e.g., Dermitzakiset al.2002), and compositional patterns such as the pos-sible isochore structure in vertebrates (Bernardi2000,
but see Cohenet al.2005) cannot be adequately studied
without an understanding of how mutation bias varies along chromosomes (e.g., Duretet al.2002). Increasingly,
analyses of large SNP data sets, such as the recent analysis of 2,576,903 human SNPs (Zhao and Boerwinkle
2002), are proving to be valuable for studies of mutation bias. The availability of SNP data from many different taxa now makes it feasible to develop a more detailed knowledge of factors that contribute to variation in mu-tational biases.
A number of analyses of mutations have demon-strated that context, or the composition of nucleotides flanking a mutation, can have a significant influence on both mutation bias and overall mutation rate (Bulmer
1986; Morton1995; Krawczaket al.1998; Zhao and
Boerwinkle 2002; Morton 2003). Although context
effects are not often considered in studies that apply mutation parameters (although see Arndtet al.2003;
Siepeland Haussler2003), there is evidence that
un-derstanding and incorporating such effects may be very important for interpreting genomic data (Morton
2003; Siepeland Haussler2003) since they can result
in variation in mutation dynamics across sites. In nu-clear genes, the most apparent neighboring nucleotide effect that has been studied to date is the CpG effect, which is an increased rate of transitions at CpG di-nucleotides as a result of deamination of methylated CpG sites (Duncan and Miller 1980; Bulmer 1986;
Cooperand Youssoufian 1988). The CpG effect has
been primarily studied in vertebrate genomes (Krawczak
et al.1998; Zhao and Boerwinkle2002; Fryxelland
Moon2005), and in human sequences there is a
five-fold increase in the rate of transitions at CpG sites due to deamination of methylated cytosines (Krawczak
et al.1998). The CpG effect appears to be weaker in G1
C-rich regions, possibly due to greater local helix stabil-ity (Fryxelland Moon2005), and appears to be slightly
stronger on the coding strand than on the template strand near genes (Krawczaket al.1998).
Context dependency of mutations has also been studied in grass chloroplast DNA (cpDNA; Morton
1995, 2003). In this genome there is a significant correlation between the A1T content of the two sites flanking a mutation (the A/T context) and both the overall substitution rate and the transition:transversion
1Corresponding author: Department of Biological Sciences, Barnard
College, Columbia University, 3009 Broadway, New York, NY 10027. E-mail: [email protected]
(Ts:Tv) bias, due to a decreasing rate of transition sub-stitutions as the A/T context increases (Morton2003).
Since the observed context dependency is not consis-tent with CpG deamination, and since CpG methylation is not known to occur in cpDNA, it has been suggested that factors such as polymerase fidelity and variable re-pair efficiency may be responsible for context-dependent mutation biases (Morton2003). Neighboring base
com-position also influences substitution dynamics in cpDNA in other ways; both the bias toward A1T and the bias toward pyrimidines are a function of context (Morton
2003). Similar context-dependent mutation patterns appear to exist in cpDNA across different flowering-plant lineages (Morton1997; Yanget al.2002).
Given the growing body of evidence regarding con-text dependency and the lack of data about regional variation in mutation properties, there is a need to bet-ter understand context dependency and how mutation dynamics vary across individual genomes. To further our understanding of mutational context and variation, we have analyzed a large SNP data set generated from nuclear genes of maize (Zea maysssp. mays) with respect to both regional and flanking base composition. We find evidence that the A1T content of flanking nucle-otides has an influence on various aspects of mutation dynamics and report a correlation between regional base composition and both CpG effect and the relative rates of GC/AT and AT/GC mutations, or GC/AT mutation pressure.
MATERIALS AND METHODS
Sequence data:The sequence data analyzed in this article were reported previously (Wrightet al.2005; Yamasakiet al.
2005; GenBank nos. BV123534–BV144210, BV446558–BV447590, and BV106362–BV123527). Briefly, PCR primers were de-signed to amplify the 39 regions of 2000 sequences from the Maize Mapping Project/Dupont unigene set (http://www. agron.missouri.edu/files_dl/MMP/Cornsensus). For each locus, PCR was performed on genomic DNA from 14 individuals representing the genetic diversity of modern maize inbreds. The sequencing, processing, alignment, and quality of the DNA sequence data were described previously (Wrightet al.
2005; Yamasakiet al.2005).
We modified the alignments in three ways. First, any SNP site that was not supported by a phred quality score of at least 30 for both variants was assigned an ‘‘N’’ for all individuals and ignored in analyses. Second, some alignments were modified slightly to correct for apparent indel errors in coding regions (see below). Third, some loci were excluded from our ana-lyses, either because they did not contain sequences from at least four of the inbred lines or because coding region as-signment was uncertain. In total we analyzed 1776 loci with an average A1T content of 53.0% and a variance of 7.3%.
Definition of coding and noncoding regions: To define coding regions, the unigene sequences were compared to the annotated rice peptide set (version 2 at http://www.tigr.org) and Arabidopsis peptide set (http://www.ncbi.nlm.nih.gov/ on August 16, 2004) with BLASTx. Any hit with ane-value,1e-5 was retained and considered a putative protein coding region (pCDS). The pCDS for each unigene was also estimated by
finding the longest open reading frame on the basis of analyses with the bio perl module ‘‘getorf ’’ of the EMBOSS package (Riceet al. 2000). Getorf was applied without
as-suming 59–39 directionality and without assuming the pres-ence of a start codon.
To ascertain whether any portion of pCDSs from unigenes were present in genomic alignments, we compared the pCDS to genomic data with BLASTn. All BLAST hits with ane-value
,1e-5 were retained, as were the extreme 59and 39sites of the region(s) of the pCDS aligned by BLAST. The portion of the pCDS defined by the 59and 39sites was aligned to the entire genomic alignment with the program sim4 (Florea et al.
1998), using default settings. Sim4 aligns EST sequence to genomic sequence while accounting for genomic features such as consensus intron/exon junctions. Each alignment was also edited by hand both to confirm consensus intron/exon junctions and to eliminate 1-bp indels in coding regions, which were assumed to be sequencing errors when present in only one or two sequences. If there were larger indels or potential frameshifts, the coding region definition was con-sidered ambiguous and the locus was removed from analysis. The 1776 alignments used in this study, including coding regions, are available from http://gautlab.bio.uci.edu/data.
Analysis of mutations:The alignments were analyzed using a Java package written by one of the authors (B. R. Morton). Sites with a gap introduced into any sequence and SNPs at sites defined as coding were excluded from the analyses. At every variable noncoding site the most parsimonious number of changes was assumed and, given the lack of data from an outgroup taxon, mutations were polarized using the most frequent nucleotide at that site. The reliability of this method of polarization has yet to be established, so any conclusions dependent upon polarization must be considered in this light. As data from outgroup taxa become available, they will allow us to evaluate the validity of this method of polarization.
The context of every site, conserved or variable, was cal-culated using the majority base at the appropriate neighbor-ing site(s). The contexts analyzed were (1) composition of the 59neighbor, (2) composition of the 39neighbor, (3) com-position of the two 59neighboring nucleotides, (4) composi-tion of the two 39neighboring nucleotides, (5) composition of both the 59and 39neighbor, and (6) the composition of the four flanking nucleotides, two on each side. Note that all sites occur in multiple contexts since many of these cases overlap. Heterogeneity in mutation dynamics among contexts was assessed by a likelihood-ratio test, or G-test (Sokaland Rohlf
1995).
For every context we analyzed mutations as both polarized and unpolarized. For unpolarized changes we simply scored the change as a transition or a transversion. For those sites where there were two changes possible, due to three character states across the sequences, we inferred one transversion (which is necessary) and one unknown change. The latter were included in rate calculations but not in transition:trans-version calculations. Only 74 of the 5932 noncoding SNP sites (1.2%) had multiple changes and exclusion of these sites did not affect the conclusions (data not shown). For the analysis of polarized mutations we generated 434 mutation matrices for every context analyzed. For each matrix, the entrymijis the number of sites observed to have a change from nucleotide i to nucleotide j, with the matrix diagonal representing the con-served sites. The rate of each mutation type was then cal-culated from the matrix by dividing each element by the row total. In addition, for each matrix we calculated the stationary vector (Morton2003), which represents the expected
We also examined regional effects on mutation. For this we calculated the overall A1T content of each locus, including both coding and noncoding sites, and then divided the loci into five classes: (1) A1T,48%, (2) 48%#A1T,52%, (3) 52%#A1T,56%, (4) 56%#A1T,60%, and (5) A1T$
60%. Mutations occurring in loci within each class were then grouped and analyzed together.
RESULTS
Sequence composition:We analyzed data from a re-sequencing project in which loci were sequenced from genomic DNA of up to 14 maize inbred lines (Wright
et al. 2005; Yamasaki et al. 2005). Each locus is a
single transcribed region of the genome that was ampli-fied using primers designed from a unigene sequence. An alignment was generated for each locus using the coding strand sequence data. We examined 1776 of these loci for which the coding regions could be reliably defined with an average sample size of n ¼ 12.1 se-quences. The 1776 loci represent a combined align-ment length of 531,503 nucleotides, of which 260,475 (49.0%) are noncoding. A total of 10,472 SNPs repre-senting2% of the sites were scored. A total of 5932 (56.6%) of the SNPs were at noncoding sites. Each SNP was scored in two ways: as an unpolarized (nondirec-tional) change and as a polarized (direc(nondirec-tional) change, for which the most frequent nucleotide at the site was taken as the ancestral state.
The distribution of A1T content from these loci is shown in Figure 1 for all sites as well as for only non-coding sites. In general the loci are slightly A1T-rich with an average A1Tcontent of 53.0%. The noncoding sites are only slightly higher in A1T content, with an average composition across loci of 55.1% A1T. Along with the bias toward A1T, we observed a consistent bias of G over C and T over A both in the sequences overall and in only the noncoding sites (a ‘‘GT skew’’). If we measure the T-A skew by (TA)/(T1A) and the G-C skew by (G C)/(G1C), the T-A skew in the
non-coding sites of our data is 12.0% while the G-C skew at noncoding sites is 5.6%. This skew toward G and T in the noncoding regions near genes is similar to a recent observation of human genes (Louieet al.2003).
To study the effect of regional composition on mu-tation bias, loci were divided by A1T content into the following categories: (1) A1T,48%, (2) 48%#A1
T,52%, (3) 52%#A1T,56%, (4) 56%#A1T,
60%, and (5) A1T$60%. These will be referred to as the regional composition classes. The results reported here are for the SNPs at noncoding sites but all con-clusions discussed below were unchanged when analyses were repeated using all SNPs, although the higher proportion of noncoding SNPs relative to noncoding sites may reflect constrained sites within the coding regions. In addition, varying the categories into which loci were divided by A1T content did not change the general results (data not shown).
General mutation patterns: Overall, the polarized SNP data yielded a G and C nucleotide mutation rate (the GC rate) that is1.6 times the rate of mutation for A and T nucleotides (the AT rate) (Table 1). The higher GC rate could potentially be due to the CpG effect, which is discussed in detail below. However, when the GC and AT rates were calculated for different 59and 39
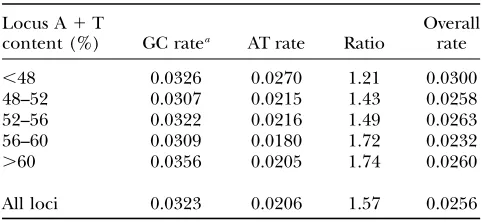
flanking nucleotides, there was a higher GC rate in every context. Thus, although the effect of CpG deamination is apparent in the higher GC rates when there is a 59C or a 39G (Table 1), the CpG effect cannot account for the overall higher GC rate. The ratio of GC-to-AT rates, which reflects the mutational AT pressure, varies across the regional composition classes; the GC:AT rate ratio is higher in those regions with a higher A1T content and lower in those regions with a lower A1T content (Table 2). This variation in mutation pressure is discussed in more detail below. Note that the rates in Table 1 tend to be slightly lower than the rates in Table 2 since ac-counting for context reduces the number of sites in the analysis by eliminating the first and/or last sites as well as any internal site for which context is ambiguous.
Figure 1.—Distribution of
We also examined mutation bias by looking at the Ts:Tv ratio, which has not been well characterized in plant nuclear genomes. Overall, transitions occur at a rate1.5 times that of transversions (Table 3). This ratio is consistent across loci: although there is a slight vari-ation in this ratio across loci as a function of regional composition, the variation is not significant (G¼3.6,
P.0.05). The maize nuclear Ts:Tv ratio is slightly higher than that of grass cpDNA, which shows an overall 1.3:1 Ts:Tv ratio. Note, however, that the Ts:Tv ratio in grass cpDNA ranges from,1 to.2.5 as a function of flanking base composition (Morton2003).
The effect of cytosine deamination: To examine the influence of context on mutation bias, we first com-pared the frequency of transition events at CpG dinu-cleotides, which are known to be methylated in plant nuclear DNA, to the transition rate at other dinucleo-tides. Deamination of methylated cytosines at CpG di-nucleotides is known to generate a significant increase in transition rate in many vertebrate taxa (Krawczak
et al.1998; Fryxelland Moon2005) so we
hypothe-sized that a similar CpG effect would exist in our data.
Since both strands at a CpG dinucleotide are meth-ylated, deamination will lead to the observation of either a CG/CA change, for a deamination on the template strand, or a CG/TG change if the deamina-tion is on the coding strand. To measure the CpG effect, we compared the rate of transition in the CpG context to the average rate in all other contexts. For the tem-plate strand this involved calculating the ratio of the rate of CG/CA changes to the average rate of AG/AA, TG/TA, and GG/GA changes. For deamination on the coding strand we calculated the ratio of the rate of CG/TG changes to the average of CA/TA, CT/TT, and CC/TC. The average CpG effect was then calculated as the average of the two strand values.
Using the polarized SNP data (see materials and methods) the rates of mutation for each dinucleotide
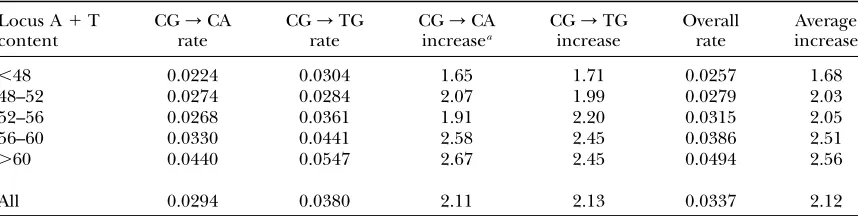
are shown in Table 4. Overall there is a 2.1-fold increase in transition rate in the CpG context relative to other contexts and this increase at CpG dinucleotides is significant (G¼78.0,P,106). The CpG effect is also
apparent when the rates of all possible dinucleotide changes are compared: the various transitions have higher rates of change than transversions do, as expected from the Ts:Tv . 1 described above, with the highest rates being transitions from the CpG dinucleotide CG/CA and CG/TG changes (Figure 2). Across the regional composition classes there is a correlation between the CpG effect and regional A1T content with A1T-rich regions showing a much stronger CpG effect than A1 T-poor regions (Table 4). There is also a significant in-crease in CpG transition rate with increasing regional A1T content (G¼21.3,P,0.001).
When we compared the rate of CpG transition for the two different strands, the rate of CG/CA was found to be significantly lower than the rate of CG/TG (G¼
7.1, P , 0.01). Both CG/CA and CG/TG rates increase with increasing regional A1T content but the latter rate is higher in each composition class. These data suggest that the two DNA strands are affected differently by CpG deamination, similar to the data from humans (Krawczaket al.1998). However, there is no apparent
difference in the increase of CG/CA changes and the CG/TG changes relative to G/A and C/T
TABLE 1
Rates of change from G or C nucleotides as compared to A or T nucleotides as a function of the flanking base composition
Context GC ratea AT rate Ratio
59A 0.0295 0.0181 1.63
59C 0.0393 0.0205 1.91
59G 0.0314 0.0215 1.46
59T 0.0263 0.0180 1.46
39A 0.0254 0.0174 1.46
39C 0.0286 0.0223 1.28
39G 0.0390 0.0173 2.26
39T 0.0318 0.0213 1.49
All 0.0323 0.0207 1.56
a
Rates are given as the rate of change from G or C (GC rate) and the rate of change from A or T (AT rate).
TABLE 2
A comparison of GC and AT rates across the regional composition classes
Locus A1T
content (%) GC ratea AT rate Ratio
Overall rate
,48 0.0326 0.0270 1.21 0.0300
48–52 0.0307 0.0215 1.43 0.0258
52–56 0.0322 0.0216 1.49 0.0263
56–60 0.0309 0.0180 1.72 0.0232
.60 0.0356 0.0205 1.74 0.0260
All loci 0.0323 0.0206 1.57 0.0256
Rates are given as described in Table 1. a
Loci are divided as described in the text.
TABLE 3
Observed transitions and transversions across the regional composition classes
Locus A1T
content (%) No. of Ts No. of Tv Ratio
,48 393 295 1.33
48–52 383 266 1.44
52–56 771 500 1.54
56–60 880 608 1.45
.60 699 445 1.57
transitions, respectively (Table 4), so it is possible that the rate differences between CG/CA and CG/TG are more general than only CpG deamination. Overall, our data do not unambiguously indicate a difference in CpG effect between the two strands.
Context and transition:transversion bias:In addition to the apparent effect of methylated cytosine deamina-tion, we studied the general relationship between neigh-boring base composition and mutation bias. Given the observation from grass cpDNA that flanking base A1T content is correlated with mutation bias (Morton
2003), we divided all sites into three categories depend-ing on the number of A/T base pairs (0, 1, or 2) in the two immediate neighbors and defined this as the A/T context. SNPs that differed in A/T context were then analyzed separately for comparison.
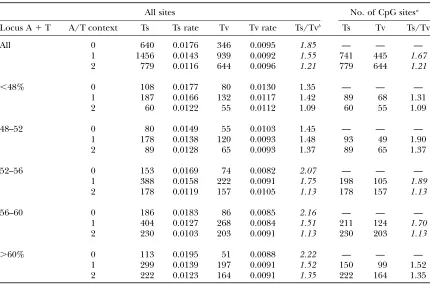
As observed in cpDNA, we found a significant nega-tive correlation between A/T context and Ts:Tv due to a decreasing rate of transitions with increasing A/T context (Table 5). This decreasing rate of transitions also results in a significant decrease in overall mutation rate with increasing A/T context. From Table 5, the overall rates of mutation in the A/T¼0, A/T¼1, and A/T ¼ 2 contexts are 0.0276, 0.0238, and 0.0218, re-spectively. A comparison of variable (SNP) to conserved sites reveals that this variation in rate among contexts is significant (G¼26.8,P,105). The negative
correla-tion between A/T context and transicorrela-tion bias was ob-served in the regional composition classes where A1
T.52% but not in the regions with lower A1T content. Unlike the case for cpDNA, however, this correlation between Ts:Tv and A/T context in nuclear DNA could be due solely to the CpG effect. To remove the CpG effect, we repeated the analysis for the A/T ¼ 1 and A/T¼2 contexts using only sites without a 59C or 39G. (There is only a single A/T¼2 context without a poten-tial CpG—sites with a 59G and 39C—so we excluded this context altogether.) There was still a significant differ-ence in Ts:Tv between the A/T¼1 and A/T¼2 con-texts (G¼15.9,P,104) and, again, this context effect
tended to be significant in regions with higher A1T
content (Table 5). The data in Table 5 show that flanking bases influence mutations beyond the CpG effect and in a manner similar to what is observed in cpDNA. The variation in Ts:Tv across the three A/T con-texts, however, is weaker in these data than in cpDNA (Morton2003).
Previous studies of other taxa have indicated that nucleotides beyond immediate neighbors can influence nucleotide mutation biases (Krawczak et al. 1998;
Morton2000; Zhaoand Boerwinkle2002). We thus
examined the effect of context beyond the nucleotide sites that immediately flank an SNP. However, previous studies have not always separated the effects of imme-diate neighbors from the composition of more distant nucleotide sites (Zhaoand Boerwinkle2002). In our
analysis we controlled for the composition of the im-mediate neighbors by holding the composition of these sites constant and then comparing the composition of the nucleotides one base removed, both 59and 39, from the SNP sites. For these data, we assessed both mutation rate and the Ts:Tv ratio. No significant relationship was found between the composition of these sites and either mutation rate or bias (data not shown).
Context and mutational AT pressure: In this section we examine the relationship between context and GC/
AT pressure using the polarized SNP data. All sites, both conserved and SNP, were separated by context. Two different sets of contexts were used: (1) A/T context (number of A/T base pairs immediately flanking the site, as above) and (2) regional A1T composition (the regional composition classes described above). Using all sites within a specified context, we generated a 43 4 matrix wherepijis the rate of change from nucleotide
i to nucleotide j in that context as described inmaterials and methods. Once the matrix for each context was
determined, the matrices wereanalyzed using two ap-proaches. The first approach involved finding the equi-librium composition of a sequence evolving under each mutation model. This was determined by calculating the stationary vector for each matrix, which represents the expected equilibrium distribution for that mutation
TABLE 4
Rates of transitions at CpG dinucleotides relative to transitions at other dinucleotides
Locus A1T content
CG/CA rate
CG/TG rate
CG/CA increasea
CG/TG increase
Overall rate
Average increase
,48 0.0224 0.0304 1.65 1.71 0.0257 1.68
48–52 0.0274 0.0284 2.07 1.99 0.0279 2.03
52–56 0.0268 0.0361 1.91 2.20 0.0315 2.05
56–60 0.0330 0.0441 2.58 2.45 0.0386 2.51
.60 0.0440 0.0547 2.67 2.45 0.0494 2.56
All 0.0294 0.0380 2.11 2.13 0.0337 2.12
model (seematerials and methods). For the second
approach we compared the GC/AT and AT/GC mutation rates within each matrix.
A correlation is observed between the A/T context and equilibrium A1T composition (Table 6). As A/T context increases, predicted equilibrium A1T content of a site decreases. This trend is observed across the re-gional composition classes, indicating that sites evolving in a local context that is more A1T rich are themselves less biased toward A and T than sites in a local context that is A1T poor. The opposite trend is observed across regional composition classes. SNPs in loci that are more A1T rich overall predict a higher A1T bias than SNPs in loci that are relatively A1T poor (Table 6). There-fore, variation across regional composition classes cannot be explained by the influence of immediate neighbors since the two influences are in opposite directions and must represent some other feature of mutations.
The second approach, comparing GC/AT and AT/
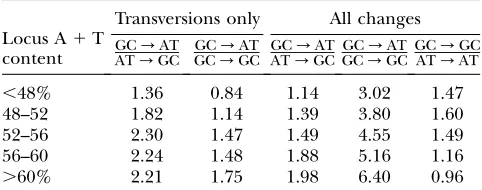
GC mutation rates directly, yielded similar results. As shown in Table 2, the GC:AT rate ratio increases with increasing regional A 1 T content. However, the GC and AT rates presented above were not limited to the GC/AT and AT/GC changes, which determine AT pressure. Therefore, we partitioned the GC and AT rates into two components each: the GC rate into GC/AT and GC/GC rates and the AT rate into AT/GC and AT/AT rates. The data demonstrate that the regional A 1 T content is correlated with GC/AT mutation pressure; the ratio of GC/AT:AT/GC rates in-creases with increasing regional A1T content as does the ratio of GC/AT:GC/GC change rates (Table 7). On the other hand, the rate of GC/GC transversions is not much higher than the rate of AT/AT transver-sions and this ratio decreases with increasing regional A1T content (Table 7), indicating that it is specifically
Figure2.—The rate of every dinucleotide
GC/AT rates that are associated with regional com-position, not only a general GC mutation rate.
Since transitions occur at a higher rate than trans-versions and GC/ATchanges include transitions while GC/GC changes do not, we repeated the analysis using only G/Tand C/A as well as T/G and A/C transversion mutations. These data show the same cor-relation between regional A1T content and GC/AT pressure (Table 7). Overall, the mutation dynamics shown in Tables 6 and 7 demonstrate a bias toward GC/AT changes, a bias that is stronger in regions with higher
A1T content, and show a direct relationship between AT pressure and regional composition.
DISCUSSION
The SNP analyses presented here yield some of the first data about context and variation in mutation dy-namics within a genome. They demonstrate that con-text has a significant influence on mutation dynamics in maize nuclear DNA: there is a relationship between flanking base composition and mutation bias, an in-creased rate of transitions at CpG dinucleotides, and a relationship between regional base composition and GC/AT pressure. We should note that a number of our observations are based on polarizing mutations. For our analyses we polarized mutations by using the majority base at each site to infer the original state. This will not affect the analyses concerning flanking base effect on rate and transition bias and, therefore, the overall conclusions about context effects. In addition, although the polarization does allow us to infer the mutation rate away from CpG dinucleotides and pro-vides stronger evidence, the high rate of transitions at these sites is in itself strong support for a CpG effect. Conclusions based on predicted equilibrium composition and GC/AT pressure are, however, fully dependent on
TABLE 5
Transition:transversion ratio as a function of A/T context
All sites No. of CpG sitesa
Locus A1T A/T context Ts Ts rate Tv Tv rate Ts/Tvb Ts Tv Ts/Tv
All 0 640 0.0176 346 0.0095 1.85 — — —
1 1456 0.0143 939 0.0092 1.55 741 445 1.67
2 779 0.0116 644 0.0096 1.21 779 644 1.21
,48% 0 108 0.0177 80 0.0130 1.35 — — —
1 187 0.0166 132 0.0117 1.42 89 68 1.31
2 60 0.0122 55 0.0112 1.09 60 55 1.09
48–52 0 80 0.0149 55 0.0103 1.45 — — —
1 178 0.0138 120 0.0093 1.48 93 49 1.90
2 89 0.0128 65 0.0093 1.37 89 65 1.37
52–56 0 153 0.0169 74 0.0082 2.07 — — —
1 388 0.0158 222 0.0091 1.75 198 105 1.89
2 178 0.0119 157 0.0105 1.13 178 157 1.13
56–60 0 186 0.0183 86 0.0085 2.16 — — —
1 404 0.0127 268 0.0084 1.51 211 124 1.70
2 230 0.0103 203 0.0091 1.13 230 203 1.13
.60% 0 113 0.0195 51 0.0088 2.22 — — —
1 299 0.0139 197 0.0091 1.52 150 99 1.52
2 222 0.0123 164 0.0091 1.35 222 164 1.35
a
Data for the A/T¼1 and A/T¼2 categories when possible CpG sites are excluded. bSignificant variation at the 1% level, as assessed by a G-test, is indicated by italics.
TABLE 6
Predicted equilibrium A1T content given the observed mutation dynamics in loci of different composition
Locus A1T content
A/T context ,48% 48–52 52–56 56–60 .60% All loci
0 53.6 62.9 63.8 66.6 76.9 64.9
1 55.6 56.7 60.3 68.2 66.5 63.1
2 53.9 53.1 58.8 63.8 60.6 59.8
All 53.1 58.1 60.0 65.4 66.2 62.0
polarizing the mutations that allow us to generate the 434 matrices. Future analysis using an outgroup taxon will allow us to examine these effects and to assess the validity of using the majority base to polarize mutations.
The most notable context effect is an elevated rate of CG/TG and CG/CA transitions relative to other transitions (Figure 2). Given the existence of CpG methylation in plants (Tariqand Paszkowski 2004),
this rate elevation is most likely the result of a de-amination of methylated cytosines at these dinucleo-tides. It is difficult to compare the magnitude of the CpG effect observed here directly to studies of nonplant taxa since methodologies differ, but it appears that the increase in transition rate that we observed at CpG sites, roughly a 2.1-fold increase relative to the transition rate at other sites, is not as high as what has been observed in vertebrates (Krawczaket al.1998). Although we
ob-serve an overall 2.1-fold increase in transition rate due to CpG deamination, this increase ranges from a 1.7-fold increase in regions with lower A1T content (,48%) to a 2.6-fold increase in regions with higher A1T content (.60%) and shows a general increase with increasing regional A1T content (Table 4). This trend may reflect variation in the degree of CpG methylation across loci or that repair of deamination products is more efficient in G1C-rich regions (Fryxelland Moon2005).
Along with a significant CpG effect, there are other influences of context on mutations apparent in our data. In particular, the composition of the two immedi-ate neighbors, one 59and one 39, of the mutation site is correlated with overall rate, transition bias, and GC/
AT pressure. These effects are similar to what is ob-served in grass cpDNA and it is likely that they are due to an influence of local composition on polymerase misincorporation or mismatch repair (Morton 1995,
2003). The similar relationship between context and mutation properties in both nuclear and cpDNA is in-teresting since it suggests shared replication and/or repair processes or that these properties are fundamen-tal to mutations. Much remains to be learned about replication and repair in plants, but it is known that the two genomes do not share the same replication ma-chinery and have significant differences in repair dy-namics (Heinhorstand Cannon1993; Cannonet al.
1995; Hada et al.1998; Kimura et al.2002, 2005). As
more is uncovered about the replication and repair processes in the two genomes, we should be able to better understand the causes of similar context effects. Although we found a correlation between the com-position of the two immediate neighbors and mutation properties, we did not see a clear relationship between mutation and the composition of individual neighbor-ing nucleotides that do not flank the mutation. This contrasts with a recent study of human SNPs (Zhao
and Boerwinkle2002). Again, however, differences in
methodology make it difficult to draw any specific con-clusions about differences in context effects. In our study we controlled for the composition of the imme-diate neighbors, something that was not done in the study of human SNPs. Thus, it is possible that the hu-man SNP study confounded immediate flanking base effects and nonrandom dinucleotide composition.
Despite the lack of correlation between specific indi-vidual nucleotides beyond the immediate neighbors and mutation dynamics, we do observe a correlation between regional composition and GC/AT mutation pressure. It is possible that this correlation is not a con-text effect but a secondary effect arising from a relation-ship between chromosome location and replication/ mutation dynamics. For example, a correlation between location, replication time and the available nucleotide pool, which could affect misincorporation biases, could potentially lead to a relationship along the lines of what we observe.
One interesting feature of our inferred mutation dynamics is that they predict an A1T content at equi-librium that is higher than the observed base com-position. Although we observe a correlation between regional A1T content and predicted A 1T content (Table 6), the observed A1T content is lower than ex-pected in each of the regional composition classes. If we group all mutations from our data set into one matrix, we predict an A 1T content of 62.0% at equilibrium (Table 6), which is higher than the average regional A1
T content of 55.1% observed for noncoding sites. Al-though, as stated above, the predicted equilibrium may not be accurate since the context of most sites will vary over time, the fact that in every composition class even the lowest predicted equilibrium A1T (typically in the A/T ¼2 context) is higher than the observed A 1T indicates a real discrepancy. This discrepancy is similar to what was observed in noncoding cpDNA (Morton
2003) and suggests two possibilities. One is that the sequence is not at equilibrium and the A1T content is increasing in this lineage, as has been proposed recently for other taxa (e.g., Duretet al.2002; Tiffinand Hahn
2002; Ebersbergerand Meyer2005). The other is that
there is a fixation bias, such as selection or biased gene conversion. Investigating these two possibilities in fu-ture studies should yield important insights into plant mutational dynamics.
TABLE 7
Rates of GC / AT mutations expressed relative to other mutation rates
Locus A1T content
Transversions only All changes GC/AT
AT/GC GC
/AT GC/GC GC
/AT AT/GC GC
/AT GC/GCGC
/GC AT/AT
,48% 1.36 0.84 1.14 3.02 1.47
48–52 1.82 1.14 1.39 3.80 1.60
52–56 2.30 1.47 1.49 4.55 1.49
56–60 2.24 1.48 1.88 5.16 1.16
Finally, the mutation dynamics inferred from the SNP data predict the GT skew observed in the data (see
results). The total 434 matrix inferred from the SNPs
predicts an equilibrium composition of 20.0% G, 18.0% C, 28.0% A, and 34.1% T, which is a 9.8% skew of T over A and a 5.3% skew of G over C, similar to the 12.0% and 5.6% T-A and G-C skews, respectively, observed in the noncoding sequences. Similar T-A and G-C skews are found when we consider SNPs in the different contexts described above (data not shown). Since our alignments are of coding strand sequences in transcribed regions, they further suggest the possibility that the bias is as-sociated with transcription.
This skew toward T over A and G over C has recently been reported for human genes (Louie et al. 2003).
Since, like our data, their observation was for noncoding sequences near genes on the coding strand and is found across numerous loci, they proposed that the skew was due to a transcription-coupled mismatch repair system. If this is the case, then the similar finding in our data suggests a similar mechanism in plant nuclear genes. It also raises the possibility that the G over C and T over A skew observed along the leading strand in prokaryotic genomes (Lobry1996; McInerney1998; McLeanet al.
1998; Morton 1999) is at least partially the result of
a transcription-coupled repair mechanism. The possi-bility of a transcription-coupled repair mechanism has significant implications for our understanding of com-positional bias in genes, such as codon usage bias.
The authors thank Stephen Wright, Richard Morton, Brian Golding, Shozo Yokoyama, and two anonymous reviewers for helpful com-ments. This work supported by National Science Foundation grants DBI0096033, DBI9872655, and DBI0321467 and by the United States Department of Agriculture-Agricultural Research Service.
LITERATURE CITED
Arndt, P. F., C. B. Burgeand T. Hwa, 2003 DNA sequence
evolu-tion with neighbor-dependent mutaevolu-tion. J. Comput. Biol. 10:
313–322.
Bernardi, G., 2000 Isochores and the evolutionary genomics of
ver-tebrates. Gene241:3–17.
Bulmer, M., 1986 Neighboring base effects on substitution rates in
pseudogenes. Mol. Biol. Evol.3:322–329.
Cannon, G. C., L. A. Hedrick and S. Heinhorst, 1995 Repair
mechanisms of UV-induced DNA damage in soybean chloro-plasts. Plant Mol. Biol.29:1267–1277.
Cohen, N., T. Dagan, L. Stoneand D. Graur, 2005 GC
Composi-tion of the human genome: in search of isochors. Mol. Biol. Evol.
22:1260–1272.
Cooper, D. N., and H. Youssoufian, 1988 The CpG dinucleotide
and human genetic disease. Hum. Genet.78:151–155. Dermitzakis, E. T., A. Reymond, R. Lyle, N. Scamuffa, C. Ucla
et al., 2002 Numerous potentially functional but non-genic conserved sequences on human chromosome 21. Nature420:
578–582.
Duncan, B. K., and J. H. Miller, 1980 Mutagenic deamination of
cytosine residues in DNA. Nature287:560–561.
Duret, L., M. Semon, G. Piganeau, D. Mouchiroudand N. Galtier,
2002 Vanishing GC-rich isochores in mammalian genomes. Genetics162:1837–1847.
Ebersberger, I., and M. Meyer, 2005 A genomic region evolving
towards different GC contents in humans and chimpanzees
indi-cates a recent and regionally limited shift in the mutation pat-tern. Mol. Biol. Evol.22:1240–1245.
Florea, L., G. Hartzell, Z. Zhang, G. M. Rubinand W. Miller,
1998 A computer program for aligning a cDNA sequence with genomic DNA sequence. Genome Res.8:967–974.
Fryxell, K. J., and W.-J. Moon, 2005 CpG mutation rates in the
hu-man genome are highly dependent on local GC content. Mol. Biol. Evol.22:650–658.
Hada, M., T. Hashimoto, O. Nikaidoand M. Shin, 1998
UVB-induced DNA damage and its photorepair in nuclei and chloro-plasts ofSpinacia oleraceaL. Photochem. Photobiol.68:319–322. Heinhorst, S., and G. C. Cannon, 1993 DNA replication in
chlo-roplasts. J. Cell Sci.104:1–9.
Kimura, S., Y. Uchiyama, N. Kasai, S. Namekawa, A. Saotomeet al.,
2002 A novel DNA polymerase homologous to Escherichia coli DNA polymerase I from a higher plant, rice (Oryza sativaL.). Nucleic Acids Res.30:1585–1592.
Kimura, S., T. Ishibashi, T. Yamamoto and K. Sakaguchi,
2005 DNA repair in higher plants. Seikagaku77:113–123. Krawczak, M., E. V. Balland D. N. Cooper, 1998
Neighboring-nucleotide effects on the rates of germ-line single-base-pair sub-stitution in human genes. Am. J. Hum. Genet.63:474–488. Lobry, J. R., 1996 Asymmetric substitution patterns in the two DNA
strands of bacteria. Mol. Biol. Evol.13:660–665.
Louie, E., J. Ott, and J. Majewski, 2003 Nucleotide frequency
variation across human genes. Genome Res.13:2594–2601. McInerney, J. O., 1998 Replicational and transcriptional selection
on codon usage inBorrelia burgdorferi.Proc. Natl. Acad. Sci. USA
95:10698–10703.
McLean, M. J., K. H. Wolfeand K. M. Devine, 1998 Base
compo-sition skews, replication orientation, and gene orientation in 12 prokaryote genomes. J. Mol. Evol.47:691–696.
Morton, B. R., 1995 Neighboring base composition and
transver-sion/transition bias in a comparison of rice and maize chloroplast noncoding regions. Proc. Natl. Acad. Sci. USA92:9717–9721. Morton, B. R., 1997 Rates of synonymous substitution do not
indi-cate selective constraints on the codon bias of thepsbAgene. Mol. Biol. Evol.14:412–419.
Morton, B. R., 1999 Strand asymmetry and codon usage bias in the
chloroplast genome ofEuglena gracilis.Proc. Natl. Acad. Sci. USA
96:5123–5128.
Morton, B. R., 2000 Codon bias and the context dependency of
nucleotide substitutions in the evolution of plastid DNA. Evol. Biol.31:55–103.
Morton, B. R., 2003 The role of context-dependent mutations in
generating compositional and codon usage bias in grass chloro-plast DNA. J. Mol. Evol.56:616–629.
Rice, P., I. Longdenand A. Bleasby, 2000 EMBOSS: the European
mo-lecular biology open software suite. Trends Genet.16:276–277. Siepel, A., and D. Haussler, 2003 Phylogenetic estimation of
context-dependent substitution rates by maximum likelihood. Mol. Biol. Evol.21:468–488.
Sokal, R. R., and F. J. Rohlf, 1995 Biometry. W. H. Freeman,
New York.
Tariq, M., and J. Paszkowski, 2004 DNA and histone methylation
in plants. Trends Genet.20:244–251.
Tiffin, P., and M. W. Hahn, 2002 Coding sequence divergence
be-tween two closely related plant species:Arabidopsis thalianaand Brassica rapassp.pekinensis.J. Mol. Evol.54:746–753.
Wright, S. I., I. V. Bi, S. G. Schroeder, M. Yamasaki, J. F. Doebley
et al., 2005 The effects of artificial selection on the maize ge-nome. Science308:1310–1314.
Yamasaki, M., M. I. Tenaillon, I. V. Bi, S. G. Schroeder, H. Sanchez
-Villedaet al., 2005 A large-scale screen for artificial selection in
maize identifies candidate agronomic loci for domestication and crop improvement. Plant Cell17:2859–2872.
Yang, Y. W., P. Y. Taiand W.-H. Li, 2002 A study of the phylogeny of
Brassica rapa,B. nigra,Raphanus sativaand their related genera using non-coding regions of chloroplast DNA. Mol. Phylogenet. Evol.23:268–275.
Zhao, Z., and E. Boerwinkle, 2002 Neighboring-nucleotide effects on
single nucleotide polymorphisms: a study of 2.6 million polymor-phisms across the human genome. Genome Res.12:1679–1686.