Method on Body Compositional Changes and Productivity in Two Commercial Egg Strains. (Under the direction of Dr. Kenneth E. Anderson.)
Over the last decade, various consumer and welfare groups have taken an interest in the
commercial egg production industry. Due to much scrutiny and criticism, the industry has
looked to alternative ways of production. As the environmental changes have continued to
evolve, the practice of inducing layer hens to molt has also begun to change. While force
molting using a period of fasting from 7 to 10 days was widely accepted in the past, it has
become highly frowned upon in the United States and Europe today. Therefore, many
producers have switched to inducing a molt utilizing a non-anorexic diet. This diet is
formulated to contain nutrients for body maintenance only and does not support egg
production. This alternative molt induction method has been quite effective in the industry
and much research has been done to determine proper molt diets fed during the molt phase.
However, less research has been done to determine the length of time it takes the hen to
achieve the target weight body loss as well where the physiological organ weight loss is
occurring utilizing the non-anorexic method. Therefore, the goal of this research was to help
determine where physiological weight loss is occurring as well as to evaluate the differences
in body weight loss comparing the fasting method and non-anorexic method. This research
will be of value to the industry as a means of helping producers better understand where and
© Copyright 2012 by Melissa Evans
by Melissa Evans
A thesis submitted to the Graduate Faculty of North Carolina State University
in partial fulfillment of the requirements for the degree of
Master of Science
Physiology
Raleigh, North Carolina
2012
APPROVED BY:
_______________________________ Dr. Kenneth E. Anderson
Committee Chair
_______________________________ ______________________________
BIOGRAPHY
Melissa was born and raised in Fort Worth, TX to Stan and Terri Evans. She developed a
passion for horses that included competition in her high school rodeo circuit. This was her
first introduction to livestock and agriculture, which sparked her interest in livestock
production. Her interest in animal agriculture continued to grow prompting her decision to
attend the University of Missouri where she pursued a degree in Animal Science. During her
time there she was selected as a scholar recipient to attend the Center of Excellence Program
with the Midwestern Poultry Consortium. Melissa spent two summers at the University of
Wisconsin taking eighteen hours of intense poultry science courses. After the second
summer with the Consortium she accepted an internship with Hy-Line International Hatchery
in Bryan, TX. Her passion for the poultry industry continued to grow and she developed a
special interest in laying hens. She had a desire to learn more about this industry through
research and classes to further develop her knowledge with layers. Melissa was then
accepted by the Graduate School at North Carolina State University to pursue a Master of
Science in the Physiology program through the Department of Poultry Science. Her advisor,
Dr. Kenneth Anderson, was a vital part in mentoring and guiding her through her studies and
research program. He aided her in preparation for presentations at the Poultry Science
Association research forum in St. Louis, Missouri as well as at the Southern Poultry Science
meeting in Atlanta, Georgia. Melissa’s thesis project consisted of evaluating the
physiological changes in commercial white egg laying hens by utilizing two molt programs.
ACKNOWLEDGMENTS
I would like to give a very special thank you to my advisor and mentor, Dr. Kenneth E.
Anderson, who has guided me through this graduate program and helped me to reach my full
potential through this research. I would also like to thank my committee members, Dr.
Jackie Golden and Dr. James Petitte for their invaluable advisement and input in regards to
this thesis. Another thank you goes out to all those that have helped me to conduct this
research including Pam Jenkins, Vickie Hedgepath, Mike Mann, and Hunter Edward as well
as the entire staff at the Piedmont Research Station in Salisbury, NC. With the help and
encouragement from this important group of people I have accomplished more than I thought
possible. And finally, I would like to thank all of my friends and family for all of their love
and support throughout my time in graduate school; especially my sister, Katie Evans, who
has given me the extra push to help me complete this intensive program at North Carolina
TABLE OF CONTENTS
LIST OF TABLES ... vi
LIST OF FIGURES ... vii
Literature Review... 1
Pre-molt Performance ... 1
Physiological Changes During Molt ... 2
Methods to Molt ... 4
Postmolt Production ... 6
Literature Cited ... 7
EFFECTS OF STRAIN ON PULLET BODY COMPOSITION, FIRST CYCLE HEN PRODUCTION AND EGG QUALITY AND EFFECTS OF MOLT METHOD ON POSTMOLT HEN PRODUCTION AND EGG QUALITY ... 10
Abstract ... 11
Introduction ... 12
Materials and Methods ... 12
Pullet Rearing... 12
Body Composition ... 15
Hen Production ... 16
Molt Treatments ... 21
Production Measurements ... 22
Statistical Analysis ... 23
Results and Discussion ... 23
Pullet Body Composition ... 23
First Cycle Production ... 24
Postmolt Production ... 26
Conclusion ... 31
THE EFFECTS OF MOLTING METHOD ON HY-LINE W98 AND DEKALB WHITE COMMERCIAL LAYER HENS ON BODY WEIGHT AND ORGAN WEIGHT CHANGES ... 33
Introduction ... 35
Materials and Methods ... 36
Hen Production ... 36
Body Weights ... 41
Organ Collection ... 41
Statistical Analysis ... 42
Results and Discussion ... 43
Body Weights ... 43
Organ Measurement ... 51
Conclusion ... 73
LIST OF TABLES
Table 1. 1. Diet Formulations for the Brood-Grow Periods ... 14
Table 1. 2. Pullet Vaccination and Beak Trimming Schedule ... 15
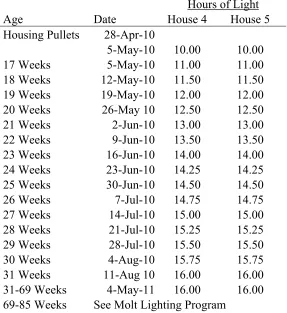
Table 1. 3. Lighting for First Layer Cycle ... 18
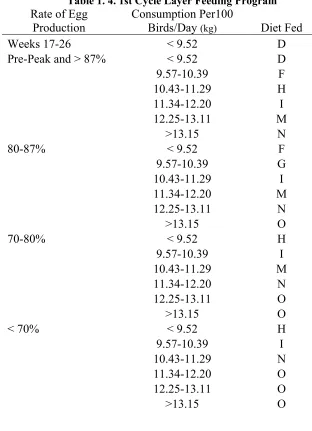
Table 1. 4. 1st Cycle Layer Feeding Program ... 19
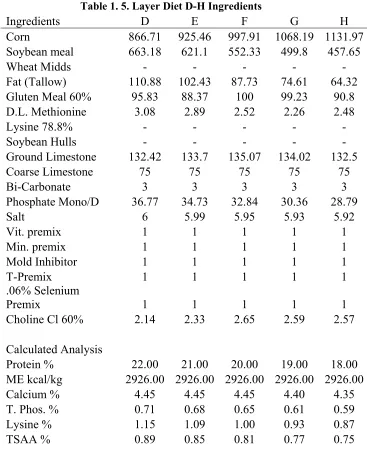
Table 1. 5. Layer Diet D-H Ingredients ... 20
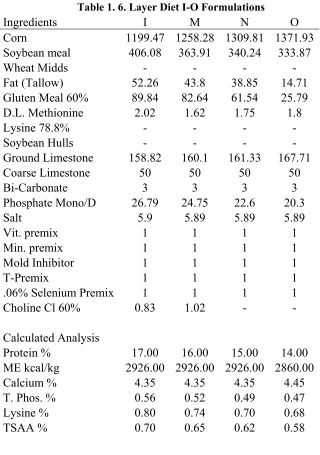
Table 1. 6. Layer Diet I-O Formulations ... 21
Table 1. 7. Strain Comparison of Body Composition at 17 Weeks of Age ... 24
Table 1. 8. First Layer Cycle Hen Production ... 25
Table 1. 9. First Layer Cycle Egg Sizing ... 25
Table 1. 10. First Layer Cycle Egg Grading ... 26
Table 1. 11. Effects of Strain and Molt Treatment on Postmolt Hen Production ... 28
Table 1. 12. Effects of Strain and Molt Treatment on Postmolt Egg Sizing and Grading ... 30
Table 2. 1. Molt Treatment Assignments ... 37
Table 2. 2. Molt Lighting Program ... 39
Table 2. 3. Non-Anorexic Molt Diet and Resting Diet ... 40
Table 2. 4. Body Weight Loss Comparison of Feed Restricted, Anorexic, and Non-Molted by Treatment, Strain, and Day ... 45
Table 2. 5. % Organ Weights for Feed-Restricted, Non-Anorexic, and Non-Molted with Strain during Days 0-12 of Molt ... 54
LIST OF FIGURES
Figure 2. 1. Interaction of Strain*Day on Body Weight Loss in Hy-Line W98 and Dekalb White for Feed Restricted, Non-Anorexic, and Non-Molted from Day 0-12 of Molt ... 46
Figure 2. 2. Interaction of Strain*Day on Body Weight Loss in Hy-Line W98 and Dekalb White for Feed Restricted and Non-Anorexic for Days 0-12 of Molt ... 47
Figure 2. 3. Interaction of Strain*Trt for Average Body Weight in Hy-Line W98 and
Dekalb White for Feed Restricted, Non-Anorexic, and Non-Molted during the Molt ... 48
Figure 2. 4. Interaction of Strain*Trt for Average Body Weight for Feed Restricted and Non-Anorexic during the Molt Period ... 49
Figure 2. 5. Interaction of Trt*Day of Body Weight Loss for Feed Restricted, Non-Anorexic, and Non-Molted for the Average of the Hy-Line W98 and Dekalb White from Day 0-12 of Molt ... 50
Figure 2. 6. Interaction of Trt*Day Body Weight Loss for Feed Restricted and Non-Anorexic for the Average of Hy-Line W98 and Dekalb White Strains for Days 0-12 of Molt ... 50
Figure 2. 7. % Gizzard Weight Changes of Total Body Weight for Feed Restricted, Non-Anorexic, and Non-Molted over the Average of the Strains Hy-Line W98 and
Dekalb White during Days 0-12 of Molt ... 56
Figure 2. 8. % Liver Weight Changes of Total Body Weight for Feed Restricted, Non-Anorexic, and Non-Molted over the Average of the Strains Hy-Line W98 and Dekalb White during Days 0-12 of Molt ... 57
Figure 2. 9. % Ovary Weight Changes of Total Body Weight for Feed Restricted, Non-Anorexic, and Non-Molted over the Average of the Strains Hy-Line W98 and Dekalb White during Days 0-12 of Molt ... 58
Figure 2. 10. % Oviduct Weight Changes of Total Body Weight for Feed Restricted, Non-Anorexic, and Non-Molted over the Average of the Strains Hy-Line W98 and Dekalb White during Days 0-12 of Molt ... 59
Figure 2. 11. % Liver Weight Change by Strain for Days 0-12 of Molt for Feed
Restricted, Non-Anorexic, and Non-Molted ... 60
Figure 2. 13. % Liver Weight Changes of Hy-Line W98 and Dekalb White for Days 0-12 of Molt for Feed Restricted and Non-Anorexic ... 64
Figure 2. 14. % Gizzard Weight when 25% Target Body Weight Loss Reached for Feed Restricted and Non-Anorexic during Molt ... 67
Figure 2. 15. % Liver Weight when 25% Target Body Weight Loss Reached for Feed
Restricted and Non-Anorexic during Molt ... 67
Figure 2. 16. % Small Intestinal Weight when 25% Target Body Weight Loss Reached for Feed Restricted and Non-Anorexic during Molt by Strain ... 68
Figure 2. 17. % Liver Weight when 25% Target Body Weight Loss Reached for Feed
Restricted and Non-Anorexic during Molt by Strain ... 68
Figure 2. 18. % Whole Keel Weight when 25% Target Body Weight Loss Reached for Feed Restricted and Non-Anorexic during Molt by Strain ... 69
Figure 2. 19. % Ovary Weight When 25% Target Body Weight Loss Reached for
Strain*Molt Treatment during Molt... 70
Figure 2. 20. % Body Weight Loss for Non-Anorexic by Strain during Molt ... 71
Figure 2. 21. % Body Weight Loss for Feed Restricted by Strain during Molt ... 72
LITERATURE REVIEW Pre-molt Performance
Wild avian species undergo molts at the end of their natural breeding period (Rice et
al, 1908; Sturkie, 2000). This naturally occurring molt generally coincides with a period of
voluntary anorexia, reproductive quiescence, as well as shedding and replacement of feathers
(Mrosovsky and Sherry, 1980). Molting can be described as a period of time during which
the bird loses feathers and experiences a loss in reproductive function (Berry, 2003).
Manipulating this natural molt process to occur at a specific time within a flock can allow
commercial layer hens to have a successful second laying cycle. As commercial laying hens
age, the rate of egg production as well as shell and internal egg quality continue to decline
after the peak of the first cycle (Clark, 1940; Cunningham, 1960).
When birds are kept for longer than one year, the value of the eggs decrease due to
changes in quality of the eggs laid. Cunningham et. al (1960) determined that as layer hens
increase in age, the Haugh Unit, a measure of internal egg albumen quality (Haugh, 1937),
declines in correlation with a decrease in albumen protein of eggs. Production and egg
quality will continue to decline and hinder profits if the hens are kept past eighty weeks and
not molted (Anderson, 2009). However, if laying hens are induced to molt when their egg
production drops, they can have increased production in a second laying cycle (Brake and
Roland, 1981). Many methods exist to “force” a molt to improve egg quality and post-molt
production profit (Berry, 2003). These methods include a fasted program where the birds are
taken completely off feed of a period of 8, 10, or 12 days (Brake and Thaxton, 1979a,b), as
(Said et al., 1983; Biggs et al., 2003; Koelkebeck and Anderson, 2007; Petek, 2008). All of
these regimens will induce the birds to molt. At the same time, the ovary and oviduct will
regress and rejuvenation occurs allowing the birds to come back into production for a second
laying cycle.
Physiological Changes During Molt
During the short period of molting, whether natural or artificially induced, many
physiological changes occur in the hen. The response of thyroid, adrenal, and ovarian
hormones cause various changes within the body at this time. Brake and Thaxton determined
that thyroid function played an important role in mediating physiological changes within the
body during the molt (1979b). This study revealed that increasing levels of thyroxin
corresponded in time with the initial feather loss, suggesting that at this stage thyroxin was
the primary mediator of thyroid action. Changes in circulating levels of corticosterone have
also been associated with molting. However, the degree of the increase in this hormone
depends on the particular method that was used to induce a molt. Etches (1983) found that
the fasting molt method is associated with a larger increase in the level of corticosterone
while non-anorexic methods that take longer to induce molt result in a smaller increase in
corticosterone levels. Ovarian steroids also have significant concentration changes during
the molt. Loss of ovarian steroid support causes regression of the oviduct to occur (Himeno
and Tanabe, 1957). While hormonal regulation is important during the molt process, many
organs in the hen also change dramatically during this time.
The ovary and oviduct constitute a large amount of the weight loss (Brake and
ovary and oviduct by day 4 of the induction of the forced molt. This reduction in size causes
the reproductive tract to no longer be able to support egg production. The hen is now
undergoing a molt while her ovaries and oviduct are “resting.” This resting phase is also
known as reproductive quiescence (Brake and Thaxton, 1979b). Brake and Thaxton
determined important gross changes of specific organs during a forced molt. The liver,
ovary, oviduct, and right adrenal all significantly decrease in weight during a force fasted
molt. Furthermore, ovarian regression was determined to be in two main phases: first,
mature follicles underwent atresia and secondly smaller noncommitted follicles were
resorbed. Regression of the oviduct is a remodeling of the tissue rather than a decline in the
size of cells or shrinkage of the tissue and apoptosis removes cells of the glandular
epithelium during this regression (Heryanto et al., 1997b). Remodeling of shell gland tissue
may be responsible for removing substances that interfere with shell gland function. The
lipid content of the shell gland increases as hens age, and induced molting reduces shell
gland lipid and alters the balance of normal lipid types (Baker et al., 1980; Baker, 1981).
Further reports by Baker et al. (1981a) indicated that induced molting halts the incidence of
shell-less eggs and removes lipid accumulation in the uterus. Optimum postmolt
performance was achieved by fasted hens when body weight loss was greater than 25%
(Baker et al., 1980; Brake et al., 1981; Brake and McDaniel, 1981). They also reported that
uterine lipid was not lost until body weight loss exceeded 25%, which was at the same time
as maximal oviductal regression.
Intestinal changes also occur during the molt. Berry and Brake (1991) found that
They also found that following the molt, intestinal calcium binding protein concentration
increases compared to non-molted hens. Al-Batshan et al. (1994) found that intestinal uptake
of calcium improved following the molt. Following the molt, plumage renewal of both
primary and secondary feathers takes place. Different methods of molting can result in
various degrees of plumage renewal (Herremans, 1988).
Methods to Molt
Flock management during the molt will have a great effect on the success of post
molt production. Hens have been force molted since the early 1900s (Rice, 1905; King and
Trollope, 1934). It was found favorable to force hens into a molt during late summer or early
fall in order to increase the number of marketable winter eggs. This molt was achieved
through a combination of radical diet changes as well as a reduced lighting schedule. King
and Trollope (1934) determined that force molting increased second cycle egg production
and increased profitability compared to birds who were not force molted. In these
experiments, after two to four weeks twenty-four hours of light were used in the hen house to
induce the new laying cycle. Artificial lighting was only used for the introduction of the
molting phase through early spring. However, as poultry producers became more
accustomed to the artificial lighting and further research was achieved, artificial lighting
became more commonplace as a year round practice. In the late 1970s, a more specific
forced molt management practice became widely practiced in commercial flocks. Brake and
Thaxton (1979) determined that feed restriction and light manipulation for ten to twelve days
would force hens into a molt. In these trials, when hens were at 60% egg production, the
birds were left with ad libitum access to water. Feed was supplied to the birds on the tenth or
twelfth day of the molt. The birds lost an average of 25% body weight. It was found that
approximately one fourth of this weight loss was due to a decrease in weight of the ovary,
oviduct, and liver. The regression of the reproductive tract caused a cessation of egg laying,
thus giving the hens time to rejuvenate. The ovaries and oviducts of most hens returned to
pre-molt size by the forty second day of the molt, indicating hens were coming back into full
production. Another study done by Baker et al (1983) had body weight loss goals of 30%.
This target weight loss ensured that the birds would complete a full reproductive involution
and in turn cease egg production. The entire molt consisted of a four week process. Once
hens reached their target weight loss, usually by the tenth day, they were put back on a
“resting” diet. This diet consisted of enough energy, calcium, and protein to allow for
replenishment of body stores. At the end of the molt, on the twenty-eighth day, the flock was
put back onto a layer diet. This layer diet had enough nutrient supplementation to allow the
birds to enter into a second laying cycle.
Various studies have also been done evaluating dietary manipulations to induce birds
to molt. A study was done comparing the feed restriction method to low sodium
non-anorexic method on two commercial strains (Said, 1984). Feed and water were restricted for
the first 4 days and a step up program of incremental amounts of whole oats and then a layer
diet were fed for the next 21 days. Light was restricted to 8 hours of light and 16 hours of
dark. The non-anorexic birds received a diet containing .08% sodium ad libitum for the
entire 42 day molt. Body weight loss was significantly greater in the feed restricted group
recently Biggs et al. (2003) compared two feed restricted methods versus two non-anorexic
programs. This report suggests that feeding birds a wheat middlings diet will yield similar
results to the ten day feed restriction method. Post-molt production of hens that underwent a
molt induced by a dietary change to wheat middlings can be economically efficient and
comparable to that of the feed-restricted method of molting; and this alternative method
would be acceptable to various consumer groups concerned about bird welfare during the
molt. In 2006, the United Egg Producers (UEP) required all egg producer members to use
the non-anorexic method if they chose to induce a molt within their flock to gain a second
laying cycle.
Post molt Production
In order to achieve a successful second laying cycle, commercial laying hens must be
molted. The second laying cycle can be referred to as “post molt production.” Post molt
production is a direct result of the percent body weight loss during the molt. Hens that
endure optimum weight loss ensure a full reproductive regression which will allow for
complete rejuvenation and thus allow for optimum post molt performance. On a feed
restricted molt management system this target weight loss was optimal at 27 to 31% body
weight loss (Baker et al., 1983). Shell strength can be improved in second cycle production
after a forced molt induced by feed restriction (Lee, 1982). Post molt hen day egg production
LITERATURE CITED
Al-Batshan, H. A., S. E. Scheideler, B. L. Black, J. D. Garlich, and K. E. Anderson. 1994. Duodenal calcium uptake, femur ash, and eggshell quality decline with age and increase following molt. Poulty. Sci. 73:1590-1596.
Anderson, K. E., K. W. Koelkebeck. 2007. Molting layers-alternative methods and their effectiveness. Poult. Sci. 86:1260-1264.
Anderson, K. E. 2009. Final report of the thirty seventh North Carolina layer performance and management test. North Carolina State Univeristy Cooperative Extension Service 37(5).
Baker, M. 1981. The relationship between adipose accumulation and reproductive
dysfunction in Gallus domesticus. Ph.D. Dissertation. Auburn University, Auburn, AL.
Baker, M., J. Brake, and L. M. Krista. 1980. Histological study of uterine lipid distribution in the laying hen. Poult. Sci. 59:1557. (Abstr.)
Baker, M., J. Brake, and L. M. Krista. 1981a. Total body lipid and uterine lipid changes during a forced molt of caged layers. Poult. Sci. 60:1593. (Abstr.)
Baker, M., J. Brake, and G. R. McDaniel. 1983. The relationship between body weight loss during an induced molt and postmolt egg production, egg weight, and shell quality in caged layers. Poult Sci. 62:409-413.
Berry, W. D., and J. Brake. 1991. Modulation of calbindin-D28k in avian egg shell gland and duodenum. Poult. Sci. 70(Suppl.1):655-657. (Abstr.)
Berry, W. D. 2003. The physiology of induced molting. Poult. Sci. 82:971-980.
Biggs, P. E., M. W. Douglas, K. W. Koeklebeck, and C. M. Parsons. 2003. Evaluation of nonfeed removal methods for molting programs. Poult. Sci. 82:749-753.
Brake, J., P. Thaxton, and E. H. Benton. 1979a. Physiological changes in caged layers during a forced molt. 2. Gross changes in organs. Poult. Sci. 58:707-716.
Brake, J., P. Thaxton, and E. H. Benton. 1979b. Physiological changes in caged layers during a forced molt. 3. Plasma thyroxine, plasma triodothyrionine, adrenal cholesterol and total adrenal steroids. Poult. Sci. 58:1345-1350.
Brake, J., J. D. Garlich, C. R. Parkhurst, P. Thaxton, and G. W. Morgan. 1981. Physiological profile of caged layers during one production season, molt, and postmolt: organ weights and blood constituents. Poult. Sci. 60:2157-2160.
Brake, J., and G. R. McDaniel. 1981. Factors affecting broiler breeder performance. 3. Relationship of body weight during fasting to postmolt performance. Poult. Sci. 60:726-730.
Clark, J. B., 1940. The relationship of production and egg weight to age in white leghorn fowls. Poult. Sci. 19:61-66.
Cunningham, F. E., O. J. Cotterill, and E. M. Funk, 1960. The effect of season and age of birds. 1. On egg size, quality, and yield. Poult. Sci. 39:289-299.
Etches, R. J., J. B. Williams, and J. Rzasa. 1983. Corticosterone and nutritionally induced ovarian regression in the hen. Poult. Sci. 62:1417 (Abstr.)
Herremans, M., 1988. Age and strain differences in plumage renewal during natural and induced moulting in hybrid hens. Poult. Sci. 29:825-835.
Heryanto, B., Y. Yoshimura, T. Tamura, and T. Okamoto. 1997b. Involvement of apoptosis and lysosomal hydrolase activity in the oviducal regression during induced molting in chickens: A cytochemical study for end labeling of fragmented DNA and acid
phosphatase. Poult. Sci. 76:67-72.
Himeno, K., and Y. Tanabe. 1957. Mechanism of molting in the hen. Poult. Sci. 36:835-842.
King, D.F., and G. A. Trollope. 1934. Force-molting of hens and all-night lighting as factors in egg production. Circular 64:3-7.
Lee, K., 1982. Effects of force molt period on postmolt performance of leghorn hens. Poult. Sci. 61:1594-1598.
McCormick, C. C., D. L. Cunningham. 1984. Forced resting by high dietary zinc: tissue zing accumulation and reproductive organ weight changes. Poul. Sci. 63:1207-1212.
Mrosovsky, N., and D. Sherry. 1980. Animal anorexias. Science 207:837-842.
Petek, M., S. S. Gezen, F. Alpay, R. Cibik. 2008. Effects of non-feed removal molting methods on egg quality traits in commercial brown egg laying hens in turkey. Trop. Anim. Health Prod. 40:413-417.
Said, N. W., T. W. Sullivan, H. R. Bird, M. L Sunde. 1984. A comparison of the effect of two force molting methods on performance of two commercial strains of laying hens. Poult. Sci. 63:2399-2403.
Sturkie, Paul D., and Causey G. Whittow. Sturkie's avian physiology. 5th ed. Notre Dame, IN: 2000.
EFFECTS OF STRAIN ON PULLET BODY COMPOSITION, FIRST CYCLE HEN PRODUCTION AND EGG QUALITY AND EFFECTS OF MOLT METHOD ON
ABSTRACT
To determine the effects of strain differences on growth and first cycle production, a
study was conducted on two commercial white layer strains. A total of 984 birds were used
in this experiment; 492 Dekalb white layer hens and 492 Hy-line W98 white layer hens. The
birds were reared at Piedmont Research Station in Salisbury, NC. All birds were raised in
the same caging system and fed the same diets. At 17 weeks of age a necropsy was
performed for a body composition comparison. Only significant differences in gizzard
percent weight were found. The Hy-Line W98 birds had significantly (P<0.05) heavier
gizzards than the Dekalb White pullets. In the first production cycle, the Dekalb White birds
had significantly (P<0.0001) higher hen housed production, hen day production, LG eggs,
and A eggs, as well as higher (P<0.0001) egg income per hen. The Hy-Line W98 birds had
significantly (P<0.0001) higher egg weights, XL eggs, B eggs, and percent CX. There were
no significant differences in feed consumption, conversion, daily egg mass, mortality, PW
eggs, SM eggs, MD eggs, percent Loss, or feed cost. It can be inferred from these results
that the Hy-Line W98 utilizes the feed and nutrients consumed toward producing fewer but
larger eggs while the Dekalb White bird produces more but smaller eggs. In postmolt
production, the Dekalb White birds had significantly (P<0.05) better conversion, hen day
production, daily egg mass, LG, A eggs, and egg income. The Hy-Line W98 birds had
significantly (P<0.05) heavier egg weights and more XL eggs. There were no differences in
the parameters of feed consumption, hen housed eggs, mortality, SM, MD, B eggs, CX, Loss,
or feed cost. The molted treatment groups had greater (P<0.05) hen day production as well
birds had a significantly higher (P<0.05) feed cost than the molted treatment groups. There
was strain by treatment differences in the postmolt production.
INTRODUCTION
Molting layer hens can improve hen production and egg quality in second cycle
performance (Lee, 1982; Wilson, 1967; Koelkebeck et. al., 1992; King and Trollope, 1934;
Baker et al., 1983). Baker et al (1983) found that optimum post molt performance occurred
with 27 to 31% body weight loss during the molt. This would effectively improve hen daily
production and egg weight. Koelkebeck et al (1992) determined that feed efficiency
improved from 5 to 13 weeks post molt in hens that were feed restricted during the molt. Lee
(1982) also found feed efficiency improved as well as hen day production, egg weight,
albumen height, and shell thickness in post molt production. The following experiment was
conducted to determine the effect of strain on first cycle production and strain and molting
method on postmolt production.
MATERIALS AND METHODS Pullet Rearing
A total of 984 birds were used in this experiment. These birds were a part of the 38th
North Carolina Layer Performance and Management Test (Anderson, 2011a) located at
Peidmont Research Station in Salisbury, NC, Poultry Unit. 492 Dekalb white layer hens and
492 Hy-line W98 white layers were raised as a part of the 38th flock. The hatch took place at
the research station on January 6th, 2010. The pullets were reared in a windowless enclosed
force ventilated house with quad deck cages. There were three banks of quad-deck cages in
level/row was assigned a unique replicate number. For statistical analysis the pairs of rows
were designated as blocks. Thus, each block consisted of two rows containing 24 replicates
on each level. The pullets used for this experiment were a part of the 38th flock, which
totaled 11,232 birds. Chicks were brooded in the same cage for the entire 17 wk period.
Paper was placed on the cage floor for the first 7 days within each of the replicate series
within a row. Each cage within the replicate was filled with 13 pullets on the day of hatch
for a rearing allowance of 310 cm2 (48 in2), 4.7 cm (1.8 in) of feeder space/bird and 1:6.5
nipple drinkers to bird ratio.
Pullets were fed by hand ad libitum daily. Rearing dietary program was a
conventional rearing program with a Starter (20 % CP; 2850 Kcal/kg ME) fed from 0 to 6
wks; Grower (18% CP; 2850 Kcal/kg ME) fed from 6 to 12 wks; Finisher (16% CP; 2850
Kcal/kg ME) 12 to15, then a Prelay diet which was fed prior to housing. All diets and
ingredients fed shown in Table 1. All pullets were provided with Starter feed containing
Amprol during the initial brooding period, followed by Grower and Developer diets which
are shown in the diet formulation section Table 1.1. Pullets were moved independently on to
the next tier rearing diet at the point of achieving target body weight goals or after a
prescribed time interval. Beginning at 2 weeks of age, body weights were monitored and
Table 1. 1. Diet Formulations for the Brood-Grow Periods
Ingredient Diet1 Identification
Starter Grower Developer Pre-Lay2
Corn 1139.8 1159.9 1215.0 1136.7
Fat (Tallow) --- 10.0 10.0 50.4
Soybean meal 532.2 321.8 252.1 633.2
Soybean Hulls --- --- 15.0 ---
Wheat Midds 165.8 269.9 300.0 ---
Gluten Meal 60% 75.1 150.0 100.0 ---
D.L. Methionine 1.3 1.9 3.1 2.7
Lysine 78.8% 4.8 5.0 2.4 ---
Oyster Shell --- --- 70.0
Limestone 30.9 32.7 53.2 70.8
Bi-Carbonate 2.5 2.5 2.5 2.5
Phosphate Mono/D 33.5 32.5 33.4 19.4
Salt 6.7 6.3 6.3 6.3
Vit. Premix 1.0 1.0 1.0 1.0
Min. premix 1.0 1.0 1.0 1.0
Mold Inhibitor 2.0 2.0 2.0 1.0
T-Premix 1.0 1.0 1.0 1.0
.06% Sel. Premix 1.0 1.0 1.0 1.0
Choline Cl 60% 1.5 1.5 1.0 2.6
Ronozyme P-CT 540% --- --- --- 0.4
Total (lbs) 2000 2000 2000 2000
Protein % 20.0 16.8 15.0 20.0
ME kcal/kg 2816 2800 2800 2926
Calcium % 1.00 1.00 1.40 3.01
T. Phos. % 0.76 0.78 0.76 0.53
Lysine % 1.2 0.95 0.75 1.10
TSAA % 0.70 0.73 0.66 0.77
1Diets were acquired from Southern States Cooperative in mash form and Lance Minear, Nutritionist for Southern States, provided assistance in formulation.
2This Prelay diet was fed through 23 weeks.
Pullet vaccination and beak trimming schedules are outlined in Table 1.2. Pullets were not
Table 1. 2. Pullet Vaccination and Beak Trimming Schedule
Age Date Event
Hatch January 6, 2010 MVT Marek’s vaccination by injection in neck Day 6-8 January 12-14, 2010 Precision Beak Trim1 all replicates throughout Day 10 January16, 2010 1st Newcastle (B1) and Bronchitis (Mass.)
vaccination Via aerosol spray (Combo Vac) Day 35 February 24, 2010 2nd Newcastle and Bronchitis B1 Type LaSota
Strain Mass. Type Live Virus, vaccination via aerosol spray (TripleVac)
Day 63 March 10, 2010 3rd Newcastle and Bronchitis B1 Type LaSota Strain Mass. Type Live Virus, vaccination via aerosol spray (TripleVac)
Day 70 March 17, 2010 Fowl Pox and Avian Encephalomyelitis Live Virus PT Blen vaccination via the wig web Day 105 April 21, 2010 4th Newcastle and Bronchitis B1 Type LaSota
Strain Mass. Type Live Virus, vaccination via aerosol spray (Triple Vac)
Week 74 June 10, 2011 5th Newcastle (LaSota) and Bronchitis (Mass.) vaccination via aerosol spray (ComboVac)
Beak trimming began at 6 days of age using a Lyons Precision beak trimmer, with a 7/64"
guide hole. The trim was a block cut with an approximate blade temp of 1100o F (dull red).
Beak trimming was completed in less than 3 days.
Body Composition
At 17 weeks of age a sample of pullets from each strain were selected and used in a
body composition comparison. A total of 36 birds (18 pullets/strian) were randomly selected
and transported to the laboratory for necropsy. Pullets were euthanized by cervical
dislocation. Total body weight was taken. Each necropsy was performed as follows. The
bird was placed on its back with the lateral side facing up and feet at the base of the table.
approximately halfway past the abdominal fat pad. Scissors were then used to cut alongside
the ribs on both the left and right side of the bird. The skin and feathers of the bird were
separated from the lateral side of the bird. The tip of the keel was then carefully pulled up
and backward to separate it from the body cavity. The keel bone along with the pectoralis
major and minor muscles were removed together by using bone shears to cut it away from
the body cavity. This was then weighed and recorded. Next, the small intestine was pulled
out of the inner cavity. A cut was made at the anterior side of the duodenal loop and at the
illeo-cecal junction. Contents of the small intestine were removed before the weight was
recorded. Cuts were made at both the posterior and anterior end of the gizzard. All excess
fat on the outer membrane of the gizzard was removed. After excising the gizzard, a cut was
made laterally though the organ and all contents were rinsed out with water before the weight
was recorded. The liver was carefully excised by making a cut at the hepatic portal vein and
artery. The weight was then taken and recorded. The oviduct was then removed by cuts
made at the posterior end of the oviduct and at the vaginal cloacal junction. If an egg was in
the tract it was removed prior to recording the weight of the organ. The entire ovary was
excised, including all follicles. It was then weighed and recorded. All weights of organs
were divided by total body weight to determine organ percentages.
Hen Production
During their 17th wks the pullets were moved into the layer houses, where they were
maintained throughout the duration of the trial. They remained a part of the 38th North
Carolina Layer Performance and Management Test (Anderson, 2011b). Two layer houses
environmentally controlled layer house with a manure pit, while House 5 was a standard
height totally enclosed force ventilated laying house with a scraper pit manure handling
system high rise layer house. In both houses, each side of a bank was designated as a row
and each row was divided into nine 8-foot replicates/level. The replicates were all equipped
with feed hoppers to supply and monitor feed consumption for each individual replicate. All
feed was distributed by an automatic feeding system.
At 17 weeks the lighting schedule consisted of 10 hours of light to 14 hours of dark
(10L:14D). The hours of light were increased incrementally over the next 14 weeks. Refer
to Table 1.3 for step up lighting program. At 32 weeks of age the birds were receiving 16
hours of light to 8 hours of darkness. This was continued through the first cycle until the
molt started at 69 weeks of age. Two densities were used. Cage size was either 61 or 81cm
wide and 41 cm deep. This allowed for a density of 471 cm² (73 in²) at 7 hens/cage (81 x 41
cm) and 497 cm² (77 in²) at 5 hens/cage (61 x 41cm). In each of the layer houses, one
replicate consisted of either 7 birds per cage for a total of 3 cages and 21 birds in the replicate
or 5 birds per cage for a total of 4 cages and 20 birds in the replicate. Though the densities
were different, equal samples were selected from across the houses and therefore density was
Table 1. 3. Lighting for First Layer Cycle Hours of Light
Age Date House 4 House 5
Housing Pullets 28-Apr-10
5-May-10 10.00 10.00
17 Weeks 5-May-10 11.00 11.00
18 Weeks 12-May-10 11.50 11.50
19 Weeks 19-May-10 12.00 12.00
20 Weeks 26-May 10 12.50 12.50
21 Weeks 2-Jun-10 13.00 13.00
22 Weeks 9-Jun-10 13.50 13.50
23 Weeks 16-Jun-10 14.00 14.00
24 Weeks 23-Jun-10 14.25 14.25
25 Weeks 30-Jun-10 14.50 14.50
26 Weeks 7-Jul-10 14.75 14.75
27 Weeks 14-Jul-10 15.00 15.00
28 Weeks 21-Jul-10 15.25 15.25
29 Weeks 28-Jul-10 15.50 15.50
30 Weeks 4-Aug-10 15.75 15.75
31 Weeks 11-Aug 10 16.00 16.00
31-69 Weeks 4-May-11 16.00 16.00 69-85 Weeks See Molt Lighting Program
During the first cycle all birds were fed the same layer diets. These diets were
adjusted as the birds came into full egg production. Refer to Table 1.4 for the feed schedule.
Tables 1.5 and 1.6 show the diet formulations.
Postmolt hen production was similar to the first cycle. Birds were fed layer diets
according to egg production and feed consumption. Postmolt production commenced on
Table 1. 4. 1st Cycle Layer Feeding Program Rate of Egg
Production
Consumption Per100
Birds/Day (kg) Diet Fed
Weeks 17-26 < 9.52 D
Pre-Peak and > 87% < 9.52 D
9.57-10.39 F
10.43-11.29 H
11.34-12.20 I
12.25-13.11 M
>13.15 N
80-87% < 9.52 F
9.57-10.39 G
10.43-11.29 I
11.34-12.20 M
12.25-13.11 N
>13.15 O
70-80% < 9.52 H
9.57-10.39 I
10.43-11.29 M
11.34-12.20 N
12.25-13.11 O
>13.15 O
< 70% < 9.52 H
9.57-10.39 I
10.43-11.29 N
11.34-12.20 O
12.25-13.11 O
Table 1. 5. Layer Diet D-H Ingredients
Ingredients D E F G H
Corn 866.71 925.46 997.91 1068.19 1131.97
Soybean meal 663.18 621.1 552.33 499.8 457.65
Wheat Midds - - - - -
Fat (Tallow) 110.88 102.43 87.73 74.61 64.32 Gluten Meal 60% 95.83 88.37 100 99.23 90.8
D.L. Methionine 3.08 2.89 2.52 2.26 2.48
Lysine 78.8% - - - - -
Soybean Hulls - - - - -
Ground Limestone 132.42 133.7 135.07 134.02 132.5
Coarse Limestone 75 75 75 75 75
Bi-Carbonate 3 3 3 3 3
Phosphate Mono/D 36.77 34.73 32.84 30.36 28.79
Salt 6 5.99 5.95 5.93 5.92
Vit. premix 1 1 1 1 1
Min. premix 1 1 1 1 1
Mold Inhibitor 1 1 1 1 1
T-Premix 1 1 1 1 1
.06% Selenium
Premix 1 1 1 1 1
Choline Cl 60% 2.14 2.33 2.65 2.59 2.57
Calculated Analysis
Protein % 22.00 21.00 20.00 19.00 18.00
ME kcal/kg 2926.00 2926.00 2926.00 2926.00 2926.00
Calcium % 4.45 4.45 4.45 4.40 4.35
T. Phos. % 0.71 0.68 0.65 0.61 0.59
Lysine % 1.15 1.09 1.00 0.93 0.87
Table 1. 6. Layer Diet I-O Formulations
Ingredients I M N O
Corn 1199.47 1258.28 1309.81 1371.93
Soybean meal 406.08 363.91 340.24 333.87
Wheat Midds - - - -
Fat (Tallow) 52.26 43.8 38.85 14.71
Gluten Meal 60% 89.84 82.64 61.54 25.79
D.L. Methionine 2.02 1.62 1.75 1.8
Lysine 78.8% - - - -
Soybean Hulls - - - -
Ground Limestone 158.82 160.1 161.33 167.71
Coarse Limestone 50 50 50 50
Bi-Carbonate 3 3 3 3
Phosphate Mono/D 26.79 24.75 22.6 20.3
Salt 5.9 5.89 5.89 5.89
Vit. premix 1 1 1 1
Min. premix 1 1 1 1
Mold Inhibitor 1 1 1 1
T-Premix 1 1 1 1
.06% Selenium Premix 1 1 1 1
Choline Cl 60% 0.83 1.02 - -
Calculated Analysis
Protein % 17.00 16.00 15.00 14.00
ME kcal/kg 2926.00 2926.00 2926.00 2860.00
Calcium % 4.35 4.35 4.35 4.45
T. Phos. % 0.56 0.52 0.49 0.47
Lysine % 0.80 0.74 0.70 0.68
TSAA % 0.70 0.65 0.62 0.58
Molt Treatments
Birds were randomly divided into three treatment groups: molted (NM),
non-anorexic (NA), and feed-restricted (FR). The NM birds were not molted and subjected to
bulky layer diet that had only enough nutrients and energy for body maintenance within the
birds; this feed was provided ad libitum. The feed-restricted birds were deprived of all feed
until the target weight loss was reached. The target weight loss was 25%. Once the NA and
FR birds reached this goal, they were transitioned to a resting layer diet until the last day of
the molt. The molt lasted a continuous twenty eight days. For a detailed list of the molt
method lighting schedule and diets, refer to Chapter 2.
Production Measurements
Feed consumption was monitored every twenty-eight days and recorded as the
number of kilograms of feed consumed daily per 100 hens. Feed conversion was calculated
every twenty-eight days and recorded as the grams of egg produced per gram of feed
consumed. Mortality was monitored daily and recorded as a percentage of the total hens
housed in the laying facility of each strain.
Eggs were collected daily and hen-day egg production was calculated every
twenty-eight days. The average number of eggs produced per 100 hens per day was recorded as hen
day production. Total eggs produced divided by the number of hens housed at the beginning
of the cycle was calculated and recorded as hen housed production. Daily egg mass was
reported as the average egg mass produced in grams per hen per day. The egg size
distribution was determined by using the United States Department of Agriculture (USDA)
size classifications and specified weights for market eggs. Egg size distributions were as
follows: pee wee, small, medium, large, and extra large. The eggs were sorted for size once
every twenty-eight days utilizing all eggs produced during the previous twenty-four hour
chex, and loss. All egg size and quality grading were done together to ensure consistency of
data collected. Egg income was calculated using current year regional average prices for
farm value of eggs based on egg production and quality evaluation.
STATISTICAL ANALYSIS
Data collected during this experiment were subjected to ANOVA utilizing the
General Linear Model (GLM) procedure of SAS (SAS Institute) with the main effect of
strain for pullet body composition and first cycle. Strain and density were used as blocks.
Main effects for postmolt production were strain and molt treatment. Percent organ weights
were used in data analysis of body composition. Means were separated by the Least Squares
Means (LS Means) according to SAS. Significant differences are denoted by the differing
letters in the columns of values.
RESULTS AND DISCUSSION Pullet Body Composition
The strain comparison of body composition is shown in Table 1.7. Organs were
measured as a percent weight of the whole bird. No significant differences were observed
between the two strains in the comparisons of body weight, whole keel, liver, small intestine,
oviduct, and ovary. This is important to note because although the birds are different strains,
their physiological organ weight in percent was similar. Therefore during the molt when
different treatment methods are utilized, it would be fair to hypothesize that the two strains
will react similarly when weight loss occurs. The only difference between the two strains
was that the Hy-Line W98 had a significantly higher (P<0.01) gizzard percent weight than
pullets were consuming more feed their gizzards could have an increased muscle mass to
help with the digestion process.
Table 1. 7. Strain Comparison of Body Composition at 17 Weeks of Age BW
(kg) Whole Keel (%) Liver (%) Gizzard (%) Sm Int (%) Oviduct (%) Ovary (%)
Hy-Line W98 1.30 17.95 1.92 1.93a 1.29 0.23 0.14
Dekalb White 1.26 15.99 1.89 1.71b 1.38 0.04 0.05
p-value NS NS NS <0.01 NS NS NS
Pooled SEM 0.02 0.72 0.05 0.05 0.04 0.10 0.04
First Cycle Production
The first cycle of hen production commenced at 17 weeks of age and concluded at 69
weeks of age. The strains were compared in all variables of production. No significant
differences were found in feed consumption per 100 birds, feed conversion, daily egg mass,
or mortality. Although the strains consumed similar amounts of feed and had similar daily
egg masses, the number of hen housed eggs as well as hen day eggs were significantly
different from each other. The Dekalb White birds had more (P<0.0001) hen housed eggs
than the Hy-Line W98 birds at 310.15 and 292.73 eggs, respectively. The Dekalb White
birds also had more (P<0.0001) hen day eggs than the Hy-Line W98 birds at 86.68% and
83.24%, respectively. Although the Dekalb White birds had more eggs in the first cycle
production, the Hy-Line W98 birds had heavier (P<0.0001) eggs than the Dekalb White birds
They also had more (P<0.0001) XL eggs at 71.33 compared to 63.13 %. The Dekalb White
birds had a higher (P<0.0001) percent of LG eggs compared to the Hy-Line W98 birds at
21.88 and 14.87 %, respectively. No significant differences were observed between strains
in PW, SM, and MD egg sizes. This data suggests that the Hy-Line W98 birds utilized the
feed and nutrients consumed toward producing fewer but larger eggs than the Dekalb White
birds.
Table 1. 8. First Layer Cycle Hen Production
Strain FC100 (kg/100 birds) Conv (g egg/g feed) HH Eggs (# eggs/total hens) HD Prod (# eggs/hen/day) Daily EggMass (g) Mort (%)
Hy-Line W98 10.83 0.48 292.73b 83.24b 52.89 5.48
Dekalb White 10.94 0.48 310.15a 86.68a 53.56 4.33
p-value NS NS <0.0001 <0.0001 NS NS
Pooled SEM 0.10 0.01 2.00 0.42 0.33 0.93
Table 1. 9. First Layer Cycle Egg Sizing
Strain Egg Wt (g) PW (%) SM (%) MD (%) LG (%) XL (%)
W98 62.81a 0.17 3.93 9.43 14.87b 71.33a
Dekalb 60.67b 0.22 6.10 8.52 21.88a 63.13b
p-value <0.0001 NS NS NS <0.0001 <0.0001
Pooled SEM 0.22 0.11 0.37 0.49 0.88 1.06
Table 1.10 shows the egg grading distribution of the first cycle production. The
to the Hy-Line W98 birds at 94.60 %. The Hy-Line W98 birds had a higher (P<0.01)
percentage of B grade eggs than the Dekalb White birds at 3.31 and 1.96 %, respectively.
The Hy-Line W98 birds also had a higher (P<0.01) percentage of CX than the Dekalb White
birds at 1.30 and 2.01 %, respectively. The difference in egg weight may have contributed to
the lower Grade A and increased checked eggs in the W98 strain. The Dekalb White birds
had higher (<0.0001) egg income than the Hy-Line W98 birds at 28.82 versus 27.06 $/hen,
respectively.
Table 1. 10. First Layer Cycle Egg Grading
Strain Aeggs (%)
Beggs (%)
CX (%)
Loss (%)
EggInc ($/hen)
FeedCost ($/hen) Hy-Line
W98 94.41b 3.31a 2.01a 0.27 27.06b 13.72
Dekalb
White 96.60a 1.96b 1.30b 0.15 28.81a 14.16
p-value <0.001 <0.01 <0.01 NS <0.0001 NS
Pooled SEM 0.39 0.32 0.19 0.06 0.20 0.24
Postmolt Production
Postmolt production commenced at 73 wks of age and concluded 93 wks of age for
this study. An analysis was run to determine the strain differences as well as the molt
treatment effects on hen production and egg quality. Table 1.11 shows the effects of strain
and molt treatment on postmolt hen production. The Dekalb White hens produced
significantly (P<0.05) more grams egg per gram of feed consumed than the Hy-Line W98
eggs per one hundred hens per day at 84.79 than the Hy-Line W98 strain at 78.16, and
significantly (P<0.05) daily egg mass than the Hy-Line W98 birds at 57.40 and 55.10,
respectively. No significant differences were observed between strains in the parameters of
feed consumption, hen housed eggs, and mortality.
In postmolt hen production, significant differences were found in hen day production
as well as daily egg mass within the different molt treatments. Both molt treatments had
significantly more (P<0.05) eggs produced per day per 100 hens than the NM birds. The
molted treatment groups also had a higher (P<0.05) daily egg mass than the NM control
birds. Both increased hen day egg production and increased egg mass were found past
research done by Lee (1982) and Baker (1983). No significant differences were observed
between the treatment groups in the parameters of consumption, conversion, hen housed
eggs, and mortality. This observation can be important to welfare groups in helping to show
that whether the birds are fasted, molted by fasting, or molted by a non-anorexic diet, the
mortality is not significantly different between any of the groups. Furthermore, no
significant differences were found in the interaction of strain by treatment in any of the
production parameters measured. This is important to note that the two strains responded
similarly to the molt treatments, indicating that a wider variety of white commercial strains
Table 1. 11. Effects of Strain and Molt Treatment on Postmolt Hen Production
Strain Consumption (kg/100 birds)
Conversion (g egg/g feed) HH Eggs (# eggs/total hens) HD Eggs (# eggs/100 hens/day) Daily Egg Mass (g) Mortality (%) Hy-Line
W98 12.87 0.43b 98.55 78.16b 55.10b 1.50
Dekalb
White 12.59 0.46a 104.83 84.79a 57.40a 3.40
Pooled SEM 0.24 0.01 1.72 0.93 0.67 0.73
p-value NS <0.05 NS <0.0001 <0.05 NS
Treatment
FR 12.39 0.46 103.61 82.63a 57.25a 2.43
NA 13.15 0.44 101.23 82.86a 57.24a 2.39
NM 12.66 0.43 100.24 78.93b 54.26b 2.53
Pooled SEM 0.29 0.01 2.10 1.13 0.82 0.90
p-value NS NS NS <0.05 <0.05 NS
Treatment x Strain
Pooled SEM 0.41 0.01 2.98 1.60 1.15 1.26
p-value 0.34 0.69 0.71 0.90 0.58 0.57
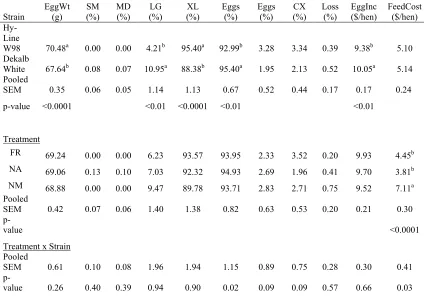
Several differences were found in egg sizes and grades between the two strains
utilized in this experiment. The Hy-Line W98 birds had a significantly heavier (P<0.0001)
egg weights compared to the Dekalb White birds at 70.48 and 67.64 grams, respectively.
They also had more (P<0.0001) XL eggs than the Dekalb White birds at 95.40 and 88.38 %,
respectively. The Dekalb White birds had significantly (p<0.01) more LG and A eggs at
10.95 and 95.40 %, respectively, compared to the Hy-Line W98 birds. The Dekalb White
birds also had a higher (P<0.01) egg income in dollars per hen than the Hy-Line W98 birds.
Significant differences by strain were observed in the parameters of SM, MD, B eggs, CX,
the strains in the first cycle production. These included the parameters of egg weight, LG,
XL, A eggs, and egg income.
No significant differences were found between molt treatments in the parameters of
egg weight, SM, MD, LG, XL, A eggs, B eggs, CX, Loss, or egg income. However, the NM
group had a significantly (P<0.0001) higher feed cost at 7.11 $/hen compared to the molt
treatment groups. No significant differences were found for treatment by strain in any of the
Table 1. 12. Effects of Strain and Molt Treatment on Postmolt Egg Sizing and Grading Strain EggWt (g) SM (%) MD (%) LG (%) XL (%) A Eggs (%) B Eggs (%) CX (%) Loss (%) EggInc ($/hen) FeedCost ($/hen) Hy-Line
W98 70.48a 0.00 0.00 4.21b 95.40a 92.99b 3.28 3.34 0.39 9.38b 5.10
Dekalb
White 67.64b 0.08 0.07 10.95a 88.38b 95.40a 1.95 2.13 0.52 10.05a 5.14
Pooled
SEM 0.35 0.06 0.05 1.14 1.13 0.67 0.52 0.44 0.17 0.17 0.24
p-value <0.0001 <0.01 <0.0001 <0.01 <0.01
Treatment
FR 69.24 0.00 0.00 6.23 93.57 93.95 2.33 3.52 0.20 9.93 4.45b
NA 69.06 0.13 0.10 7.03 92.32 94.93 2.69 1.96 0.41 9.70 3.81b
NM 68.88 0.00 0.00 9.47 89.78 93.71 2.83 2.71 0.75 9.52 7.11a
Pooled
SEM 0.42 0.07 0.06 1.40 1.38 0.82 0.63 0.53 0.20 0.21 0.30
p-value <0.0001
Treatment x Strain
Pooled
SEM 0.61 0.10 0.08 1.96 1.94 1.15 0.89 0.75 0.28 0.30 0.41
CONCLUSION
Molting layer hens can have a variety of positive effects on second cycle production
and has been well documented in the past. In this research, a significant difference between
the molt treatment groups in postmolt production was only found in feed cost. While this
may appear minor in comparison to the variety of other variables studied, it is a very
important factor to consider in today’s industry. With feed costs up to 70% for many egg
producers, cutting this cost by molting a flock can drastically increase profitability. Not only
does this research benefit producers through showing the feed cost change, it also is
important to note that no significant differences were found between the molt treatment
groups. Therefore, as long as the hen is induced to a full molt, she will have similar
production whether induced through a feed restricted method or the more popular
LITERATURE CITED
Anderson, K. E. 2011a. First cycle report of the thirty eighth layer performance and management test. 38.
Anderson, K. E. 2011b. Second cycle report of the thirty eighth layer performance and management test. 38.
Baker, M., J. Brake, G. R. McDaniel. 1983. The relationship between body weight loss during an induced molt and postmolt egg production, egg weight, and shell quality in caged layers. Poult. Sci. 62:409-413.
King, D. F., G. A. Trollope. 1934. Force-molting of hens and all-night lighting as factors in egg production. Circular 64:3-7.
Koelkebeck, K. W., C. M. Parsons, R. W. Leeper, and J. Moshtaghian. 1992. Effect of duration of fasting on postmolt laying hen performance. Poul. Sci. 71:434-439.
Lee, K. 1982. Effects of forced molt period on postmolt performance of leghorn hens. Poult. Sci. 61:1594-1598.
Wilson, H. R., J. L. Fry, R. H. Harms and L. R. Arrington. 1967. Performance of Hens Molted by Various Methods. Poult. Sci. 46:1406-1412.
THE EFFECTS OF MOLTING METHOD ON HY-LINE W98 AND DEKALB WHITE COMMERCIAL LAYER HENS ON BODY WEIGHT AND ORGAN WEIGHT
ABSTRACT
Two strains of white commercial layer hens were utilized in this experiment; Hy-Line
W98 and Dekalb White. 492 hens of each strain were randomly distributed into three
treatment groups: non-molted (NM), non-anorexic (NA), and feed-restricted (FR). The NM
group was not molted and subjected to continuous layer diet and lighting conducive to
maintain production. The NA birds received a diet with only enough nutrients and energy for
body maintenance, while feed was completely withdrawn from the FR group. Organ weights
were measured: whole keel, gizzard, liver, small intestine, ovary, and oviduct and were
recorded on a percent body weight basis. Once the FR and NA birds reached the target of
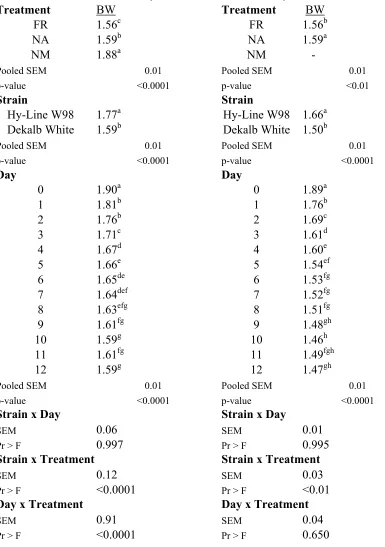
25% body weight loss, they were transitioned into a resting layer diet. Significant
differences (P<0.05) were found between the three treatment groups. NM were heaviest at
1.88 kg while the FR group had an average weight of 1.56 kg. The Hy-Line W98 birds were
significantly (P<0.0001) heavier than the Dekalb White birds. There was also a continuous
weight loss from days 0 through 12 of the molt. A significant difference (P<0.0001) was
found in strain by day as well as in treatment by day. Significant differences (P<0.01) were
found in the gizzard, liver, ovary, oviduct, and whole keel. The NM group had significantly
larger liver, ovary, and oviductal weights in comparison to the molt groups. This is an
indicator that of the organs weighed, these are the most affected by the molt. The main effect
of day shows a significant (P<0.01) decrease in percent weight of the abdominal fat pad and
liver, and a significant (P<0.05) increase in percent weight of the whole keel; which all
change from day 0 to day 12. In the interaction of treatment by strain, a significant
indicating a change in tissue re-structuring of these organs. From these results, it can be
inferred that during a molt, the ovary and oviduct are regressing in size due to lack of
nutrients and energy to sustain egg production. Also, the decrease in abdominal fat pad and
liver weight may be attributed to the fat and glycogen stores being catabolized as an energy
source for the hen. The appearance of an increase in gizzard and whole keel weight may
actually be an indicator that these organs are not changing in size; but that they are the same
size throughout the duration of the molt. Therefore the bird is not catabolizing muscle tissues
for energy.
INTRODUCTION
The shell egg industry utilizes an induced molt as a management tool in commercial
laying hens in order to procure a simultaneous second cycle within a single flock of birds
housed in the same facility. The molt allows the hens a period of reproductive quiescence
(Mrosovsky and Sherry, 1980) which then allows for a full second cycle. The molt period
can be condensed to a twenty-eight period and can be economically advantageous to
producers because it can enhance egg production and quality as well as reduce feed cost.
Maintaining the flock for twenty-eight days with little to no production can cost less
compared to raising new pullets which would not come into laying production for 17 weeks.
Several methods to induce a molt have been researched in the past (King and Trollope, 1934;
Brake and Thaxton, 1979a; Brake and McDaniel, 1981; Baker et al., 1983; Said, 1984; Biggs
et al 2003; Anderson and Koelkebeck, 2007). These methods include an induced molt
through feed restricted methods as well as non feed withdrawal methods. While body weight
available concerning the physiological changes in organ weight and tissue restructuring
which occur during the molt. The present study was done to determine body weight
partitioning during weight loss in a non-anorexic molt program.
MATERIALS AND METHODS Hen Production
Two commercial white egg laying strains, the Hy-Line W98 and Dekalb White were
utilized in this experiment. All hens were a part of the 38th North Carolina Layer and
Management Test (Anderson, 2011). There were three treatment groups; the first, a positive
control and was not molted (NM); Second, a feed restricted molt (FR) group and third, a
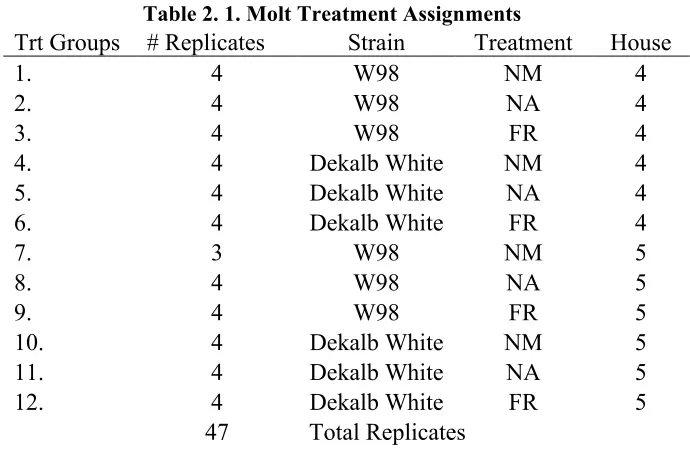
Table 2. 1. Molt Treatment Assignments
Trt Groups # Replicates Strain Treatment House
1. 4 W98 NM 4
2. 4 W98 NA 4
3. 4 W98 FR 4
4. 4 Dekalb White NM 4
5. 4 Dekalb White NA 4
6. 4 Dekalb White FR 4
7. 3 W98 NM 5
8. 4 W98 NA 5
9. 4 W98 FR 5
10. 4 Dekalb White NM 5
11. 4 Dekalb White NA 5
12. 4 Dekalb White FR 5
47 Total Replicates
A total of 984 birds were used in this experiment. These birds were a part of the 38th
North Carolina Layer Performance and Management Test located at Peidmont Research
Station in Salisbury, NC, Poultry Unit. 492 Dekalb white layer hens and 492 Hy-line W98
white layers were raised as a part of the 38th flock.
Two layer houses were used, both with equal cage sizes and densities. Two densities
were used. Cage size was either 61 or 81cm wide and 41 cm deep. This allowed for a
density of 471 cm² (73 in²) at 7 hens/cage (81 x 41 cm) and 497 cm² (77 in²) at 5 hens/cage
(61 x 41cm). Though the densities were slightly different, equal samples were pulled from
across the houses and therefore density was not used as a variable in the statistical analysis of
House 4 is a high rise environmentally controlled layer house with a manure pit,
while House 5 is a standard height totally enclosed force ventilated laying house with a
scraper pit manure handling system high rise layer house. In both houses, each side of a
bank was designated as a row and each row was divided into nine 8-foot replicates/level. The
replicates were all equipped with feed hoppers to supply and monitor feed consumption for
each individual replicate. All feed was distributed by an automatic feeding system. A black
curtain wall was run through each house to separate the molted birds from the non-molted.
This allowed the implementation of the molt lighting program without interfering with the
lighting of the non-molted hens. The house temperatures were monitored to maintain 80+ 5°
F. House temperature management reacted to ambient environmental temperatures and
weight loss rates.
The pullets were moved into the layer houses during their 16th wk and the study
began at 17 weeks of age. At 17 weeks of age pullets were moved into these layer houses.
The lighting schedule consisted of 10 hours of light to 14 hours of dark (10L:14D). The
hours of light were increased incrementally over the next 14 weeks. At 32 weeks of age the
birds were receiving 16 hours of light to 8 hours of darkness that was maintained through the
first cycle until the molt started at 69 weeks of age. Refer to Table 2.2 for the lighting
Table 2. 2. Molt Lighting Program
Hours of Light
Age Date
House 4
House 5 32 through 69
Weeks 4-May-11 16 16
69 Weeks 4-May-11 9 9
73 Weeks 1-Jun-11 15.5 15.5
74 Weeks 8-Jun-11 16 16
75 Weeks-110
Weeks June 15, 2011 to 16 16
18-Feb-12
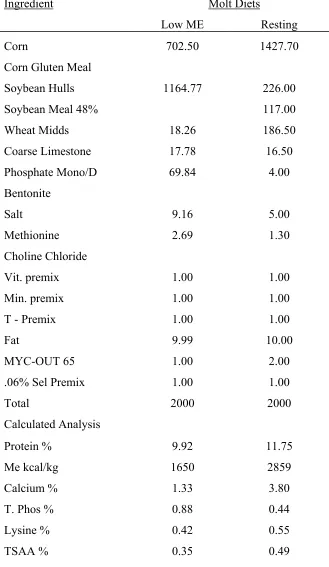
The NM birds were fed the same laying diet they were on for the first cycle while the
FR birds were taken completely off feed at the initiation of the molt. The NA group was fed
a low-nutrient diet consisting of low energy, and low protein supplemented with calcium for
body maintenance; see Table 2.3 for the NA molt diet used. This diet was bulky, such that a
full trailer load weighed 2/3 of a normal full load. On Day 0 of the molt the layer feed was
removed from feed hoppers and replaced with the NA feed. The NA molting ration was
designed to provide for skeletal and muscle maintenance but not support production, and
improve livability with the program. The FR birds feed hoppers were emptied out on day 0
and covered with plastic trash bags to clearly mark these replicates. Both the NA and FR
treatment birds were fed the resting diet after they achieved the target 25% loss in body
Table 2. 3. Non-Anorexic Molt Diet and Resting Diet
Ingredient Molt Diets
Low ME Resting
Corn 702.50 1427.70
Corn Gluten Meal
Soybean Hulls 1164.77 226.00
Soybean Meal 48% 117.00
Wheat Midds 18.26 186.50
Coarse Limestone 17.78 16.50
Phosphate Mono/D 69.84 4.00
Bentonite
Salt 9.16 5.00
Methionine 2.69 1.30
Choline Chloride
Vit. premix 1.00 1.00
Min. premix 1.00 1.00
T - Premix 1.00 1.00
Fat 9.99 10.00
MYC-OUT 65 1.00 2.00
.06% Sel Premix 1.00 1.00
Total 2000 2000
Calculated Analysis
Protein % 9.92 11.75
Me kcal/kg 1650 2859
Calcium % 1.33 3.80
T. Phos % 0.88 0.44
Lysine % 0.42 0.55
Body Weights
Two days prior to onset of the molt all replicates were weighed and re-counted to
account for mortality. All morbid hens were removed from cages prior to inducing the molt.
The birds in the NA and FR treatment groups were weighed everyday until the target weight
loss of 25% percent was reached. If the replicate came within .5% of the target weight loss it
was transitioned to the resting diet. The first cage with a full set of birds, either 5 or 7
depending on the density, was weighed and used to represent the entire replicate. The same
cage in each replicate was weighed for the duration of the molt. All body weights were
recorded daily and daily weight loss percentages were calculated.
Organ Collection
To maintain the integrity of the NCLP&MT 2 birds from 2 replicates within
each of these treatment combinations were used for organ weights. On Day 0, May 3rd, 2011,
of the molt initial body weights and organ weights were taken. Hens were weighed to obtain
a live body weight prior to cervical dislocation. Hens were killed in the layer house and then
transferred as a group to the necropsy lab on-site at the Peidmont Research Station in
Salisbury, NC. Organs excised and weighed were as follows: abdominal fat pad, whole keel
bone with breast, gizzard, small intestine, liver, ovary, and oviduct.
Each necropsy was performed as follows. The bird was euthanized then placed on its
back with the lateral side facing up and feet at the base of the table. Using a scalpel, a cut
was made laterally down the central portion of the bird the keel until approximately halfway
past the abdominal fat pad. Scissors were then used to cut alongside the ribs on both the left