Implementation on Data Acquisition by
Reducing Energy Hole Evolution
Siddharth Sunil Burse , Prof. M.V. Nimbalkar
Department of Information Technology, Sinhgad College of Engineering, Pune, India
ABSTRACT: This data acquisition in a Continuous way in wsn is critical, because of network lifetime where sensor nodes battery is powered timely and update the surrounding and forward data to sensor node. The proposed system represents an diagnostic model to modulate the entire life of the network from initialization until it is completion, and determine the limit of energy-hole in a data-gathering WSN. Specifically, In particular, Proposed work gauge the various activity like traffic load, consumption of energy , and sensor nodes Life time during the lifetime analysis. Moreover, we plan the impermanent sensor node and spatial advancement of energy-hole and apply our outcome to WSN routing in order energy is balanced and consumption is improved the lifetime of network. Simulation of the results are provided to validity of the proposed model in calculating the network lifetime and energy hole evolution process.
KEYWORDS: Energy efficiency, energy hole, network lifetime, routing, WSN.
I. INTRODUCTION
WSN is a gathering enormous number of self-planned sensor nodes which occasionally [10] monitors data from neighboring and send it to sink node. WSN is generally used for intention tracking in military, traffic monitoring, Intrusion and fire detection. The nodes sense normally are tiny in size contains three units Sensor unit which sense data from neighboring and the unit which process it for data processing and data storage and transceiver unit which is transmit data to sink node from sensor node. The nodes are deployed in antagonistic areas so it is not possible to provide nonstop energy supply to nodes,In that they are usually battery powered with partial energy.
Due to constraints compulsory by the available supply of energy to ecan and every node has limited calculation power and memory [1]. Major task of sensing node that senses it and node is to sense and record data for neighboring and send it to sink node if compulsory, now and again sink node can also send data to sensor nodes though broadcast messages as well as nodes may need to be in touch with each other. In order to enhance lifetime of the network, it is fundamental task to decrease the utilization of energy by each nodes.
II. RELATED WORK
Kuan zhang et al.[1] This paper focus is on sensing the data and transferring to the application where it is processed by sink node and sensed by the sensing node and transfer it with the help of relay nodes, as the energy is the main point to be focused so as its energy should be consumed and maximum data should be transferred,if energy get consumed and no further transfer of data causes energy hole concept which is also described in paper and to resolve it we discuss the algorithms like BTC for calculating energy and distance of the node and blowfish algorithm.
Y. Tung et al.[2] This paper uses the technique Channel selection algorithm and Interface selection algorithm which is used to select the appropriate path . The RTT measurement is only carried by sender and so no extra network traffic has been generated. RTT provides the Updated transmission condition of the entire path because the path cost cannot be updated frequently because it can updated by performing route discovery, which may degrade the network. And main points referred Advanced Metering in Infrastructure (AMI), Building area network(BAN), Multi-interface,smart grid,ZigBee.
C. Tung et al.[3] This paper focus on the technique called Bi-directional communications technique that handhelds always select the best LQI frontend router in which the data can be send from both the end without any interruption or waiting for another to transmit and focus is on ZigBee sensor network for medical , mobilized management,patient monitoring are the mainly focused.
M. Magno et al.[4]This paper works on the technique PIR Direction Algorithm ,the paper exploits the technique that pick advantage of benefits of each and lifetime of the network is extended while maintaining similar (or improved) security and the point to be focused are Energy efficiency, Multi-source energy harvesters, Overlay networks, Power electronics ,Power management, Wake-up radio WSNs.
Y. Zhang et al.[5] This paper works on the technique which Determine the optimal network lifetime under a fixed sensor nodes , and the cluster radius under a fixed sensor nodes.Non-Uniformity significantly improve the efficiency of the energy and lifetime of the network and the point referred are, lifetime network , Not uniform node distribution ,Energy consumption.
A. Liu et al.[6]Paper focuses the technique Node differential algorithm,Global Same algorithm,Ring Same algorithm which explains the consumption of nodes energy away from sink is increased, till the energy consumption is not higher than nodes near to the sink and the overall lifetime is improved and the key referred points are Wireless Sensor Network, Hotspots ,Transport delay,Reliability ,network Lifetime.
K. Li et al.[7] This paper work on the technique Routing Algorithm which determine which route is perfect for the transmission which will take care of consumption of energy and increase lifetime of Wireless Sensor Network also including redundant sensor , not uniform sensor distribution , aggregation and forwarding nodes for data transmission and the referred points are Lifetime maximization , Network design , energy allocation optimally.
A. Chakraborty et al.[8] Paper uses technique called Shortest Path Algorithm Which work for shortest path from source to destination and reduce the energy consumption and improvement of efficient energy and estimate of lifetime are important issues in these energy constrained networks which referred points Wireless sensor networks,Network lifetime,Discrete radio mode.
M. Noori et al.[9]This paper focus on using a technique K-mean clustering algorithm which determine cluster based on a periodic schedule which removes the need for the packets which are overhead which result energy efficiently worked in the network and referred points are Cluster formed, lifetime of network, event-driven , random deployment system.
III. PROPOSED SYSTEM
sensing node is to mitigate consumption of energy for data. By leveraging problem related to analytics of an particular securities of data sensor and accumulation node security by bridge full of protection .Further node to node authentication which gives security to node communication for further packet broadcasting.
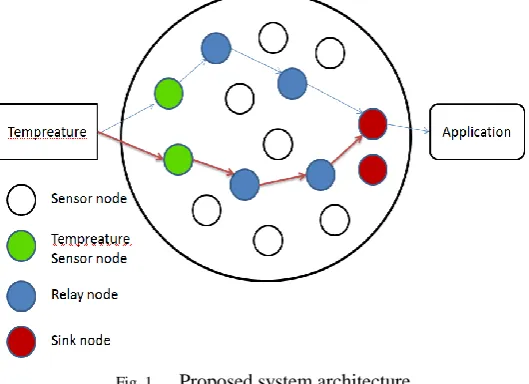
Fig. 1. Proposed system architecture
Which further define the lifetime of the network as the period from the network start-time to the time when the network is disabled. For a data-gathering WSN, the network is generally disabled under the following two situations. One is that all the nodes which are sensing exhaust their energy and die. Other is sink cannot receive any data in that particular period due to energy hole partitioning the network, even if there are number of nodes alive in outer region of the energy hole. For simplification, denote the lifetime of the network as ANDT and FNDT as first node dies. We describe the entire process of lifetime of the network in Fig. 1. Since the sensing nodes after the particular time interval send the data which is sensed is sended to the sinking node in a particular data period, the lifetime of the network is divide in slots into a large number periods of data. Which will help to increase the life of the network?
IV. PROPOSED ALGORITHM
In this routing protocol planned is intended for WSNs in which the sensor nodes are static. Beside the applications running in the WSN require the information gathered by the all sensor nodes and have to be transmitted instantly to the sink. In all the variables at the each node j are represented as follows.
CFj,1 = Value of first cost field of node j CFj,2 = Value of second cost field of node j PFj,1 = Value of first parent node field of node j PFj,2 = Value of second parent node field of node j Nj = jth node
REj = Remaining energy of Nj Cj =1
REj= each nodes cost to be added to a path
and set its second parent field so that the path to the sink node through it has the second least cost. Node j broadcast ADV1and ADV2 has the following parameters.
ADV 1 = (Nj ,CFj,1, PFj,1), ADV 2 = (Nj ,CFj,1)
BTC-phase1 describes the how to construct the initial tree which performs its task as follows. At the beginning of first period, each node except the sink node sets its both cost fields to and parent node fields to -1, but at the starting of the subsequent periods, the each node only sets its both of the cost field to and no change is made to the parent node fields. The sink node sets its both cost fields to 0 and set its parent node fields to its own ID. At the beginning of this phase, sink node transmit an ADV1 message to all its neighbours. When a node receives an ADV1 message, it does not broadcast its own ADV message to its neighbour immediately. Following steps are executed before sending the ADV1 message to its neighbours,
1. When a node receives the first ADV1 message, it sets backoff timer.
2. If the first ADV1 message comes from the sink node,and then this node stores to the sink node ID in two parent node fields, and computes the new cost by adding reciprocal of it’s the left over energy to the received cost, and stores the new cost in two cost fields. If the first ADV1 message comes from the any other node in the network, then the node is compare the new cost with the existing cost stored in the first cost field
3. Upon reception of any further ADV1 message from other neighbors, it is computes the newly cost in the same manner as in the step 2. If the previous node has already stored the sink node ID in its parent node field, then it will discard the ADV1 message, otherwise, it compare this new cost with the presenting cost stored in its first cost field and updates its cost fields and parent node fields as in step2.
4. Once the back off timer expires, the node broadcasts ADV1message that contains its own ID, the value stored in the first cost field, and the parent node ID stored in the first Procedure BTC-phase1 begin if (First period) then
Procedure: Construction of Updated BTC (Energy + Distance)
Input: Initial source node sn, Destination node dn, Group of neighbor nodes nd [], each node id, each node energy eng. Output: Source to destination path when data received success.
Step 1: User first select the sn and dn
Step 2: choose the packet or file f for data transmission. Step 3: if(f!=null) fd <= f
Step 4: read each byte b form fd when reach null Step 5: send data, initialize cf1,cf2,pf1,pf2. Step 6: while (nd[i] when reach NULL) Cf1=nd[i].eng
Pf1= nd[i].id Cf2=nd[i+1].eng Pf2= nd[i+1].id Step 7: if (cf1>cf2) Cf2=null Pf2=null Else
Pf1=pf2 Cf1=cf2; Pf2=null Cf2=null Step 8: end while
Step 9: repeat up to when reach at sink node
Algorithm 2
Input: Network radius R, transmission radius r, node density of the network ρ, and other parameters.
Output: The energy hole boundary [dshole, dehole] and emerging time th. 1:Run Algorithm 1 until there is a continuous dead ring whose
width d satisfies d ≥ r;
2: The boundary of this dead region is the request [dshole, dehole]; 3: The lifetime at this network stage is the emerging time th; 4: return [dshole, dehole] and th.
Blowfish Algorithm
The subkeys are calculated using the Blowfish algorithm:
1. Initialize first the P-array and then the four S-boxes, in order, with a fixed string. This string consists of the hexadecimal digits of pi (less the initial 3): P1 = 0x243f6a88, P2 = 0x85a308d3, P3 = 0x13198a2e, P4 = 0x03707344, etc.
2. XOR P1 with the first 32 bits of the key, XOR P2 with the second 32-bits of the key, and so on for all bits of the key (possibly up to P14). Repeatedly cycle through the key bits until the entire P-array has been XORed with key bits. (For every short key, there is at least one equivalent longer key; for example, if A is a 64-bit key, then AA, AAA, etc., are equivalent keys.)
3. Encrypt the all-zero string with the Blowfish algorithm, using the subkeys described in steps (1) and (2). 4. Replace P1 and P2 with the output of step (3).
5. Encrypt the output of step (3) using the Blowfish algorithm with the modified subkeys. 6. Replace P3 and P4 with the output of step (5).
7. Continue the process, replacing all entries of the P array, and then all four S-boxes in order, with the output of the continuously changing Blowfish algorithm.
MATHEMATICAL MODEL
The proposed system denoted as S, which holds di erent modules like S= S1,S2,S3,S4. Each
module hold the own execution. S1 is the simulation creation with 100 nodes with source and sink node. S2 holds the data transmission of system. S3 is the path
nding based on
proposed algorithms and
nally S4 executes the overall system analysis. S1=fS1ig this is the single sink node
S2= fS21, S22. . . .. S2n g this is the subset of sensor node.
S3 =fInode1,Inode2. . . .Inodeng this is the subset of intermediate Running nodes. S4=fSnode1,Snode2. . . .Snodeng this is the subset of leaf node which are in sleep mode Here S is proposed approach which handles the linier transmission, the result of
transmission as well as receiving Ds=fdp1,dp2dp3. . . .dpng these is set of data packets transmitted from sensor node to sink node.
Activity I
Generate sink node and its neighbor counts
Let S1 Sink Node having a set of parameters for Selecting neighbor nodes S1= fN1,N2,N3. . . Nng
Where,
Total Neighbors = neighbors count Observation
Activity II
Sensor Node Module
Lets S2 be a set of sensor nodes
S2=fN1,N2,N3. . . ..Nn number of nodes) Observation
If each node id is unique then accept else discard node id Activity III
Data Transmission and Result module Let S3 proceed the data transmission module S3: {SenderID, ReceiverID, DataPacketg} SenderID reads when neighbors counts != NULL
Success condition If(s1 !=null or network tree load success) Failure condition
If(s1==null and network tree loading failure) Nd=fSN1,SN2,SN3. . . SNng Nd denoted the group of nodes
Ndi=fSNk,Ndg
Ndi also denoted the set of nodes SNk is sink node and Nd is set of sensor nodes but all nodes having at least one sink node
Path Selection
NN=fnn1,nn2,nn3|{nnig
NN is set of neighbor nodes of current node Ni Observation
If the node having valid trust then send else not able to send.
V. RESULTS AND DISCUSSIONS
In this section we present the evaluation of proposed system as well as existing system.After describing our experimental setup, we quantitatively evaluate the analysis with respect to the different parameter used such as throughput, packet delivery ratio, cost, and time.
1. Experimental Model :
We run our experiments in NS2 simulator version 2.35 that has shown to produce realistic results. NS simulator runs TCL code, but here use both TCL and C++ code for header input. In our simulations, we use Infrastructure based network environment for communication. For providing access to the wireless network at anytime used for the network selection.
Type of simulation
Behaviour of Parameters versus Simulation Time for Different Nodes
This Parameters are defined and evaluated below:
1. Average End-To-End Delay :
End-to-End Delay (E2ED) refers to time occupied by a data packet travel from a source to a destination in a network. Here only data that reaches successfully to the destination are considered. The minimum value of E2ED means good performance of the protocol. The smallest amount value of end-to-end delay states superior performance of the protocol.
E2ED=Sum (Data Packet arrive time-Data packet send)/(Number of connection)
2. Packet Delivery Ratio :
The packet delivery ratio (PDR) defined as a ratio of numbers of data packets reached to target over the network to number of packets generated. The greater amount value of packet delivery ratios states superior performance of the protocol.
3. Throughput :
Throughput can be defined as the ratio of the total bytes in data packets received by sink nodes to time from first packets generated at a source to last packet received by sink nodes. The greater value of throughput states superior performance of the protocol.
Throughput=(Total Bytes in data packets received by sink from first packet generated at source to last packet received by node )
4. Energy Consumption :
Energy consumption is most important concepts in WSN. The lifetime of the sensor network is based on energy consumption of the sensor node. Total energy consumption of the node defined as the difference between initial energy and final energy of the node. The smallest amount value of energy consumption states superior performance of the protocol.
Total Energy Consumption = sum(Initial Energy of node – Final Energy of the nodes sfter Simulation)
This Parameters are been evaluated and tested for different number of nodes and at different simulation time for knowing the performance of the proposed vs existing system.
For 100 Number of Nodes 1. Delay versus Simulation Time :
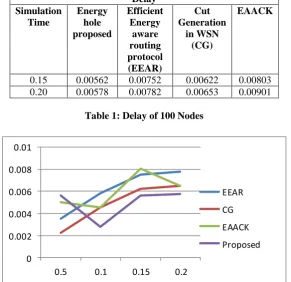
The end-to-end delay in EEAR, CG and EAACK increases with increase in Simulation time. However, increasing treads in CG and EEAR is much higher than Proposed as shown in Table 1. The smallest amount value of end-to-end delay states superior performance of the protocol. Figure 1 shows, proposed system gives superior perform than other three protocols.
Delay Simulation
Time
Energy hole proposed
Efficient Energy
aware routing protocol (EEAR)
Cut Generation
in WSN (CG)
EAACK
0.15 0.00562 0.00752 0.00622 0.00803 0.20 0.00578 0.00782 0.00653 0.00901
Table 1: Delay of 100 Nodes
0 0.002 0.004 0.006 0.008 0.01
0.5 0.1 0.15 0.2
EEAR
CG
EAACK
Proposed
2. Packet Delivery Ratio versus Simulation Time :
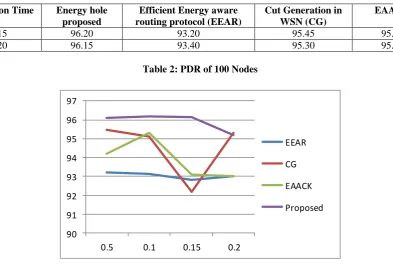
The packet delivery ratio of EEAR, CG and and EAACK than proposed system decreases with increase in Simulation Time as shown in Table 2. However, decreasing treads in EEAR and CG is much smaller than proposed approach. The greater amount value of packet delivery ratios states superior performance of the protocol as shown in Fig 3
Simulation Time Energy hole proposed
Efficient Energy aware routing protocol (EEAR)
Cut Generation in WSN (CG)
EAACK
0.15 96.20 93.20 95.45 95.10
0.20 96.15 93.40 95.30 95.03
Table 2: PDR of 100 Nodes
90 91 92 93 94 95 96 97
0.5 0.1 0.15 0.2
EEAR
CG
EAACK
Proposed
Figure 3 PDR vs simulation time
3. Throughput versus Simulation Time
Figure 4 shows the throughput under different networks scale in CG, EEAR, EAACK and Hybrid RIMAC. The throughput in proposed, EEAR, EAACK and CG increases with increase in Simulation Time. The greater value of throughput states superior performance of the protocol as shown in Table 3
Throughput Simulation
Time
Energy hole proposed
Efficient Energy
aware routing protocol (EEAR)
Cut Generation
in WSN (CG)
EAACK
0.15 196.20 193.20 185.45 185.10 0.20 196.15 193.40 185.30 175.03
160 165 170 175 180 185 190 195 200
0.5 0.1 0.15 0.2
EEAR
CG
EAACK
Proposed
Figure 4 Throughput vs simulation time
4. Energy versus Simulation Time
The energy consumption of CG, EEAR, EAACK and Hybrid CG decreases with increase in Simulation Time . However, decreasing treads in CG and Proposed approach is much higher than EEAR, EAACK as shown in Table 4. The smallest amount value of energy consumption states superior performance of the protocol as shown in Fig 5.
Energy Simulation Time Energy hole
proposed
Efficient Energy aware routing protocol (EEAR)
Cut Generation in WSN (CG)
EAACK
0.15 755 1120 1320 1760
0.20 956 1293.40 1570 1985
Table 4: Energy required for simulation of 100 Nodes (Jules)
0 500 1000 1500 2000 2500
0.5 0.1 0.15 0.2
EEAR
CG
EAACK
Proposed
Figure 5 Energy vs simulation time
VI. CONCLUSION
REFERENCES
[1] Ju Ren, Student Member, IEEE, Yaoxue Zhang, Kuan Zhang, Student Member, IEEE, Anfeng Liu, Jianer Chen, and Xuemin (Sherman) Shen, Fellow, IEEE,”Lifetime and Energy Hole Evolution Analysis in Data-Gathering Wireless Sensor Networks”,IEEE Transactions on industrial informatics, VOL. 12, NO. 2, april 2016
[2] G Y. Tung ,“The generic design of a high-traffic advanced metering infrastructure using zigbee”, IEEE Trans. Ind. Informat., vol. 10, no. 1, pp. 836–844, Feb. 2014.
[3] C. Tung,“A mobility enabled inpatient monitoring system using a zigbee medical sensor network”, Sensors, vol. 14, no. 2, pp. 2397–2416, 2014.
[4] M. Magno, D. Boyle, D. Brunelli, E. Popovici, and L. Benini,“Ensuring survivability of resource intensive sensor networks through ultra-low power overlays”, IEEE Trans. Ind. Informat., vol. 10, no. 2, pp. 946–956, May 2014.
[5] J. Ren, Y. Zhang, and X. Lin,“NUND: Non-uniform node distribution in cluster-based wireless sensor networks”,KSII Trans. Internet Inf. Syst., vol. 8, no. 7, pp. 2302–2324, 2014.
[6] A. Liu, D. Zhang, P. Zhang, G. Cui, and Z. Chen, “On mitigating hotspots to maximize network lifetime in multi-hop wireless sensor network with guaranteed transport delay and reliability” , P2P Netw. Appl., vol. 7, no. 3, pp. 255–273, 2014.
[7] K. Li , “Optimal number of annuli for maximizing the lifetime of sensor networks”, J. Parallel Distrib. Comput., vol. 74, no. 1, pp. 1719–1729, 2014.
[8] A. Chakraborty, R. Rout, A. Chakrabarti, and S. Ghosh, “On network lifetime expectancy with realistic sensing and traffic generation model in wireless sensor networks”, IEEE Sensors J., vol. 13, no. 7, pp. 2771– 2779, Jul. 2013.
[9] F. Ye, A. Chen, S. Lu, and L. Zhang, “A scalable solution to minimum cost forwarding in large sensor networks,” in Computer Communications and Networks, 2001. Proceedings. Tenth International