ABSTRACT
CHAVEZ, STEPHEN JOHN. Preference and Estimation of Intake in Cattle, Horses, and Pigs. (Under the direction of Dr. Gerald Huntington).
The objectives were to 1) use alkanes to estimate intake of cattle consuming a mixed
forage diet and then to use the alkane method to estimate intake of grazing horses and 2)
determine preference for feeds with nutritive additives that can influence intake through
orosensorial properties. Twelve beef cattle were housed individually with access to six
feeding stations and fed a supplement dosed with dotriacontane and hexatriacontane. They
were given a blended alfalfa:switchgrass hay flavored with water for control, sucrose as
sweetener, or citric acid as sour additive. Intake was estimated from hay and fecal analyses
for alkanes. There was no difference (P < 0.35) between actual and estimated intake using hentriacontane (C31) as an internal marker. Cattle preferred (P < 0.01) the hay with sucrose addition over both control and citric acid addition, while preferring (P < 0.01) the control
over citric acid.
The alkane procedure previously used in the cattle was used to estimate intake of
horses stall-fed or grazing pasture. Oats were dosed with hexatriacontane. Six mature
geldings were randomly assigned to either a hay-fed or pasture treatment for 14 d and then
switched to the other treatment. All horses were housed in stalls without feed from 0700 to
1300 daily and given hay ad libitum or access to pasture for 1300 to 0700. Horses were
supplemented with hexatriacontane alkane-coated oats. Fecal grab samples were collected
pasture intake with C33. Estimated pasture intake with C31 was 11.74 ± 0.51 kg DM/d and
13.90 ± 0.53 kg DM/d with C33.
Alkanes were used to estimate and compare intake of horses that began their daily
grazing in the AM versus PM. Using oats to administer the even-chained alkane, the same six
horses were assigned to either initiation of grazing in AM from 0700 to 1500 or PM from
1230 to 2030 in a random switchback design. Horses grazed non-toxic endophyte-infected
tall fescue and were housed individually in pens with water during the remainder of the d.
There was a tendency for an interaction where horses had higher estimated intakes (P < 0.07)
in period 2, while intakes were higher in the PM for estimates with C33 as compared to C31.
When estimating intake with hentriacontane, estimated intake was higher (P < 0.03) in period
2 and tended (P = 0.10) to be higher in the PM.
Twenty second parity or greater sows of mixed breed were randomly assigned to a
sweet or umami taste group with a nutritive and non-nutritive ingredient taste additive in
each group. The sweet group consisted of control (CON), sucrose (SU) or non-caloric
sweetener (SW) and the umami group with CON, monosodium glutamate (MSG) or
non-nutritive umami additive (UM). The effect of flavoring agent fed to sows on piglet taste
preference at weaning was determined by cross-fostering piglets across respective taste
groups at parturition. At weaning, pigs were given 3-d double-choice preference tests. The
SU and SW pigs preferred (P < 0.03) SU over CON, SU and CON pigs preferred (P < 0.02) SU over SW, and CON pigs preferred (P < 0.01) SW over CON. Pigs in the UM group
Preference and Estimation of Intake in Cattle, Horses, and Pigs
by
Stephen John Chavez
A dissertation submitted to the Graduate Faculty of North Carolina State University
in partial fulfillment of the requirements for the degree of
Doctor of Philosophy
Nutrition
Raleigh, North Carolina
2011
APPROVED BY:
_______________________________ ______________________________
Dr. Gerald Huntington Dr. Paul Siciliano
Committee Chair
________________________________ ________________________________
BIOGRAPHY
Stephen J. Chavez was born on July 28, 1982 in York, Pennsylvania. Spending much
of his youth exploring the state forest in Northern Pennsylvania, he became interested in
wildlife nutrition and behavior. During high school, Stephen participated in many
organizations and received the graduating class award for excellence in the sciences. He had
decided there was only one university that he was willing to attend, and he was accepted to
the Pennsylvania State University. Majoring in Animal Bioscience, Stephen kept his interest
in behavior with a minor in Psychology, where he was inducted in Psi Chi, the International
Honor Society in Psychology. Stephen’s animal interests were in horses and poultry. Stephen
worked for two years after graduating in 2004 with high distinction so he could save money
to continue his education where he attended West Virginia University under the direction of
Dr. Eugene Felton. Working to connect behavior data with nutrition in cattle, goats, and
sheep, he became friends with many dietetics graduate students. After completing his
Master’s of Science in Animal and Nutritional Sciences, he accepted an internship at the
Indianapolis Zoological Society under Dr. Jason Williams. Spending the summer researching
comparative nutrition in exotic species, he focused on taste research in dolphins. At the end
of the internship, Stephen moved to Raleigh, NC to begin his PhD in Nutrition and Animal
TABLE OF CONTENTS
LIST OF TABLES……….……….. v
LIST OF FIGURES…………..……….……… vii
Chapter 1: Literature Review……….. .1
Introduction……….………..………...2
Taste...……….………...2
Taste receptors……….…….………….………...3
Hedonic reward……..……….………...5
Early flavor exposure…………...…….………...………6
Nutrition content and taste……..……..………...8
Post-ingestive feedback…………...………...11
Eating rates…...……….……..……….………..13
Total intake………..….………..14
Hormonal factors of intake……...…….………...15
Taste and hormones………..….……….17
Measuring and estimating intake……..….……….18
Alkanes……….………..………19
Alkane analysis………….………..………....22
Estimation of intake....………..……….23
Dry matter digestibility………..………....23
Summary…….……...………..………..24
Literature Cited.………...………..………26
Chapter 2:Estimation of intake in cattle fed a blended switchgrass and alfalfa hay diet………..……….37
ABSTRACT………..………...38
Introduction………..………...38
Materials and Methods………..……….40
Results………..………..45
Discussion………...……….……….……….46
Conclusion………..………..…..48
Literature Cited………..………....48
Chapter 3: Intake estimation of horses grazing tall fescue (Festuca arundinacea) or fed tall fescue hay……….……….53
ABSTRACT……..………...………..54
Introduction…..………...………...………55
Materials and Methods……….………..56
Results……..………...………...58
Discussion…...………..……….59
Chapter 4:Intake estimation of horses grazing tall fescue (Festuca arundinacea) during
morning or evening…...………...………... ………..69
ABSTRACT……….……….. ………...70
Introduction...…….………71
Materials and Methods……..………..…...72
Results………..………..75
Discussion……….………...75
Literature Cited……...……..………...79
Chapter 5: Preference of a ground switchgrass and alfalfa hay blend flavored with sucrose or citric acid in cattle...………86
ABSTRACT……….………..87
Introduction…….………...88
Materials and Methods……….………...89
Results…….………...91
Discussion………….……….………...………….92
Literature Cited……….……….94
Chapter 6:Preference in weanling pigs for sweet or umami taste after in utero exposure.….……….……….…101
ABSTRACT……….…………...…….………102
Introduction……...…….……….……….103
Materials and Methods…...………….……….…..104
Results and Discussion……….……….………...106
Literature Cited……….……...………..110
LIST OF TABLES
Chapter 2
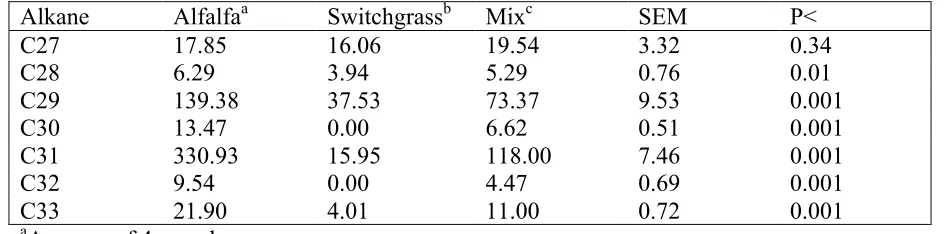
Table 2.1. Alkane composition of hays (mg/kg sample DM)………..…...51
Table. 2.2. Alkane concentrations of fecal samples (mean ± SD)………..……52 Chapter 3
Table 3.1. Chemical Composition of feeds………...…..64
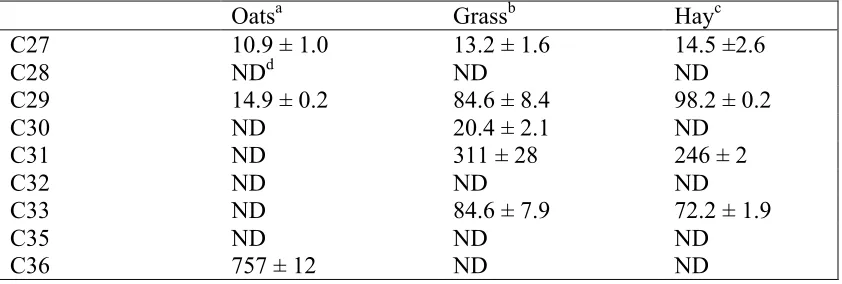
Table 3.2. n-alkane concentrations (mg/kg DM) of feeds consumed in treatments.………...67
Table 3.3. n-alkane concentrations (mg/kg DM) of feeds consumed in treatments……...….68 Chapter 4
Table 4.1. Nutrient Composition of tall fescue (Festuca arundinacea)………..……….82
Table 4.2. Alkane concentrations (mg/kg DM) of feeds consumed by horses……….……..83
Table 4.3.Intake estimates of horses grazing AM and PM in either period 1 or 2……..…...84
Table 4.4. Nonstructural Carbohydrate (% DM)………..………..85 Chapter 5
Table 5.1. Nutrient composition of hays and concentrate………..……….96 Chapter 6
Table 6.1. Sow gestation diet composition and nutrient composition for crude protein, water soluble carbohydrate, and Na……….…..114
Table 6.2. Sow lactation diet composition and crude protein, water soluble carbohydrate, and Na……….…………115
Table 6.4. Preference % for type of sweet additive on weanlings from different sweet
gestation and lactation treatments……….…………...118
LIST OF FIGURES
Chapter 1
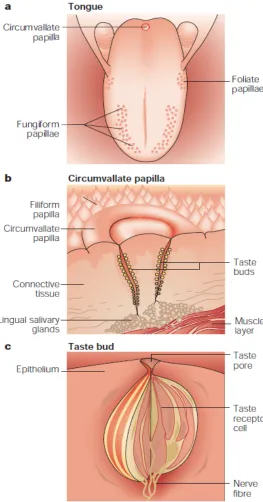
Figure 1.1: Diagram of a) location of papillae on tongue; b) taste buds in each papilla; c) taste receptor cell within a taste bud………..34
Figure 1.2: Mechanism of pathways through taste receptor cells leading to activation of neurons and taste discrimination………....35
Figure 1.3: Intensity of post-ingestive feedback determines the level of preference or
aversion of a given food……….36
Chapter 3
Figure 3.1. Hay intake in individual horses with actual and estimated intake using C31:C36 or C33:C36 alkane pairs………..65
Figure 3.2. Hay intake in individual horses with actual and estimated intakes as a % body weight using C31:C36 or C33:C36 alkane pairs……….66
Chapter 5
Figure 5.1: Cattle DMI (kg) ± MSE of CON, S100, and CA50 in Experiment 1……….….97
Figure 5.2: Hay intake (kg) ± MSE at each feeding station, Experiment 1…………..……..98
Figure 5.3: Cattle intake (kg) ± MSE of CON, CA10, and CA25, Experiment 2…….…….99
Figure 5.4: Cattle intake (kg) ± MSE of S100, S150, and S25, Experiment 2……….……100 Chapter 6
Figure 6.1. Diagram of cross-fostering piglets with the number of pens representated during preference testing for each gestation/lactation combination………..117
Figure 6.2. Serum insulin in weanlings across dietary treatments………..………..120
Figure 6.3. Sow serum insulin concentrations before and after feeding across dietary
Figure 6.4. Sow plasma glucose before and after feeding across dietary treatments…..….122
Figure 6.5. Weanling serum leptin across gestation and lactation treatments……..………123
Introduction
When given the opportunity to select among feeds, mammals will often take time to
test their options before choosing a feed to consume. Grazing herbivores select food sources
that vary in nutrient composition and must consume the required nutrients independently of
one another when quality forages are unavailable (Simpson et al., 2004). This selection of
foods to consume varying amounts of nutrients is caused by independent regulation of
nutrients and possibly learned. Animals may then select feeds which are more valuable in
certain nutrients based on palatability, mainly taste, and post-ingestive feedback. Many
factors affect which food is selected, such as taste, texture, and smell (Grovum and Chapman,
1988). Flavors and odors from spices such as anise and garlic are very strong and are known
to transfer through milk and amniotic fluid into the human fetus (Hepper, 1988). This method
of transmission can alter animal preference during early food choices due to familiarity of
taste and smell.
Taste
The five basic tastes perceived by humans and many other mammals are sweet, salty,
sour, bitter, and umami (Mombaerts, 2004). Salty and sour foods are associated with sodium
and hydrogen ions, sweet with sugars, umami with glutamate, and bitter with toxins, such as
alkaloids and tannins (Sola-Oriol et al., 2009; Provenza et al., 2000).
When newborn human infants were given flavored solutions to drink, the infants
found water to be aversive and limited the intake of water (Desor et al., 1975). When flavors
neither the salty or bitter solutions were. The salty and bitter tastes could have been masked
or not perceived in the sucrose solution.
Taste receptors
Of the five basic senses, taste and smell are very similar in regards to the type of
chemosensory stimulation (Mombaerts, 2004). Taste is one of the five basic senses used by
mammals playing a major role in food intake. This basic sense allows animals to identify
different feed constituents such as sugars, acids, salts, and amino acids in the oral cavity
(Roura et al., 2008). Taste receptors are found on papillae of the tongue and soft palate of
humans (Mombaerts, 2000). Papillae are seen in three major types, fungiform, circumvallate,
and foliate, which each have many taste buds (Figure 1.1).
Taste receptors develop at different times, beginning in utero and shortly after
parturition and innervation at the IX cranial nerve can prevent the full development of vallate
taste buds (Hosley et al., 1987). A sensitive period occurs during the first ten days postnatally
in the rat. If damage is done later in life, taste bud regeneration is more likely than early in
life. The development of taste buds is less likely if damage is done during this sensitive
period.
Several taste receptor families exist for vertebrates that correspond to sweet and
umami tastes (T1R family) and bitter taste (T2R family) that can affect a vertebrate’s feeding
preference (Shi and Zhang, 2006). Both types of receptors are G-protein coupled receptors
(Figure 1.2). Sweet taste is found when T1R2 and T1R3 form heterodimers while umami and
vertebrate species, T1R appears to be well conserved while the T2R has more variation. This
change in bitter taste receptor cells may reflect toxins or other negative compounds found in
different foods that have traditionally been eaten by different vertebrates over the years.
Pseudogenes, or unexpressed genes, are highly variable in the T2R across species possibly
reflecting evolution and adaptation of methods to avoid bitter or toxic food. Cattle have a
higher number of pseudogenes for bitter taste perception possibly from decreased toxic
effects with the rumen environment (Li et al., 2005). Very few vertebrate species have been
identified that have lost sweet taste perception, most notably the chicken which lost the T1R2
gene. The T1R2 appears to become inactivated in cats, hence the lack of preference for sweet
food (Li et al., 2005).
Sour taste is aversive because the taste is associated with acids in foods (Huang et al.,
2008). Different acids have different intensities ranging from weaker sour taste in mineral
acids to stronger in organic acids. The type of acid influences how quickly the cytosol can be
acidified. Type III presynaptic taste bud cells in mice have been found to respond to sour
taste with changes in Ca+2 influx and a release of serotonin but no effect on Type II cell ATP
secretion.
When taste receptor signaling was removed in genetically modified mice, mice still
preferred glucose over isocaloric amino acids (Ren et al., 2010). This was independent
selection for glucose without the taste signaling on the tongue of mice. This preference may
result from post-absorptive metabolic processes with glucose oxidation or glucose transport
to the brain affecting dopamine release independent of the nerve pathways for taste. The
have a role in the preference for glucose. Thus the ability of each nutrient to affect glucose
oxidation may have caused the increased preference for carbohydrate over a protein.
Nutrient content of foods influences caloric intake (Simpson et al., 2004). Because
many people are affected by diseases such as diabetes and are required to lower their sugar
intakes, artificial sweeteners are increasingly popular. Frank et al. (2008) compared sucrose
and sucralose (artificial sweetener) and both had high correlations for sweetness. Although
both sucrose and sucralose bind to the sweet taste receptors, brain activation pathways differ
with sucrose activating ten anatomical regions and sucralose only activating three. The main
primary taste cortex, the frontal operculum and anterior insula, had similar activations from
both sucrose and sucralose, but sucrose activating more brain regions may be why sucrose
initiates a different brain response without humans identifying a major difference in
sweetness (Frank et al., 2008).
Hedonic rewards
Stressful situations can often cause an animal to seek calming or familiar stimuli,
such as a familiar location or food. Handling of young rats is a stressful stimulus and resulted
in depressed accumbens dopamine metabolism and decreased preference for sweet foods
(Silveira et al., 2010). Young rats typically have a strong preference for sweet foods and
non-handled rats had more hedonic responses to 1 M sucrose solution than non-handled rats with no
difference in aversive reactions.
When considering the taste of food, the intensity can also influence human preference
sensory-specific satiety. Sensory-sensory-specific satiety is when the pleasantness of the food decreases and a
novel food would be preferred. Havermans et al. (2009) found no difference in the ratings of
individuals given various intensities of strawberry lemonade and concluded that the hedonic
processing of the various intensities may be found in a different location of the brain as that
determining preference based on the intensity of the food.
Early Flavor Exposure
In utero exposure to certain feed components may alter later preferences from taste
and odor. Many foods have a distinct odor, and when consumed, can change the odor of
amniotic fluid, such as seen in humans (Mennella et al., 1995). The consumption of garlic not
only alters the odor of amniotic fluid, but can change the taste and odor of breast milk in
women. Women that consumed anise flavor during pregnancy had infants that preferred the
odor of anise during the first several days after birth (Schaal et al., 2000). Babies not exposed
to the anise flavor in utero had an aversive or neutral response to the odor.
Prenatal exposure in pigs when a sow was fed anise-flavored feed decreased stress
behaviors compared to unexposed pigs during gestation (Oostindjer et al., 2009).
Morrow-Tesch and McGlone (1990) found that piglets have well-developed olfactory abilities to
differentiate between novel odors. The piglets preferred being near scents from the mother’s
feces or skin secretions and avoided the mother’s urine. Crying time in newborn infants was
decreased when infants were separated from their mother but provided the odor of the
mother’s amniotic fluid (Varendi et al., 1998). Crying time was not different when the babies
Feed selection in many species can be influenced by the mother-offspring
relationship. Orphaned lambs were fed a milk replacer flavored with either onion or garlic
and were given preference tests to determine if the early exposure in milk would alter their
preference when transitioned to solid feed (Nolte and Provenza, 1992). Lambs preferred the
feed flavored with the same treatment as in the milk replacer and consumed more than 50%
of total intake of that feed. Lambs recognized these flavors without having a social aspect to
learning which feeds are nutritious from their mother.
Each flavor has a different capacity to cross into milk from blood during lactation
making the composition of milk diverse in flavors and intensity (Hausner et al., 2008).
Volatiles in the human mother’s diet are clearly transferred into the milk, but non-volatiles
such as sugars, glutamate, and urea may also affect early exposure to flavors. Sucrose
infusion (2.5%) into the ovine fetus resulted in increased swallowing while saline infusion
did not (El-Haddad et al., 2005). Early exposure can also affect intake after weaning in pigs
(Langendijk et al., 2007). Sows fed diets with anise and garlic increased post-weaning intake
of piglets weaned at six weeks of age. King (1979) fed flavored diets to sows and found the
flavor, Firanor No. 24 (Firmenich et Cie, Geneva), was transferred through the milk at 9
ppm. Weaned pigs then had a higher intake when the flavor was added to the starter diet and
had a tendency for higher average daily gains compared to pigs consuming unflavored diets.
Weaning is very stressful for most mammals, including pigs (Oostindjer et al., 2010).
Although the in utero flavors may not be preferred by piglets at weaning, the familiarity of
the flavors led to higher intake and resulted in a higher body weight. Of great importance was
gestation. Fewer negative behaviors were seen in pigs that were from sows of the flavored
diets, such as aggression and oral manipulation, all which can be seen in high stress
environments. Human infants with prenatal exposure in breast milk or in utero exhibit fewer
negative behaviors when given food with the same flavor (Mennella et al., 2001). The
consumption of carrot juice either during gestation or lactation decreased facial expressions
of young babies fed solid foods with carrot flavor. Palatability early and later in life may be
influenced just as much by odor as well as taste during in utero exposure.
The maternal diet can alter preferences besides for taste alone (Bayol et al., 2007).
Pregnant rats fed high energy, fat, sugar, and salt diets were followed through gestation and
lactation and the pups monitored through growth. This type of diet was used to mimic that of
high calorie, high fat, high sugar diets characteristic of many human diets. The offspring
from the rats consuming the junk food diet were heavier and had a higher body mass index,
while also preferring foods higher in fat, sugar, and salt at the expense of protein. The
resultant hyperphagia in the female rats was associated with decreased energy expenditure
and increased body fat stores, but no difference in number of offspring. Once the high fat,
sugary diets were removed, the rats had a reduced intake similar to control rats.
Nutrient content on taste
The nutrient content of plants changes throughout the day with increasing exposure to
sunlight, altering animal preference. Goats and sheep have a preference for hays harvested in
the PM over hays cut in the AM; PM hays have a higher concentration in soluble
carbohydrate in the plants was at the expense of neutral detergent fiber (NDF). PM harvested
gamagrass (Tripsacum dactyloides L.) had higher monosaccharides, polysaccharides, total nonstructural carbohydrates, and less NDF, with no change in starch or crude protein
compared to AM cut hay (Sauve et al., 2009). This selection for carbohydrate may not be for
energy, but rather the taste of the simple sugars.
When lambs were used to compare preference for hay from AM and PM cuttings with
or without added 0.45% DM glucose and 0.35% DM sucrose, lambs preferred the PM cut
hay; however, there was no preference for AM hay with sucrose and glucose over AM hay
alone (Buritt et al., 2005). When lambs were offered AM hay or AM hay with 1% DM added
sugar (1:1 glucose:sucrose), there was no preference for one over the other. When offered
AM hay versus AM with 2% DM, AM with 3% DM, or AM with 4% DM, the sheep had
preferences for the added sugar hays after the first two days of the preference test.
When glyphosate herbicide was sprayed onto annual ryegrass-silver grass pasture to
delay nutrient content loss from the forage, preference in sheep was altered (Siever-Kelly et
al., 1999). Herbage composition was altered where stems increased two-fold in water soluble
carbohydrate content and had a smaller increase in water soluble carbohydrates in leaf and
seed heads. Sheep preferred herbicide-sprayed forage over control and preferred stem over
leaf in the sprayed forage. In the control, sheep preferred leaf or seed head rather than stem.
Preference was for higher water soluble carbohydrate content and higher digestible plant
components were chosen only when water soluble carbohydrates were the same.
With the change in fiber content of forages affecting preference (Burns et al., 2007;
taste is not a main focus (Catanese et al., 2010). Early exposure of low quality forages (high
NDF) resulted in lambs preferring more high quality forage compared to lambs that had
experience with the high quality forage. Lambs with early exposure to the high quality forage
(low NDF) had higher intakes of the low quality forage compared to lambs previously fed the
low quality forage.
Rodents, birds, fish, insects, and some monkeys have a strong preference for high
protein feeds, and when feeds are low in protein, will over-consume feeds high in energy to
meet their protein requirements (Brooks et al., 2010). This overconsumption of energy may
be a leading cause of obesity in some species.
Infants consuming different types of formula have different preferences for foods
later in life (Mennella and Beauchamp, 2002). Sour-flavored juices were preferred by infants
that consumed protein hydrolysates, while those fed soy formulas preferred bitter-flavored
juice. Children fed milk based formulas demonstrated more negative behaviors later in
childhood when given sour or bitter foods.
Scott and Provenza (1998) examined the effect of flavor and nutrient content of diets
given to sheep at different locations. Sheep had no preference for flavor (apple, aniseed,
unflavored) when the diets being compared differed in composition; however, when the basal
diet was the same, lambs went to the feeding location that had a variety of flavors. Thus,
nutrient content of the forage may be the primary reason for food selection with taste being
of secondary importance.
When lambs were given preference tests for three feeds varying in nutrient content,
LiCl was added to the hay to create an aversive stimulus, the lambs still consumed the high
energy diet but in a smaller amount. This aversion did not influence the intake of the other
hays most likely because the lambs were familiar with the hay. If this were a novel hay with
LiCl, then lambs may have avoided the feed altogether. When given all three feeds, intake of
digestible energy and digestible protein was higher. The lambs may have lost interest in the
feed they were consuming and wanted variety based on post-ingestive feedback or sensory
input like taste and odor.
Post-ingestive feedback
The degree to which an animal continues to eat a certain food is based on
sensory-specific satiety and nutrient-sensory-specific satiety (Early and Provenza, 1998). After exposure to
one flavor for a short amount of time, the animal preferred a different flavor; however, lambs
avoided feeds that were deficient or in excess of energy when an adequate diet was available.
The feedback the animal receives after eating a food helps regulate the taste with metabolic
homeostasis. When heifers were given preference tests for maple-flavored or
coconut-flavored hays, heifers preferred the opposite flavor in the preference test from what they had
been previously fed (Atwood et al., 2001). The previous experience with the flavored hays
influenced the future preference for the cattle to choose a different flavored hay of similar
nutritive value.
The digestibility of feed can also affect post-ingestive feedback affecting animal
preference (Early and Provenza, 1998). When lambs were fed in the morning with highly
preferring different flavored feed from the morning. However, when lambs were fed in the
morning with a slowly digestible feed, they continued to prefer the same in the evening, with
no difference in flavor preference.
Mothers that consume alcohol during breast-feeding will give their child ethanol in
the milk (Mennella and Beauchamp, 1991). The odor and the taste of the milk are altered for
several hours with a peak ethanol taste around one hour after consumption of alcohol. Infants
have decreased intake when breastfeeding milk after the mother consumed alcohol and the
long-term effects are unknown of an infant consuming alcohol. Infants are limited in their
ability to oxidize ethanol and remove the alcohol from their body.
Aversive feeds may cause nausea or vomiting and result in negative post-ingestive
feedback (Launchbaugh et al., 2001). Post-ingestive feedback can alter preference based on
the intensity of the feedback (Figure 1.3). Animals learn through the post-ingestive feedback
to avoid feeds or continue to consume them for nutritional value (Villalba and Provenza,
2009). When lambs were given a familiar food along with a novel odor followed by LiCl to
mimic toxicosis, the lambs given the LiCl consumed less food than those not given the LiCl
(Provenza et al., 2000). Novel odors that may appear to be aversive to humans may not affect
intake in lambs when no negative post-ingestive feedback occurs.
Adding flavors to mimic different tastes can alter intake for feeds (Grovum and
Chapman, 1988). The intensity of the taste can alter the preference for the given feed. When
pellets were sham-fed and preference measured with esophageal fistulas, the highest level of
sucrose (120g sucrose/ kg pellet) depressed feed intake in sheep. Adding urea to the pellets
addition of HCl for a sour taste only lowered intake at the highest concentration tested (50 g
HCl/ kg pellet). Monosodium glutamate for umami and NaCl for salty both increased intake
when added to feed. By removing the post-ingestive feedback of feeds, preference can be
altered.
When rats were given either 0.05% citric acid (sour) or 0.03% sucrose octaacetate
(bitter) solutions with intragastric infusions of 16% glucose, rats preferred the solution with
glucose rather than the opposing solution with a water infusion (Myers and Sclafani, 2003).
When rats were given a neutral flavor with 2% sucrose and a different flavor with 2%
maltodextrin, both were preferred over another non-flavored feed (Dwyer, 2005). When
paired with illness, neither flavor was preferred.
When intensities of flavors were varied in combination with intragastric infusions of
starch in lambs, lambs preferred the flavor intensity associated with the higher infusion of
starch (Villalba and Provenza, 2000). Inexperienced lambs were then used that had no prior
exposure to the starch infusion or the onion taste. Lambs preferred the weakest 5g/kg hay
onion flavor over the 40g/kg onion flavor; however, they preferred the moderate 10g/kg and
20g/kg onion flavors over the weaker 5g/kg and stronger 50g/kg. Thus, strong flavor
intensities may be more aversive in influencing preference, allowing grazing animals to alter
their food choices to that of more moderate flavor intensities.
Eating rates
Taste is not the only factor that affects whether a food is chosen for consumption or
When rats are only given one feed that is less palatable than a normal rat chow, such as citric
acid flavored rat chow, meal size is reduced and consumed at a slower rate (Johnson and
Collier, 2001). Rats consumed more plain pellets when compared with 4% citric acid pellets,
but had no difference in intake when plain were tested with saccharin pellets.
When dairy cows were observed with eating rates of concentrates flavored to taste
sweet, salty, or bitter, the cows had faster eating rates when fed a sweet concentrate (Chiy
and Phillips, 1999). No difference was seen in the first minute of eating from the prehension
of feed; however, after the first minute, eating rates declined for the salty and bitter
concentrates.
Horses were given 15 different flavors added to cereal grain by-products to determine
preference and intake rate (Goodwin et al., 2005). Echinacea, nutmeg, and coriander were
three flavors previously suggested to be added to equine diets to enhance flavor but were
aversive to several horses. The flavors that had the highest preference determined by fastest
intake rate were banana, cherry, carrot, rosemary, oregano, peppermint, cumin, and
fenugreek. When banana and fenugreek were used to mask a mineral supplement, both
flavors increased the time of consumption for the mineral.
Total Intake
If animals are unable to consume sufficient nutrients to meet their requirements, body
energy stores are mobilized for energy depending on physiological state. During gestation,
restricting intake can be beneficial to prevent excessive weight gain in the sow (Musser et al.,
nitrogen and IGF-1 in sows with ad libitum intake. Insulin can also be elevated during early
gestation. Excessive intake results in changes in fetal composition with increased liver size
and potential problems during parturition.
Hormonal factors of intake
Many hormones interact to signal hunger or satiation in animals. These hormones are
considered to be anorexigenic or orexigenic. Anorexigenic hormones that decrease intake and
increase satiety include leptin, cholecystokinin (CCK), glucagon, melanocyte stimulating
hormone (MSH), and oxyntomodulin. Orexigenic hormones that stimulate intake are ghrelin
and Neuropeptide Y (NPY).
Leptin is an anorexigenic hormone with many functions other than for feed intake in
ruminants (Nonaka et al., 2006). Leptin is secreted from many tissues other than adipose
tissue and is stimulatory towards GH secretion in sheep. Leptin secretion will also stimulate
MSH secretion, while decreasing activity of NPY (Kojima et al., 2010). CCK has been
shown to be one of the more potent anorexigenic hormones leading to decreased food
consumption. CCK reduced the rate of feed intake in sheep when given ICV (Bueno and
Riviere, 1987). CCK is a brain-gut peptide that decreases meal size and duration leading to
early satiety in the rat (Moran, 2000). The hormone is most abundant in the duodenum and
jejunum. CCK also works synergistically with leptin to decrease intake. Various peptide
lengths for CCK occur in different species and differ in potency (Glatzle et al, 2008).
Melanocyte stimulating hormone has decreased intake in several species of animals
rapid decrease of food consumption (Smith et al., 2008). Glucagon has been shown to induce
satiety in rats as well (Heppner et al., 2010). GLP-1 has been shown to decrease food intake
in humans and rodents (Heijboer et al., 2006). GLP-2 has similar effects in rats as GLP-1;
however, no effect was seen in humans. Oxyntomodulin is similar to GLP 1 and 2 and has
been seen to decrease feed intake in both rats and humans. Oxyntomodulin can decrease
plasma ghrelin, while stimulating insulin secretion and glucose production, along with
increasing activity-related energy expenditure in humans (Heijboer et al., 2006; Wynne et al.,
2006).
Ghrelin is stimulatory towards feed intake and peaks before meal periods (Reynolds
et al., 2010; Sauve et al., 2010). Ghrelin concentrations decrease after feeding. Ghrelin can
stimulate feed intake when administered peripherally (Heijboer et al., 2006). NPY is an
orexigenic hormone leading to increased feed intake (Kojima et al., 2010). Agouti related
protein has also been demonstrated to have orexigenic effects in rodents similar to NPY
during fasting (Heijboer et al., 2006).
Most of the anorexigenic hormones are secreted postprandially to decrease feed
intake. Each hormone may stimulate several neurons in the brain due to satiety factors. There
appear to be many more satiety hormones that decrease feed intake than there are that
stimulate feed intake. Feed intake may be influenced by many other factors other than
hormones.
Wethers fed a high salt diet had reduced intake from the decreased palatability of a
20% salt dry matter diet (Blache et al., 2007). Plasma leptin and insulin concentrations
decreased in wethers fed the high salt diet, with plasma glucose declining as well. When rats
were given rat chow and water with sucrose, glucose, or fructose, rats had increased caloric
consumption over those given rat chow and water, yet depressed rat chow intake (Lindqvist
et al., 2008). The caloric intake from the liquid was designed to mimic soft drink
consumption in humans, while finding this increased caloric intake altered normal hormonal
feedback. Consuming any of the sugar solutions resulted in increased serum leptin
concentrations, while decreasing serum PYY and hypothalamic NPY mRNA; however,
serum ghrelin concentration increased with fructose consumption. Consuming foods that
produce a hedonic response from sweet taste, intake regulation may be altered and cause
increased feed consumption which may be undesirable.
When monosodium glutamate was fed to men to enhance the umami taste of a high
protein diet, passage rate through the stomach was increased (Zai et al., 2009). The increased
gastric emptying may be a result of taste receptors along the digestive tract that lead to
increased gastric excretions altering passage rate of ingesta. When taste was evaluated in
humans to compare salivary flow, taste receptors appear to have an influence (Hodson and
Linden, 2006). Citric acid, monosodium glutamate, and NaCl all had higher salivary flow
rates, possibly relating to the taste receptors from transfer of ions across the membrane rather
than through G-coupled protein receptors.
Hormone receptors may also be found in the taste tissues of animals, at least in mice
affecting the response to sweet tastes. This decreased response to both sucrose and saccharin
did not alter the taste sensitivity for sour, salty, or bitter food by leptin. The leptin
administration altered biochemical pathways in the taste cells affecting potassium ions and
changing the polarization of the cells. Intestinal absorption of galactose was inhibited by
leptin in rats (Inigo et al., 2007). Leptin prevented sugar absorption by the SGLT1 transporter
but did not affect intestinal permeability.
In obese and lean humans, Brondel et al. (2007) found no difference in flavor
pleasure between the groups. Therefore, obese individuals may have lost the ability for taste
sensitivity with sweet foods. Obesity does appear to have a role in preference for
monosodium glutamate or umami taste in obese women, where obese women have lower
taste sensitivity and consume higher concentrations of monosodium glutamate to receive the
same benefit (Pepino et al., 2010).
Measuring and estimating intake
Markers are frequently used in animals to look at intake, digestibility, and rate of
passage. When using markers, dosing time and the flow of the digesta are all important
factors in evaluating the use of the marker with the respective animal and diet (Olivan et al.,
2007). All markers come with potential errors and each marker should be evaluated to
determine which is most appropriate. Sources of errors include delivery of marker, feed
consumed, fecal excretion patterns, and analytical measurements (Ferreira et al., 2004).
Common markers include chromic oxide, alkaline peroxide lignin, acid detergent lignin, and
detergent fiber and in vitro neutral detergent fiber do not make good internal markers due to
high variation in fresh and immature forages due to high variability in marker ratios (Cochran
et al., 1986). Concerns with chromic oxide as a marker have been the diurnal variation of
passage of the marker (Momont et al., 1994). A desirable marker for intake would have a
steady rate of passage and be indigestible. In grazing animals, collecting total feces may not
be the best method of estimating intake due to interfering with natural grazing behaviors, so
fecal grab samples may be more suitable, where alkanes could be used (Duncan et al., 1999).
Alkanes
Alkanes are mostly indigestible and excreted in the feces of animals (Duncan et al.,
1999; Dove and Mayes, 1996). The alkanes are consumed and pass through the digestive
tract of animals at a consistent rate in comparison to other external markers such as chromic
oxide that may bind to digesta (Ferreira et al., 2004). Odd-chain alkanes naturally accumulate
in plants and concentrations vary depending on species, while even-chain alkanes are rare in
plants (Premaratne et al., 2005). Concentrations of alkanes are also variable in the part of
plant that may be consumed (Dove et al., 1996). Although some of the shorter chain alkanes
have lower fecal recovery rates, alkanes absent from the feed can be dosed to correct for
recovery rates for intake calculations.
Alkanes can thus be used to estimate the intake of herbivorous species by measuring
the alkanes in the plants consumed and the alkanes in the feces. For ruminants, adjacent
alkanes are required to have an accurate estimate of intake (Ferreira et al., 2007), while in
This difference is noted because the fecal recovery of the short and long chain alkanes is
similar in horses, while more variation is seen in cattle due to chain length (Smith et al.,
2007).
One method of administering even-chain alkanes was with an intra-ruminal
controlled-released capsule (CRC); however, use of CRC’s is decreasing due to the remnant
cartridge left in the rumen of ruminants (Premaratne et al., 2005; Molina et al., 2004; Elwert
et al., 2008) and lack of commercial supply. The manufacturer provides an expected release
rate for the alkanes in the CRC for calculations; however, researchers should determine the
release rate themselves to calculate the most accurate estimate of intake (Ferreira et al.,
2004). Release rates can be calculated in fistulated cattle with calipers to determine the
amount of capsule remaining. Alkane release from CRC’s may be inaccurate when trying to
use manufacturer’s release rate and variation can over- or under-estimate intake (Charmley et
al., 2003). When using a CRC, feeding frequency, use of multiple CRC’s, or level of feeding
do not alter the accuracy of intake estimation (Dove et al., 2002).
A second method of administration is through a dietary supplement. Dosing can be
done once daily by spraying even-chain alkanes on paper (Ferreira et al., 2007; Olivan et al.,
2007; Hameleers and Mayes, 1998), grass (Stevens et al., 2002), gelatin capsule (Molina et
al., 2004), or cottonseed meal (Dove and Charmley, 2008). In horses, due to the lack of a
rumen and higher passage rate in the stomach, horses should be dosed two times a day with
the even-chain alkane (Smith et al., 2007). Feeding a supplement may be the most desirable
method of administering the even-chain alkanes because it is less invasive than other
animal in comparison to feeding a less invasive dietary supplement. Feeding a supplement
also increases the familiarity of animals to humans.
Fecal and feed samples must be collected to be analyzed for intake and output of
alkanes as markers. Alkanes are provided by the CRC or supplement for several days to
allow equilibration of the alkanes in the digestive tract before fecal samples are be collected
for analyses. Horses and cattle should be fed even-chain alkanes for a minimum of seven
days (Ferreira et al., 2007; Ferreira et al., 2004). There are no known diurnal patterns of
excretion in ruminants for alkanes in the feces of cattle (Olivan et al., 2007); however,
increased fecal sampling in horses can eliminate the variability in fecal alkane excretion
(Smith et al., 2007). The digestive tract of the horse does not appear to have the same amount
of mixing of digesta in the stomach, compared to the rumen of ruminants, allowing for an
inconsistent flow of alkanes through the remainder of the gastrointestinal tract. Total fecal
collection can be used to estimate intake with alkanes, but is very labor intensive and less
feasible for grazing animals. Once daily fecal grab samples can provide an accurate estimate
if the feces are pooled over a minimum of five days in horses (Smith et al., 2007). Fecal grab
sampling can also be used for cattle using less labor and provide similar results to total fecal
collection (Ferreira et al., 2004).
Fecal concentrations of alkanes can be used with known plant alkane concentrations
to determine the amount of each forage consumed (Charmley and Dove, 2007). Depending
on the number of species of plants the animal is eating, multivariate analysis can be used to
determine the species and part of the plant the animal consumed (Dove et al., 1996). Lower
equation, so alkane pairs with higher concentrations determined after analysis should be used
(Olivan et al., 2007). Intake is usually estimated with the C32:C33 or C31:C32 pair for
accuracy due to the similarity in alkane fecal recoveries (Ferreira et al., 2004).
Alkane analysis
The analysis of samples requires two steps: saponification and extraction.
Tetratriacontane (C34) is typically used as an internal standard and may be used in
conjunction with another alkane, such as docosane (C22), for the saponification and
extraction procedures to avoid over- or underestimation of alkane concentrations (Ferreira et
al., 2007; Olivan and Osoro, 1999).
Fecal and feed samples are freeze-dried and ground through a 1mm screen. Samples
are then weighed and saponified with 1 M ethanolic KOH at 90 °C for several hours. Alkanes
are then extracted with heptane or hexane, taken over a silica gel column, and the eluate
collected and analyzed with gas chromatography (Olivan et al., 2007). Gas chromatography
is then used to analyze peaks of alkanes of interest for all samples in comparison with known
standards.
Fecal recovery, or indigestibility, of the alkanes from the extraction process needs to
be similar in order for the estimation equation to be effective. Extraction must occur at hot
temperatures (65 °C) or the alkanes will not be transferred in the heptane layer (Olivan and
Osoro, 1999). Alkane extraction can vary greatly with chain length at different temperatures
drying of feed and feces may also alter the natural alkane concentrations and oven-drying
may decrease the true amount (Sandberg, 2000; Elwert et al., 2006).
Estimation of intake
Dry matter intake can be calculated with several equations modified from Mayes et
al. (1986). The following is from Charmley et al. (2003):
DMI = Dj/((Fj/Fi) * Hi – Hj)
where H denotes the feed and F the feces, and i and j represent the odd and even alkane
concentrations respectively. Dj denotes the release rate of the even chain alkane from the
CRC.
Another modified equation from Stefanon et al. (1999) is
DMI= ((Fi/Fj) * ((Dj + S*Sj)-S*Si) / (Hi- (Fi/Fj) *Hj)
where H , F and S denote the feed, feces, and supplement respectively, i and f represent the
odd and even alkane concentrations, Dj is the even chain alkane from a CRC, if given, and S
is the amount of supplement fed. Dj is removed from the equation for horses, while may be
used in ruminants if the supplement is not dosed with additional alkanes.
Changes in the fecal ratios will influence DMI. Based on the previous two formulas,
the fecal ratio is of most importance, because the supplement and forage compositions would
remain consistent for the feedstuffs. Variations of alkanes higher in concentration have less
impact on the final estimate than variations of alkanes in lower concentrations. When
external marker was dosed at 224 mg per animal, there was no difference in twice or thrice
even-chain marker, the marker had high variation in feces when given twice daily compared
to thrice daily dosing.
Dry Matter Digestibility
Dry matter digestibility (DMD) can be calculated for animals to have an estimate on
how well feed is digested in vivo. Simple equations for DMD can be 1- (fecal output/intake),
which is the same as 1-indigestibility (Olivan et al., 2007). Different feeds are going to have
different digestibilities based on the composition of the plant material. Higher cellulose and
lignin will be less digestible in both ruminants and horses. Digestibility can be calculated
using alkanes, where feeding level does not affect the outcome (Charmley et al., 2003).
Digestibility is calculated based on the known intake of alkanes and the alkanes excreted,
where the fecal recovery is known.
Summary
Alkanes have been used mainly in sheep and cattle to estimate forage intake and
estimate digestibility; however, most researchers extrapolate that alkanes can be used in
grazing animals consuming multiple forages, yet little research has been completed. Most
researchers use fresh cut forages given to sheep individually housed and lack the realistic
differences seen in groups of animals grazing. Alkanes can accurately estimate intake using
the internal marker and externally dosed marker in hay fed sheep, cattle, and horses.
Although we have markers to estimate intake of animals, we do not fully understand
Palatability is a driving factor, but the influence of nutrient composition of feeds may also be
a major influence. Taste has become a prime area of research because of the strong influence
on palatability and associated post-ingestive feedback. With volatile compounds crossing
through the mother’s blood and into the amniotic fluid, flavors have been added to sheep and
swine diets to influence sheep and pig weanling intakes. Although most flavors have no
nutritional benefit, a comparison between the nutritional and non-nutritional feed additives
Literature Cited
Atwood, S. B., F. D. Provenza, R. D. Wiedmeier, and R. E. Banner. 2001. Changes in preferences of gestating heifers fed untreated or ammoniated straw in different flavors. J. Anim. Sci. 79:3027-3033.
Bayol, S. A., S. J. Farrington, and N. C. Stickland. 2007. A maternal ‘junk food’ diet in pregnancy and lactation promotes an exacerbated taste for ‘junk food’ and a greater propensity for obesity in rat offspring. Br. J. Nutr. 98:843-851.
Blache, D., M. J. Grandison, D. G. Masters, R. A. Dynes, M. A. Blackberry, and G. B. Martin. 2007. Relationships between metabolic endocrine systems and voluntary feed intake in merino sheep fed a high salt diet. Aust. J. Expt. Agric. 47:544-550.
Brondel, L., M. Romer, V. Van Wymelbeke, P. Walla, T. Jiang, L. Deecke, and D. Rigaud. 2007. Sensory-specific satiety with simple foods in humans: no influence of BMI? Int. J. Obesity. 31:987-995.
Brooks, R. C., S. J. Simpson, and D. Raubenheimer. 2010. The price of protein: combining evolutionary and economic analysis to understand excessive energy consumption. Obesity rev. 11:887-894.
Bueno, L. and P. Riviere. 1987. Control of ingestive behavior and rumination by neuropeptides. Reprod. Nutr. Dev. 27:157-169.
Burns, J. C., D. S. Fischer, and H. F. Mayland. 2007. Diurnal shifts in nutritive value of alfalfa harvested as hay and evaluated by animal intake and digestion. Crop Sci. 47:2190-2197.
Burrit, E. A., H. F. Mayland, F. D. Provenza, R. L. Miller, and J. C. Burns. Effect of added sugar on preference and intake by sheep of hay cut in the morning versus the afternoon. Appl. Anim. Behav. Sci. 94:245-254.
Catanese, F., R. A. Distel, R. M. Rodriguez Iglesias, and J. J. Villalba. 2010. Role of early experience in the development of preference for low-quality food in sheep. Animal. 45:784-791.
Charmley, E., D. R. Ouellet, D. M. Veira, R. Michaud, J. L. Duynisveld, and H. V. Petit. 2003. Estimation of intake and digestibility of silage by beef steers using a controlled release capsule of n-alkanes. Can. J. Anim. Sci. 83:761-768.
Cochran, R. C., D. C. Adams, J. D. Wallace, and M. L. Galyean. 1986. Predicting
digestibility of different diets with internal markers: evaluation of four potential markers. J. Anim. Sci. 63:1476-1483.
Desor, J. A., O. Maller, and K. Andrews. 1975. Ingestive responses of human newborns to salty, sour, and bitter stimuli. J. Comp. Physiol. Psychol. 89:966-970.
Dove, H., and R. W. Mayes. 1996. Plant wax components: a new approach to estimating intake and diet composition in herbivores. J. Nutr. 126:13-26.
Dove, H. R. W. Mayes, and M. Freer. 1996. Effects of species, plant part, and plant age on the n-alkane concentrations in the cuticular wax of pasture plants. Aust. J. Agric. Res. 47:1333-1347.
Dove, H, R. W. Mayes, C. S. Lamb, and K. J. Ellis. 2002. Factors influencing the release rate of alkanes from an intra-ruminal, controlled-release device, and the resultant accuracy of intake estimation in sheep. Aust. J. Agric. Res. 53:681-696.
Duncan, A. J., R. W. Mayes, C. S. Lamb, S. A. Young, and I. Castillo. 1999. The use of naturally occurring and artificially applied n-alkanes for estimation of short-term diet composition and intake in sheep. J. Agric. Sci. 132:233-246.
Dwyer, D. M. 2005. Reinforcer devaluation in palatability-based learned flavor preferences. J. Exp. Psychol. 31:487-492.
Early, D. M. and F. D. Provenza. 1998. Food flavor and nutritional characteristics alter dynamics of food preference in lambs. J. Anim. Sci. 76:728-734.
El-Haddad, M. A., Y. Jia, and M. G. Ross. 2005. Persistant sucrose stimulation of ovine fetal ingestion: lack of adaptation responses. J. Materna-Fetal and Neonatal Med. 18:123-127.
Elwert, C., H. Dove, and M. Rodehutscord. 2006. Effect of roughage species consumed on fecal alkane recovery in sheep, and effect of sample drying treatment on alkane
concentrations. Aust. J. Exp. Agric. 46:771-776.
Elwert, C., H. Dove, and M. Rodehutscord. 2008. Faecal alkane recoveries from multi-component diets and effects on estimates of diet composition in sheep. Animal. 2:125-134.
Ferreira, L. M. M., U. Garcia, M. A. M. Rodrigues, R. Celaya, A. Dias-da-Silva, and K. Osoro. 2007. Estimation of feed intake and apparent digestibility of equines and cattle
Ferreira, L. M. M., M. Olivan, M. A. M. Rodrigues, K. Osoro, H. Dove, and A. Dias-da-Silva. 2004. Estimation of feed intake by cattle using controlled-release capsules containing n-alkanes or chromium sequioxide. J. Agric. Sci. 142:225-234.
Fisher, D. S., J. C. Burns, and H. F. Mayland. 2005. Ruminant selection among switchgrass hays cut at either sundown or sunup. Crop Sci. 45:1394-1402.
Frank, G. K. W., T. A. Oberndorfer, A. N. Simmons, M. P. Paulus, J. L. Fudge, T. T. Yang, and W. H. Kaye. 2008. Sucrose activates human taste pathways differently from artificial sweetner. Neuroimage. 39:1559-1569.
Glatzle, J. H. E. Raybould, M. A. Kueper, J. R. Reeve Jr., and T. T. Zittel. Cholecystokinin-58 is more potent in inhibiting food intake than cholecystokinin-8 in rats. Nutritional Neuroscience. 11:69-74.
Goodwin, D., H. P. B. Davidson, and P. Harris. 2005. Selection and acceptance of flavours in concentrate diets for stabled horses. Appl. Anim. Behav. Sci. 95:223-232.
Grovum, W. L. and H. W. Chapman. 1988. Factors affecting the voluntary intake of food by sheep 4. The effect of additives representing the primary tastes on sham intakes by
oesophageal-fistulated sheep. Br. J. Nutr. 59:63-72.
Hameleer, A. and R. W. Mayes. 1998. The use of n-alkanes to estimate herbage intake and diet composition by dairy cows offered a perennial ryegrass/white clover mixture. Grass and Forage Science. 53:164-169.
Hausner, H., W. L. P. Bredie, C. Molgaard, M. A. Peterson, and P. Moller. 2008. Differential transfer of dietary flavour compounds into human breast milk. Phys. & Behav. 95:118-124.
Havermans, R. C., N. Geschwind, S. Filla, C. Nederkoorn, and A. Jansen. 2009. Sensory-specific satiety is unaffected by manipulations of flavour intensity. Physiol. Behav. 97:327-333.
Heijboer, A. C., H. Pijl, A. M. van den Hoek, L. M. Havekes, J. A. Romijn, and E. P. M. van der Kleij-Corssmit. 2006. Gut-brain axis: regulation of glucose metabolism. J.
Neuroendocrin. 18:883-894.
Heppner, K. M., K. M. Habegger, J. Day, P. T. Pfluger, D. Perez-Tilve, B. Ward, V.
Gelfanov, S. C. Woods, R. DiMarchi, and M. Tschop. 2010. Glucagon regulation of energy metabolism. Physiol. Behav. 100:545-548.
Hodsen, N. A. and R. W. A. Linden. 2006. The effect of monosodium glutamate on parotid salivary flow in comparison to the response to representatives of the other four basic tastes. Phyiol. Behav. 89:711-717.
Hosley, M. A., S. E. Hughes, L. L. Morton, and B. Oakley. 1987. A sensitive period for the neural induction of taste buds. J. Neuroscience. 7:2075-2080.
Huang, Y. A., Y. Maruyama, R. Stimac, and S. D. Roper. 2008. Presynaptic (Type III) cells in mouse taste buds sense sour (acid) taste. J. Physiol. 586:2903-2912.
Inigo, C., N. Patel, G. L. Kellett, A. Barber, and M. P. Lostao. 2007. Luminal leptin inhibits intestinal sugar absorption in vivo. Acta. Physiol. 190:303-310.
Johnson, D. F. and G. Collier. 2001. Taste, intake rate, and food choice in rats. Physiol. Behav. 72:37-44.
Kawai, K., K. Sugimoto, K. Nakashima, H. Miura, and Y. Ninomiya. 2000. Leptin as a modulator of sweet taste sensitivities in mice. Proc. Natl. Acad. Sci. 97:11044-11049.
King, R. H. 1979. The effect of adding a feed flavour to the diets of young pigs before and after weaning. Aust. J. Exp. Agric. Anim. Husb. 19:695-697.
Kojima, K., N. Amiya, M. Kamijo, H. Kageyama, M. Uchiyama, S. Shioda, and K. Matsuda. 2010. Relationship between α-melanocyte-stimulating hormone- and neuropeptide
Y-containing neurons in the goldfish hypothalamus. General and Comparative Endocrinology 167:366-372.
Langendijk, P., J. E. Bolhuis, and B. F. A. Laurenssen. 2007. Effects of pre- and postnatal exposure to garlic and aniseed flavour on pre- and postweaning feed intake in pigs. Livestock Science. 108:284-287.
Launchbaugh, K. L., F. D. Provenza, and J. A. Pfister. 2001. Herbivore response to anti-quality factors in forages. J. Range Manage. 54:431-440.
Lindqvist, A, A. Baelemans, and C. Erlanson-Albertsson. 2008. Effects of sucrose, glucose and fructose on peripheral and central appetite signals. Regul. Peptides. 150:26-32.
Mayes, R. W., C. S. Lamb, and P. M. Colgrove. 1986. The use of dosed and herbage n-alkanes as markers for the determination of herbage intake. J. Agric. Sci. 107:161-170.
Molina D. O., I. Matamoros, and A. N. Pell. 2004. Accuracy of estimates of herbage intake of lactating cows using alkanes: comparison of two types of capsules. Animal Feed Science and Technology. 114:241-260.
Mombaerts, P. 2004. Genes and ligands for odorant, vomeronasal and taste receptors. Nature Rev. 5:263-278.
Momont, P. A., R. J. Pruitt, R. J. Emerick, and R. H. Pritchard. 1994. Controlled release chromic oxide and alkaline peroxide lignin marker methods. J. Range. Manage. 47:418-423.
Moran, T. H. 2000. Cholecystokinin and satiety: current perspectives. Nutr. 16:858-865.
Mennella, J. A. and G. K. Beauchamp. 1991. The transfer of alcohol to human milk: effects on flavor and the infant’s behavior. N. Engl. J. Med. 325:981-985.
Mennella, J. A. and G. K. Beauchamp. 2002. Flavor experiences during formula feeding are related to preferences during childhood. Early Human Dev. 68:71-82.
Mennella, J. A., C. P. Jagnow, and G. K. Beauchamp. 2001. Prenatal and postnatal flavor learning by human infants. Pediatrics. 107:1-6.
Mennella, J. A., A. Johnson, and G. K. Beauchamp. 1995. Garlic ingestion by pregnant women alters the odor of amniotic fluid. Chem. Senses. 20:207-209.
Morrow-Tesch, J. and J. J. McGlone. 1990. Sources of maternal odors and the development of odor preferences in baby pigs. J. Anim. Sci. 68:3563-3571.
Musser, R. E., D. L. Davis, S. S. Dritz, M. D. Tokach, J. L. Nelssen, J. E. Minton, and R. D. Goodband. 2004. Conceptus and maternal responses to increased feed intake during early gestation in pigs. J. Anim. Sci. 82:3154-3161.
Myers, K. P. and A. Sclafani. 2003. Conditioned acceptance and preference but not altered taste reactivity responses to bitter and sour flavors paired with intragastric glucose infusion. Physiol. Behav. 78:173-183.
Nonaka, S., T. Hashizume, and E. Kasuya. 2006. Effects of intracerebroventricular injections of leptin on the release of luteinizing hormone and growth hormone in castrated calves. Anim. Sci. J. 77:196-200.
Olivan, M., L. M. M. Ferreira, R. Celaya, and K. Osoro. 2007. Accuracy of the n-alkane technique for intake estimates in beef cattle using different sampling procedures and feeding levels. Livestock Science. 106:28-40.
Olivan, M. and K. Osoro. 1999. Effect of temperature on alkane extraction from faeces and herbage. J. Agric. Sci. 132:305-312.
Oostindjer, M., J. E. Bolhuis, H. van den Brand, and B. Kemp. 2009. Prenatal flavor exposure affects flavor recognition and stress-related behavior of piglets. Chem. Senses. 34:775-787.
Oostindjer, M., J. E. Bolhuis, H. van den Brand, E. Roura, and B. Kemp. 2010. Prenatal flavor exposure affects growth, health and behavior of newly weaned piglets. Physiol. Behav. 99:579-586.
Ordakowski, A. L., D. S. Kronfeld, J. L. Holland, B. J. Hargreaves, L. S. Gay, P. A. Harris, H. Dove, and D. Sklan. 2001. Alkanes as internal markers to estimate digestibility of hay or hay plus concentrate diets in horses. J. Anim. Sci. 79:1516-1522.
Pepino, M. Y., S. Finkbeiner, G. K. Beauchamp, and J. A. Mennella. 2010. Obese women have lower monosodium glutamate taste sensitivity and prefer higher concentrations than do normal-weight women. Obesity. 18:959-965.
Premaratne S., J. P. Fontenot, and R. K. Shanklin. 2005. Use of N-alkanes to estimate intake and digestibility by beef steers. Asian-Aust. J. Anim. Sci. 18:1564-1568.
Provenza, F. D., B. A. Kimball, and J. J. Villalba. 2000. Roles of odor, taste, and toxicity in the food preferences of lambs: implications for mimicry in plants. Oikos. 88:424-432.
Provenza, F. D., C. B. Scott, T. S. Phy, and J. J. Lynch. 1996. Preference of sheep for foods varying in flavors and nutrients. J. Anim. Sci. 74:2355-2361.
Ren, X., J. G. Ferreira, L. Zhou, S. J. Shammah-Lagnado, C. W. Yeckel, and I. E. de Araujo. 2010. J. Neuroscience. 30:8012-8023.
Sandberg, R. E., D. C. Adams, T. J. Klopfenstein, and R. J. Grant. 2000. N-alkane as an internal marker for predicting digestibility of forages. J. Range Manage. 53:159-163.
Sauve, A. K., G. B. Huntington, and J. C. Burns. 2009. Effects of total nonstructural carbohydrates and nitrogen balance on voluntary intake of goats and digestibility of gamagrass hay harvested at sunrise and sunset. Anim. Feed Sci. Tech. 148:93-106.
Sauve, A. K., G. B. Huntington, C. S. Whisnant, and J. C. Burns. 2010. Intake, digestibility, and nitrogen balance of steers fed gamagrass baleage topdressed at two rates of nitrogen and harvested at sunset and sunrise. Crop Sci. 50:427-437.
Schaal, B., L. Marlier, and R. Soussignan. 2000. Human foetuses learn odours from their pregnant mother’s diet. Chem. Senses. 25:729-737.
Scott, L. L. and F. D. Provenza. 1998. Variety of foods and flavors affects selection of foraging location by sheep. Appl. Anim. Behav. Sci. 61:113-122.
Shi, P. and J. Zhang. 2006. Contrasting modes of evolution between vertebrate sweet/umami receptor genes and bitter receptor genes. Mol. Biol. Evol. 23:292-300.
Siever-Kelly, C., B. J. Leury, K. L. Gatford, R. J. Simpson, and H. Dove. 1999. Spray-topping annual grass pasture with glyphosate to delay loss of feeding value during summer. II. Herbage intake, digestibility, and diet selection in penned sheep. Aust. J. Agric. Res. 50:465-474.
Silveira, P. P., A. K. Portella, S. A. C. N. Assis, F. B Nieto, L. A. Diehl, L. M. Crema, W. Peres, G. Costa, C. Scorza, J. A. Quillfeldt, A. B. Lucion, and C. Dalmaz. 2010. Early life experience alters behavioral responses to sweet food and accumbal dopamine metabolism. Int. J. Devl. Neuroscience. 28:111-118.
Simpson, S. J., R. M. Sibly, K. P. Lee, S. T. Behmer, and D. Raubenheimer. 2004. Optimal foraging when regulating intake of multiple nutrients. Anim. Behav. 68:1299-1311.
Smith, D. G., R. W. Mayes, T. Hollands, D. Cuddeford, H. H. Yule, C. M. Malo Ladrero, and E. Gillen. 2007. Validating the alkane pair technique to estimate dry matter intake in equids. J. Agric. Sci. 145:273-281.
Smith, M. L., B. Prall, W. Nandar, and M. A. Cline. 2008. B-Melanocyte-stimulating
hormone potently reduces appetite via the hypothalamus in chicks. J. Neuroendocrin. 20:220-226.
Stefanon, B., L. A. Volpelli, S. Bovolenta, and M. Pinosa. 1999. Estimation of fescue hay intake in horses using the n-alkanes method. Zoot. Nutr. Anim. 25:243-248.
Stevens, D. M., J. B. J. van Ryssen, and J. P. Marais. 2002. The use of n-alkane markers to estimate the intake and apparent digestibility of ryegrass and Kikuyu by horses. South African Journal of Animal Science. 31:50-55.
Varendi, H., K. Christensson, R. H. Porter, and J. Winberg. 1998. Soothing effect of amniotic fluid smell in newborn infants. Early Hum. Behav. 51:47-55.
Vickers, M. H., B. H. Breier, D. McCarthy, and P. D. Gluckman. 2003. Sedentary behavior during postnatal life is determined by the prenatal environment and exacerbated by postnatal hypercaloric nutrition. Am. J. Physiol. Regul. Integr. Comp. Physiol. 285:R271-R273.
Villalba, J. J. and F. D. Provenza. 2000. Roles of flavor and reward intensities in acquisition and generalization of food preferences: do strong plant signals always deter herbivory? J. Chem. Ecol. 26:1911-1922.
Villalba, J. J. and F. D. Provenza. 2009. Learning and dietary choice in herbivores. Rangeland Ecol Manage. 62:399-406.
Wynne, K., A. J. Park, C. J. Small, K. Meeran, M. A. Ghatei, G. S. Frost, S. R. Bloom. 2006. Oxyntomodulin increases energy expenditure in addition to decreasing energy intake in overweight and obese humans: a randomized controlled trial. Int. J. Obesity. 30:1729-1736.
Figure 1.1: Diagram of a) location of papillae on tongue; b) taste buds in each papilla; c) taste receptor cell within a taste bud.
Figure 1.2: Mechanism of pathways through taste receptor cells leading to activation of neurons and taste discrimination.
Figure 1.3: Intensity of post-ingestive feedback determines the level of preference or aversion of a given food.
ABSTRACT
Calculating dry matter intake of grazing herbivores has been an issue in determining factors
such as efficiency and digestibility of forages. The objectives were to compare and contrast
measured and estimated intake, and to measure digestibility using a supplement and estimate
intake composition using fecal grab sample alkane composition. Twelve beef cattle were fed
a blended switchgrass and alfalfa hay and fed a once-daily alkane supplement. Fecal grab
samples were collected the last 5 d over the 14-d experiment. There was no difference
between measured and estimated intake (P < 0.35). There was no day effect between fecal
concentrations and estimated intake and no difference (P < 0.65) between fecal alkane concentrations when duplicate samples were analyzed. Alkanes can be used to estimate
intake in cattle consuming mixed forage diets and intakes of individual components can be
back-estimated using simultaneous equations.
Keywords: alkanes, steer, alfalfa, switchgrass
Introduction
Dry matter intake of grazing ruminants is difficult to determine because animals can
select what they eat. Eating patterns can change from shifts in animal behavior and may be
attributed, in part, to forage on offer. Environmental conditions can influence canopy
structure and density of forage present; therefore, changing intake patterns and rate of
passage. Various markers have been used to estimate intake; however, each marker has