Abstract
CHETAN, SRIGIRIRAJU, KISHAN. Noninferior Surface Tracing Evolutionary Algorithm (NSTEA) for Multi Objective Optimization (Under the direction of Dr. S. Ranjithan.)
Evolutionary algorithms are becoming increasingly valuable in solving large-scale, realistic engineering problems. Most of these problems deal with sufficiently complex issues that typically conflict with each other, thus requiring multi objective (MO) analyses to assist in identifying compromise solutions. The focus of this paper is to develop and test a new multi objective evolutionary algorithm (MOEA). The new
procedure, Noninferior Surface Tracing Evolutionary Algorithm (NSTEA), builds upon two fundamental concepts that are established in the mathematical programming
literature for MO analysis. Implicit implementation of Pareto optimality and beneficial seeding of initial population are instrumental in the improved performance. NSTEA was evaluated by solving a suite of test problems reported in the MOEA literature.
Performance with respect to accuracy, coverage, and spread of noninferior solutions generated by NSTEA is evaluated and compared with those of solutions generated by four other MOEAs that are widely accepted. Also, in some cases, comparisons are made with noninferior sets generated using mathematical programming techniques. Overall, NSTEA performs relatively better than the other MOEAs when tested on these problems. Application and performance evaluation of NSTEA in solving a real-world MO
Noninferior Surface Tracing Evolutionary Algorithm
(NSTEA) for Multi Objective Optimization
by
Kishan Chetan Srigiriraju
A thesis submitted to the graduate faculty of North Carolina State University in partial fulfillment of the requirements
for the Degree of Masters of Science
Civil Engineering
Raleigh August 2000
Approved by
_________________________ _________________________ Dr. S. Ranji Ranjithan Dr. E. Downey Brill Jr.
Chair of Advisory Committee
______________________
_______________________
Biography
S. Kishan Chetan is a graduate research assistant in the Department of Civil Engineering at North Carolina State University in Raleigh, North Carolina, since August 1998. Mr. Chetan received a bachelor’s degree in Civil Engineering in April 1998 from Indian Institute of Technology, Bombay, India. He has been pursuing graduate course work and research in the area of Environmental Systems Analysis under the direction of Dr. S. Ranjithan.
TABLE OF CONTENTS
LIST OF TABLES iv
LIST OF FIGURES v
1. INTRODUCTION 1
2. BACKGROUND 3
2.1 A standard multiobjective optimization problem 3
2.2 Noninferiority 3
2.3 Evolutionary algorithms for multiobjective optimization 4
2.3.1 Vector Evaluated Genetic Algorithm (VEGA) 5
2.3.2 Niched Pareto Genetic Algorithm (NPGA) 6
2.3.3 Non-dominated Sorting Genetic Algorithm (NSGA) 7 2.3.4 Strength Pareto Evolutionary Algorithm (SPEA) 7 3. NSTEA – NONINFERIOR SURFACE TRACING EVOLUTIONARY
ALGORITHM
8
4. TESTING AND EVALUATION OF NSTEA 12
4.1 Schaffer’s F2 Problem 13
4.1.1 Description 13
4.1.2 Results 14
4.2 Winston Problem 15
4.2.1 Description 15
4.2.2 Results 16
4.3 Extended 0/1 multiobjective knapsack problem 17
4.3.1 Description 17
4.3.2 Results 18
4.3.3 Performance metrics and comparison of MOEAs 21
4.3.4 A computational comparison 26
5. APPLICATION OF NSTEA TO A REALISTIC ENGINEERING PROBLEM – THE DELWARE ESTUARY MANAGEMENT PROBLEM
28
6. SUMMARY AND CONCLUSIONS 32
LIST OF FIGURES
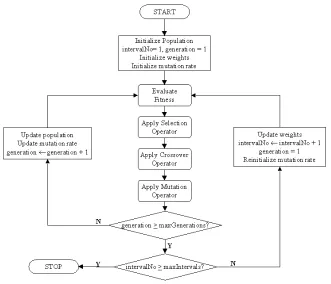
Figure 1 Flowchart of the NSTEA: Noninferior Surface Tracing Evolutionary Algorithm
11
Figure 2 The true noninferior tradeoff curve and the noninferior set determined by NSTEA for Schaffer’s F2 problem
14
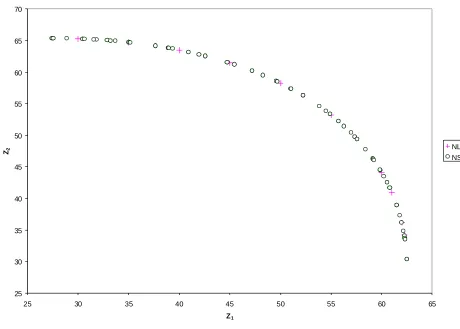
Figure 3 The noninferior solution obtained using NSTEA and an NLP solution approach for the Winston problem.
16
Figure 4 A comparison of noninferior sets obtained using NSTEA, VEGA,
NPGA, NSGA, SPEA, and mathematical programming approach (IP) for the extended 0/1 multiobjective knapsack problem.
19
Figure 5
A comparison of noninferior sets obtained using NSTEA for five random trials for the extended 0/1 multiobjective knapsack problem.
20
Figure 6 An example of two-objective noninferior tradeoff to illustrate the computation of: 1) Spread metric, and 2) Coverage metric
23
Figure 7 Comparison of noninferior solutions using NSTEA and LP (linear programming) for the Delaware Estuary management problem
LIST OF TABLES
Table 1 NSTEA parameters and settings for solving the test problems 15 Table 2a Accuracy comparison, based on the S factor, of noninferior sets
generated by different MOEAs for the extended 0/1 multiobjective knapsack problem
24
Table 2b Accuracy comparison, based on the metric defined by Knowles and Corne(2000), of NSTEA with different MOEAs for the extended 0/1 multiobjective knapsack problem
24
Table 2c Comparison of Spread of noninferior sets generated by different MOEAs for the extended 0/1 multiobjective problem
25
Table 2d Comparison of Coverage of noninferior sets generated by different MOEAs for the extended 0/1 multiobjective knapsack problem
26
Table 3 A computational comparison, for five random trials, in terms of number of function evaluations needed by NSTEA with and without population seeding to solve the extended 0/1 multiobjective knapsack problem.
1 Introduction
Most real world engineering decision making problems, especially those that involve public sector issues, require consideration of a multitude of conflicting design objectives. Although many of these objectives can be represented sufficiently well to allow quantitative analysis, incorporating them into a decision making process requires multiobjective (MO)
modeling and optimization. Unlike single objective problems for which the optimal solutions are sought, the multiobjective problems require the consideration of noninferior tradeoffs among competing objectives to help identify best compromise solutions. This information is potentially useful to decision makers in eliminating inferior solutions from consideration, facilitating an efficient search for solutions that really matter with respect to the defined objectives. Generation of tradeoff information in the form of a noninferior, or Pareto optimal set, of solutions within a region of interest in the objective space is the main goal of multiobjective analysis.
An array of multiobjective evolutionary algorithms (MOEAs) has been reported since the early eighties. Detailed summaries of the state-of-the-art in MOEA were discussed recently by Coello (1999a) and Van Veldhuizen and Lamont (2000), and are also represented in the special issue of Evolutionary Computation (Vol. 8, No. 2, Summer 2000) on multi criterion optimization (also see Coello (1999b) for an archive of bibliography). Within standard mathematical
programming frameworks, the constraint method and weighting method are two commonly used techniques for generating noninferior sets (Cohon, 1978). In the constraint method, one
The underlying Pareto-optimality concepts of these MO methods are general, and can be applied within any evolutionary algorithm (EA) framework as well as within mathematical programming techniques for optimization. Solving a number of independent single objective optimization models to obtain a set of noninferior solutions, however, renders these MO methods less attractive if each model solution is computationally intensive to obtain. This issue is
addressed in some mathematical programming approaches (e.g., linear programming, nonlinear programming, integer programming) by seeding a search for a new noninferior solution with a previously generated adjacent noninferior solution. The first noninferior solution can be the optimal solution for any one of the objectives. Any efficiency gain is predicated on the notion that for some class of problems noninferior solutions adjacent in the decision space map to adjacent points in the objective space.
NSTEA to a real world problem in environmental management is also presented. Finally, concluding remarks are made with a brief discussion of NSTEA’s strengths and weaknesses.
2 Background
2.1 A standard multiobjective optimization problem
A multiobjective problem consisting of k objectives and m constraints defined as functions of decision variable set x can be represented, without loss of generality, as follows:
Maximize Z(x) = {Zl(x): l=1,2, …, k} (1)
S.T. gi(x)≤ 0 ∀i = 1,2,…,m (2)
x∈X (3)
where x = {xj : j = 1,2,…..,n} represents the decision vector, xj is the jth decision variable, X represents the decision space, gi(x) is the ith constraint, Z(x) is the multiobjective vector, and
Zl(x) is the lth objective function.
2.2 Noninferiority
More rigorous definitions of this and related MO terminology are given by Van Veldhuizen and Lamont (2000) and Zitzler et al. (2000). Based on the definitions by Van Veldhuizen and Lamont (2000) and notations used in Equations 1-3, the following are defined:
Pareto Dominance: A multiobjective vector u = (u1,u2,…uk) is said to dominate v = (v1,v2,…vk) (denoted by u Ø v ) if and only if u is partially more than v,
i.e.,∀i∈{1,2,...k},ui ≥vi ∧∃i∈{1,2,...k}:ui > vi.
Pareto Optimality: A solution x∈X is said to be Pareto optimal with respect to X if and only if there exists no x’∈ X for which v = Z(x’) dominates u = Z(x).
Pareto Optimal Set: For a given multiobjective problem Z(x), the Pareto optimal set P* is a set consisting of Pareto optimal solutions. P* is a subset of all the possible solutions in X.
Mathematically, P* is defined as follows:
P* := {x ∈X|¬∃x’∈X :Z(x’) ØZ(x)} (4) Pareto Front: The Pareto front, PF* is the set that contains the evaluated objective vectors of P*. Mathematically PF* is defined as:
PF* := { u = Z(x) |x∈P* } (5)
2.3 Evolutionary algorithms for multiobjective optimization
Since the pioneering work by Schaffer (1984, 1985) in the area of EAs for MO
surveys. For example, Schaffer’s (1985) vector evaluated genetic algorithm (VEGA) uses a special single-objective-based preferential selection procedure, the method by Hajela and Lin (1992) uses an aggregated fitness function, and the methods by Horn et al. (1994), Srinivas and Deb (1994), Zitzler and Thiele (1999), and Knowles and Corne (2000) use Pareto-based
selection procedures to determine the noninferior set. In addition, these techniques can be categorized by special operators, such as niching and sharing (e.g., Horn et. al., 1994; Menczer et. al., 2000), restrictive mating (e.g., Loughlin and Ranjithan, 1997), and elitism (e.g., Knowles and Corne, 2000; Zitzler and Thiele, 1999). An EA-based approach presented more recently by Loughlin et al. (2000a) addresses problems with conflicting objectives where some may not be easily quantified or modeled. A wide range of applications (e.g., Hajela and Lin, 1992; Ritzel et al., 1994; Cieniawski et al., 1995; Jimenez and Cadenas, 1995; Harrell and Ranjithan, 1997; Coello et al., 1998; Coello and Christiansen, 2000; Loughlin et al., 2000b; Obayashi et al., 2000) of MOEAs in solving realistic MO engineering problems have also been reported. All existing MOEAs are not described in this paper, but brief discussions are provided below for selected MOEAs that are used to compare the performance of NSTEA proposed in this paper.
2.3.1 Vector Evaluated Genetic Algorithm (VEGA)
VEGA (Schaffer, 1985) was the first reported MOEA that exploited the population within an EA to consider multiple objectives and to search for nondominated solutions
simultaneously. For a problem with k objectives, k subpopulations of size N/k are considered, where N is the population size. Beside the standard crossover and mutation operators, VEGA applies a selection operator preferentially to each subpopulation based on one of the objectives. These subpopulations are then shuffled together at end of each iteration to obtain a new
fitness components associated with each of the objectives. The linear combination of the objectives implicitly performed over many generations by VEGA can be attributed to the speciation phenomenon. This tends to split the population into species, each specializing with respect to one of the objectives. As a result, VEGA provides a poor coverage of the noninferior set.
2.3.2 Niched Pareto Genetic Algorithm (NPGA)
Horn et al., (1994) proposed NPGA that uses Pareto optimality as a basis for the selection operator. Individuals undergo a tournament selection in which the Pareto dominance of the individuals is used as the criterion for determining the winner. Instead of limiting the tournament comparison to two individuals, a comparison set consisting of a specific number (tdom) of
2.3.3 Non-dominated Sorting Genetic Algorithm (NSGA)
The NSGA (Srinivas and Deb, 1994) is based on several layers of classifications of the individuals. NSGA varies from a simple genetic algorithm only in the way the selection operator is used. The crossover and mutation operators remain unchanged. Before selection, the
population is ranked on the basis of nondomination, classifying all nondominated individuals into one category with a dummy fitness value. To maintain diversity in the population, these classified individuals undergo sharing based on their dummy fitness values. This group is then ignored and the next layer of nondominated individuals is classified similarly, assigning a lower fitness value. This layering process continues until the whole population is classified. Thereafter a stochastic remainder roulette-wheel selection is used to select the next generation of
individuals, resulting in more copies of individuals that are relatively more dominant. This facilitates search for nondominated regions and consequent convergence to the noninferior set. A tangential pressure applied in the objective space by the sharing procedure helps enhance coverage of the noninferior set. NSGA is shown to obtain a good coverage of the noninferior set, but is sensitive to the sharing factor.
2.3.4 Strength Pareto Evolutionary Algorithm (SPEA)
Zitzler and Thiele (1999) presented SPEA, an elitist MOEA based on Pareto optimality concepts. SPEA maintains an external population of noninferior solution by storing at every generation all Pareto optimal solutions. Along with the current population, this external
combined population are assigned a fitness value based on the number of solutions they dominate. A relatively higher fitness value is assigned to an individual that dominates more solutions in the combined population, while a relatively lower fitness value is associated with a solution dominated by more solutions in the combined population. Care is taken to assign no non-dominated solution a fitness value worse than the most dominated solution. This
methodology of fitness assignment ensures that the search is directed towards the noninferior set while simultaneously maintaining diversity.
3 NSTEA - Noninferior Surface Tracing Evolutionary Algorithm
The most successful among the existing MOEAs with respect to identifying the noninferior set with sufficient coverage use, in general, a Pareto-based approach. Each step for checking Pareto optimality requires sorting and pair-wise comparison of at least a subset of the population, thus increasing the computational needs. This is avoided in the new MOEA technique NSTEA that is presented in this paper. Building upon the concepts of the mathematical programming-based weighting approach (Cohon, 1978) for generating the noninferior set, NSTEA achieves Pareto optimality in an implicit manner by applying fitness pressure that encourages the population at each intermediate step to move towards a noninferior solution. Similar to an objective aggregation approach, a linearly weighted function of all objective functions is used to evaluate fitness at each intermediate step to enforce Pareto optimality of a solution. Normalized objective function values are used to maintain generality. Through repeated execution of this intermediate step with varying weight vectors, NSTEA attempts to identify the noninferior set. A linearly weighted fitness function, Zag, is computed as follows:
∑
== k
l l l
ag wZ
Z
1
where, w = {wl: :l=1,2,…k} is the weight vector, wl is the lth weight and Zl is the l
thnormalized
objective function value. The weight wl is a fractional number such that
1
1 =
∑
= kl l
w (7)
A straightforward implementation of an algorithm that repeats this intermediate step with varying w would be similar to iterative execution of a single objective EA, which is not
necessarily computationally efficient. Instead, NSTEA exploits the basic concept that for some classes of problems, adjacent solutions in the decision space map to adjacent points in the objective space. Its implication is that these decision vectors (xs) (that map to adjacent
noninferior points in the objective space) have solution features (i.e., values of xjs) that are only marginally different. This enables the beneficial use of the final population corresponding to the current noninferior solution to seed the search of an adjacent noninferior solution. The new search of course would have an updated weight vector w to represent an adjacent noninferior point in the objective space. When the new selection pressure manifesting from the updated weight vector is applied on the previous population, the population quickly migrates to an adjacent noninferior solution. A systematic update of the weight vector thus enables an efficient mechanism for incrementally tracing the noninferior set. This incremental population migration approach significantly reduces the computational burden compared to that required when solving each single objective EA as independent search problems.
Using a two objective problem as an illustration, let the current weight vector w be {w1, w2}; without loss of generality, we assume w1 + w2 = 1. The updated weight vector corresponding to
magnitude of ∆ determines the minimum interval between adjacent noninferior solutions. For
example, smaller values of ∆ would result in a finer coverage (or better distribution) of the noninferior set, but would require execution of more intermediate steps, each of which requiring the solution of a single objective EA. At the beginning of the algorithm, the population is converged to an extreme point in the noninferior set by optimizing for one of the objectives. In the above example, this is achieved by solving the optimization problem corresponding to w1=1 and w2=0 (or alternately w1=0 and w2=1). Once the population has converged to this solution according to some stopping criterion, the best solution is stored. Then the weight vector is
incremented adaptively to w1←w1-∆ and w2←w2+∆, and the current population is continually subjected to all the genetic operators where the fitness evaluation is now based on the updated weight vector. To introduce higher population diversity at the beginning of each search, the mutation operator is applied in an adaptive manner during each intermediate step, starting with a higher rate and gradually reducing it (e.g., exponential decay) with generations within each step. Thus, at the beginning of each intermediate step the higher mutation rate perturbs the converged population around the previous noninferior point, introducing diversity for the new search.
This iterative process is terminated when the weight vector corresponds to optimization of the other objective, i.e., when w1= 0 and w2=1 (or alternatively w1=1 and w2=0). Two
generations. If either of the above two criteria is satisfied then the weight vector is updated. The key steps of NSTEA are shown as a flowchart in Figure 1.
Figure 1: Flowchart for NSTEA - Noninferior Surface Tracing Evolutionary Algorithm. * The two convergence criteria are: 1) generation≥maxGenerations, and 2) no
improvement in N successive generations
The coverage of the noninferior set is achieved explicitly by traversing the noninferior surface through incremental and systematic updates of the weight vector.
4 Testing and evaluation of NSTEA
NSTEA was applied to a set of test problems of varied difficulty and characteristics. The first application uses Schaffer’s F2 problem (Schaffer, 1985), which is an unconstrained,
nonlinear problem. This is included since most other MOEA methods have been tested against it, providing a common basis for comparison. The second application uses a constrained, non-linear optimization problem (Winston, 1993). Although this problem has not been used for testing of other MOEA methods, it offers a relatively challenging constrained problem that is easily implemented. A noninferior set obtained by solving this problem using a gradient-based nonlinear programming algorithm (Generalized Reduced Gradient-GRG2 algorithm (Lasdon et al., 1978; Fylstra et al., 1998) hosted by Microsoft Excel 97 Solver) is used to evaluate the performance of NSTEA. While the first two applications represent problems in a continuous search space, the third application, which uses the extended 0/1 multiobjective knapsack problem (Zitzler and Thiele, 1999), represent a problem in a combinatorial search space. This problem is a constrained, binary problem. Performance comparisons of several MOEAs in solving this problem are presented by Zitzler and Thiele (1999), and are used here to compare the performance of NSTEA. In addition, a noninferior set was generated using a mathematical programming-based weighting method for the extended 0/1 knapsack problem, which was solved
using a binary programming solver (CPLEX Version 4.0).
available prediction; 2) coverage, i.e., how many different noninferior solutions are generated and how well are they distributed; and 3) spread, i.e., what is the maximum range of the noninferior surface covered by the generated solutions. Currently reported as well as newly defined quantitative measures are used in comparing NSTEA with other MOEAs. The robustness of NSTEA in solving problems with different characteristics (e.g., real vs. binary variables, constrained vs. unconstrained, continuous vs. combinatorial) is examined, in some limited manner, by applying it to a variety of problems. To evaluate the robustness of NSTEA in generating the noninferior set and providing good coverage, random trials were performed where the problems were solved repeatedly for different random seeds. A representative solution is used in the discussion below
4.1 Schaffer’s F2 problem
4.1.1 Description
The F2 problem is defined as follows:
Minimize Z1 = x2 (8)
Minimize Z2 = (x – 2)2 (9)
The range for the decision variable x is [-5,7]. The Pareto optimal solutions constitute all
x values varying from 0 to 2. The solution x = 0 is optimum with respect to Z1while the solution
4.1.2 Results
The F2 problem was solved using NSTEA with algorithm-specific parameters as shown in Table 1. Results are compared in Figure 2 where the exact solution (obtained analytically
using Equations 8 and 9) for this problem is also shown.
0 0.5 1 1.5 2 2.5 3 3.5 4 4.5
0.00E+00 5.00E-01 1.00E+00 1.50E+00 2.00E+00 2.50E+00 3.00E+00 3.50E+00 4.00E+00 4.50E+00
Z1
Z2 NSTEA
Analytical solution
Figure 2: The true noninferior tradeoff curve and the noninferior set determined by NSTEA for Schaffer’s F2 problem.
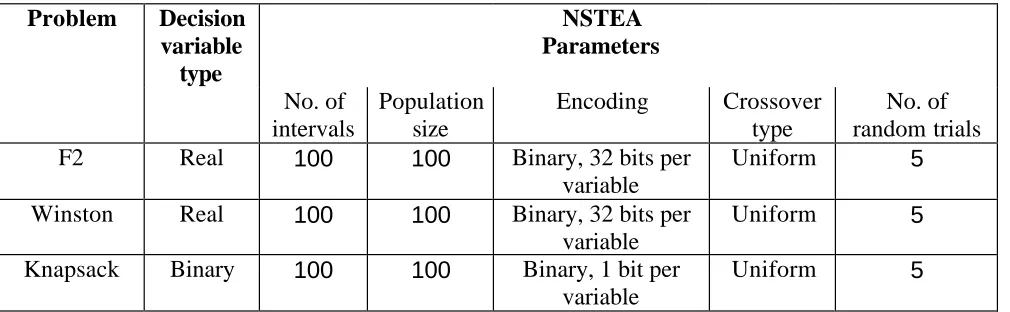
Table 1: NSTEA parameters and settings for solving the test problems
Problem Decision variable
type
NSTEA Parameters No. of
intervals
Population size
Encoding Crossover type
No. of random trials
F2 Real 100 100 Binary, 32 bits per
variable
Uniform 5
Winston Real 100 100 Binary, 32 bits per
variable
Uniform 5
Knapsack Binary 100 100 Binary, 1 bit per variable
Uniform 5
4.2 Winston problem
4.2.1 Description
This problem, adapted from Winston (1993), is a constrained, two objective, nonlinear problem with two real-valued decision variables. This is a resource allocation problem in which television advertising resources must be distributed between two target audiences. The goal is to maximize the exposure of the advertisements to both male and female viewers. Given a limited total advertising budget, the choice is between placing advertisements during football games and soap operas, each costing different amount. This problem is mathematically stated as follows:
Maximize the number of men, Z1 =20 F +4 S (10)
Maximize the number of womenZ2 =4 F +15 S (11)
Subject to the budget constraint: 100F + 60S ≤ 1000 (12)
4.2.2 Results
The Winston problem was solved using NSTEA with parameter settings as shown in Table 1. For comparative purposes, a noninferior set was obtained using the constraint method for this problem. A series of single objective constrained nonlinear programming models were solved using the nonlinear programming (NLP) solver (Generalized Reduced Gradient-GRG2 algorithm (Lasdon et al., 1978; Fylstra et al., 1998) hosted by Microsoft Excel 97 Solver). The resulting noninferior solutions are shown in Figure 3.
25 30 35 40 45 50 55 60 65 70
25 30 35 40 45 50 55 60 65
Z1
Z2 NLP
NSTEA
Noninferior solutions generated by NSTEA are accurate (in comparison with the noninferior solutions generated using the NLP approach) and cover the noninferior surface evenly. Also, the generated solutions spread the entire range of the noninferior set.
4.3 Extended 0/1 multiobjective knapsack problem
4.3.1 Description
Zitzler and Thiele (1999) used in their work a knapsack problem that extends the
traditional single objective knapsack problem by incorporating two knapsacks that can be filled by items selected from a larger collection of items. Similar to the traditional knapsack problem, each knapsack has a limited weight capacity with different payoff when each item is included in it. The goal is to allocate a limited set of items to maximize the payoff in each knapsack without violating its weight capacity constraint. This multiobjective problem is defined mathematically as follows:
Maximize Zl(x) =
∑
=
n
j1
pl,j xj ∀l = 1,2,…,k (13)
Subject to
∑
=
n
j1
wl,j xj≤ cl ∀l = 1,2,…,k (14)
In the formulation, Zl(x) is the total profit associated with knapsack l, pl,j= profit of
This binary MO problem was solved for the cases with two knapsacks (i.e. k = 2) and 250 and 500 items. The results reported here correspond to n = 500 and k = 2. The data for the
problems solved were adapted from Zitzler and Thiele (1999).
4.3.2 Results
The extended knapsack problem was solved by NSTEA for the parameter setting shown in Table 1. In addition, the noninferior set was generated using the constraint method for this problem by modeling it as a binary linear programming (BLP) model. This was solved using the
15000 16000 17000 18000 19000 20000 21000
15000 16000 17000 18000 19000 20000 21000
Z1 Z2
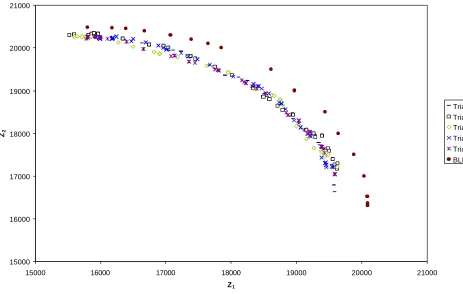
VEGA NPGA NSGA NSTEA SPEA BLP
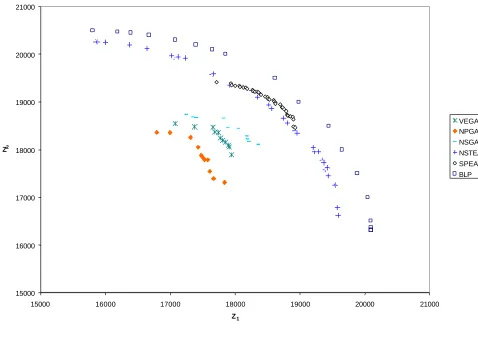
Figure 4: A comparison of noninferior sets obtained using NSTEA, VEGA, NPGA, NSGA, SPEA, and mathematical programming approach (BLP) for the extended 0/1 multiobjective knapsack problem.
15000 16000 17000 18000 19000 20000 21000
15000 16000 17000 18000 19000 20000 21000
Z1 Z2
Trial 1 Trial 2 Trial 3 Trial 4 Trial 5 BLP
Figure 5: A comparison of noninferior sets obtained using NSTEA for five random trials and BLP (binary linear programming) method for the extended 0/1 multiobjective knapsack problem.
poor. The combinatorial nature of the search can be attributed to the weak performance by all EAs. Accuracy of NSTEA in comparison to other MOEA results , however, is very good. Some noninferior solutions obtained by SPEA, the best performing MOEA according to Zitzler and Thiele (1999), appear to dominate some solutions generated by NSTEA. The spread or range covered by the NSTEA generated solutions, however, is far superior to that attained by all other MOEAs. Further, NSTEA is able to provide good coverage by identifying noninferior solutions that are almost evenly distributed throughout the full range.
4.3.3 Performance metrics and comparison of MOEAs
To compare the performance of NSTEA with that of other MOEAs, the following quantitative measures are used.
Accuracy
The S factor used by Zitzler and Thiele (1999) to represent the size of noninferior space covered is used to characterize and compare accuracy. In addition, the approach used by Knowles and Corne (2000), which is based on the method proposed by Fonseca and Fleming (1995), is used to characterize the degree to which a noninferior set outperforms another. The same numbers of radial sampling lines used in computing this metric by Knowles and Corne (2000) are used in the comparisons presented here. An either-or criterion is used to determine if the noninferior set obtained by an MOEA dominates that obtained by another MOEA; the closeness of the two points of intersection are not differentiated statistically.
Spread
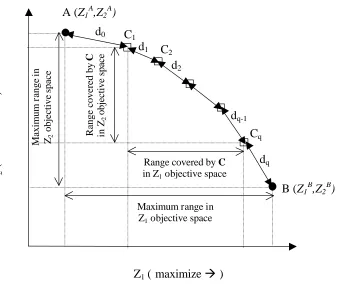
indicates better spread. As shown in Figure 6, let points A and B refer to the two extreme points, i.e., the single objective optimal solutions for objective 1 and 2, respectively, for a two objective
case. The maximum range covered by the noninferior set C∈ {Ch : h=1, 2, …,q} is (Z1Cq – Z1C1) and (Z2C1 – Z2Cq) in Z1 and Z2 objective space, respectively. Therefore, the spread metrics in objective space 1 and 2 are defined as (Z1Cq – Z1C1)/(Z1B – Z1A) and (Z2C1 – Z2Cq)/(Z2A – Z2B), respectively.
Coverage
A quantitative measure computed based on the maximum gap in coverage is defined to represent the distribution of the noninferior solutions generated by an MOEA. The Euclidean distance between adjacent noninferior points in the objective space is used to indicate the gap. A smaller value of this metric indicates better distribution of solutions in the noninferior set. This metric is defined separately as V1 and V2 to characterize the coverage within the range of noninferior region defined by 1) the extreme points, and 2) the solutions generated by the MOEA, respectively. Using the illustrations shown in Figure 6, V1 is defined as Max {dh :
Figure 6: An example two-objective noninferior tradeoff to illustrate the computation of: 1)
Spread metric, and 2) Coverage metric.
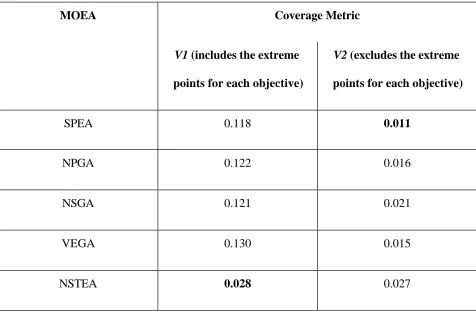
A summary of these metrics are compared in Tables 2a-2d for the noninferior solutions generated by all MOEAs shown in Figure 4. These results indicate that overall NSTEA performs better than NPGA, NSGA, SPEA, and VEGA with respect to finding nondominated solutions with a good distribution in the noninferior region. This conclusion is specific to the 0/1 extended multiobjective knapsack problem, and similar performance comparisons for other problems are needed to make more general conclusions. Although NSTEA provides the best distribution of solutions in the entire noninferior range (based on V1 metric), SPEA provides a better
distribution (based on V2 metric) within the narrower noninferior range represented by its solutions.
Z1 ( maximize à )
Z2
(
maximize
à
)
A (Z1A,Z2A)
B (Z1B,Z2B) C1 C2 Cq d1 dq-1 dq d0 d2
Range covered by C in Z1 objective space
Range covered by
C in Z2 objective space Maximum r ange in Z2 objective space
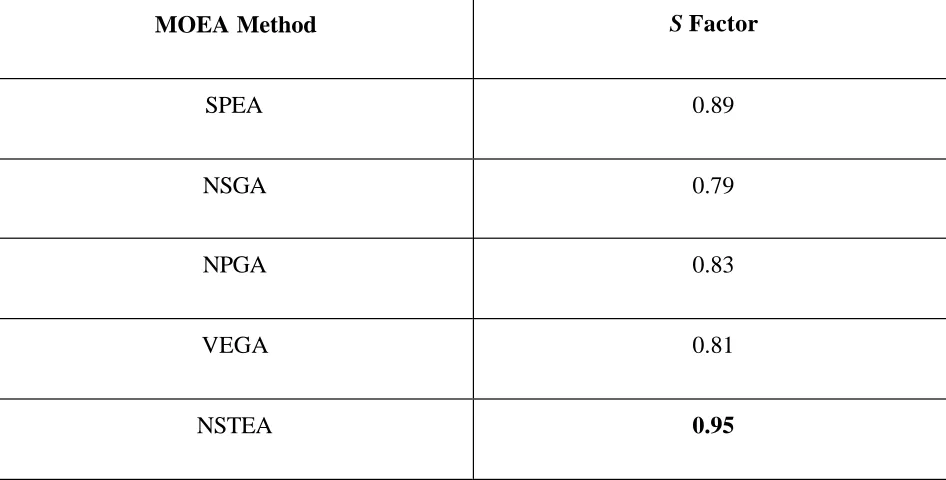
Table 2a: Accuracy comparison, based on the S factor (Zitzler and Thiele, 1999), of noninferior sets generated by different MOEAs for the extended 0/1 multiobjective knapsack problem. A larger value indicates better performance; the best is shown in bold.
MOEA Method S Factor
SPEA 0.89
NSGA 0.79
NPGA 0.83
VEGA 0.81
NSTEA 0.95
Table 2b: Accuracy comparison, based on the metric defined by Knowles and Corne (2000), of NSTEA with different MOEAs for the extended 0/1 multiobjective knapsack problem.
(P1, P2): (Percentage number of times MOEA1 outperforms
MOEA2, Percentage number of times MOEA2 outperforms
MOEA2)
Number of Sampling Lines The MOEAs
Compared
(MOEA1 vs.
MOEA2)
(NSTEA vs. SPEA) (96.3, 3.7) (95.9, 4.1) (95.9, 4.1)
(NSTEA vs. NSGA) (100, 0) (100, 0) (100, 0)
(NSTEA vs. NPGA) (100, 0) (100, 0) (100, 0)
(NSTEA vs. VEGA) (100, 0) (100, 0) (100, 0)
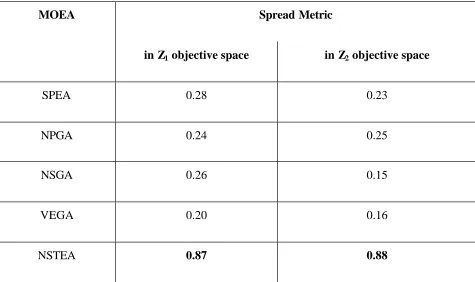
Table 2c: Comparison of Spread of noninferior sets generated by different MOEAs for the extended 0/1 multiobjective knapsack problem. A larger value indicates better performance; the best is shown in bold.
Spread Metric MOEA
in Z1 objective space in Z2 objective space
SPEA 0.28 0.23
NPGA 0.24 0.25
NSGA 0.26 0.15
VEGA 0.20 0.16
Table 2d: Comparison of Coverage of noninferior sets generated by different MOEAs for the extended 0/1 multiobjective knapsack problem. A smaller value indicates better performance; the best is shown in bold.
Coverage Metric MOEA
V1 (includes the extreme points for each objective)
V2 (excludes the extreme points for each objective)
SPEA 0.118 0.011
NPGA 0.122 0.016
NSGA 0.121 0.021
VEGA 0.130 0.015
NSTEA 0.028 0.027
4.3.4 A computational comparison
A major premise underlying the new technique was the adjacency mapping between decision space and objective space. By using the population that has converged around a
seeding at each intermediate step. These runs were repeated for five random trials. The numbers of function evaluations required by NSTEA with and without seeding are compared in Table 3.
Table 3: A computational comparison, for five random trials, in terms of number of function evaluations needed by NSTEA with and without population seeding to solve the extended 0/1 multiobjective knapsack problem.
No. of function evaluations Random Trial No.
NSTEA with population seeding NSTEA without population seeding
1 211,800 445,600
2 201,700 421,100
3 206,200 440,200
4 205,400 450,900
5 204,700 440,400
Two main observations can be made: 1) the number of function evaluations needed by NSTEA is significantly smaller (over 50% less than the case when no seeding was applied); and 2) similar computational improvement is observable in all random trials. These results confirm the benefit of the primary concept of adjacency mapping that is used in constructing the
5 Application of NSTEA to a realistic engineering problem – The Delaware estuary management problem
To evaluate the applicability of NSTEA in generating noninferior solutions for a realistic multiobjective optimization problem, a case study that was reported in the literature and had all necessary input information was identified. Brill (1972) reported a relatively large-scale real world multiobjective analysis for a water quality management problem in the Delaware estuary. This was build upon an extensive chemical-physical simulation model (Thomann, 1963) to describe the water quality and earlier pollution discharge management models (e.g., Smith and Morris, 1969). A stretch of 84 miles of the Delaware estuary was studied. This stretch was bordered by a large metropolitan and industrial complex, including one of the largest oil refining and chemical areas in the United States. The primary water quality parameter of interest was dissolved oxygen (DO) in the water. The critically low level of DO was attributed to the discharge of wastewater, which had high levels of biochemical oxygen demand (BOD).
The management model described by Brill (1972) is represented as a linear mathematical programming (LP) model. Although an LP-based model was used in that analysis, the structure of the management model would become more complex (e.g., nonlinear and binary
programming) when nonlinear cost functions and nonlinear physical-chemical processes are incorporated in the analysis, calling for evolutionary algorithm-based solution approaches. This LP-based management model considered 44 major BOD dischargers and their impact on DO in 30 discrete reaches (each approximately 10,000 - 20,000 ft long). The main goal of this
solutions were sought to assist in the decision making process. The MO analysis focused on consideration of two conflicting objectives: minimizing cost of BOD control, and maximizing equity with respect to levels of treatment among the different dischargers. In general, the least cost discharge control strategy tends to be inequitable since the most cost-effective treatment options are preferentially selected during optimization, resulting in inequities due to different treatment levels by the dischargers. Alternatively, the most equitable strategy, i.e., uniform treatment, where all dischargers treat at the same rate is typically not cost effective because of various factors that differ among dischargers, including economies of scale effects, location effects and other differences among dischargers. Therefore, consideration of noninferior tradeoff between these conflicting objectives was needed. Different equity measures were
studied by Brill et al. (1976), and the particular management model that is compared in this paper is as follows:
Minimize Z1 =(emax −emin) (equity measure) (15)
Minimize
∑ ∑
= = = N j K k k j k j j f C Z 1 1 , ,
2 . (cost) (16)
M i B f A i n j K k k j j i j ,..., 2 , 1 . 1 1 , , ≥ =
∑ ∑
= = (17) j k j k j k k N j U f ,.... 2 , 1 ,..., 2 , 1 , , = = ≤ (18) E j f FT j K k k jj). 0.35 ε
N j D f FT e j K k k j j j j ,..., 2 , 1 . ) / 1 ( 1 , = = −
∑
= (20) qj e j J
e − max ≤0 ε (21)
N j
e
ej− min≥0 =1,2,..., (22)
j k j K k N j f ,... 2 , 1 ,..., 2 , 1 0 , = = ≥ (23) N j
ej≥ 0 =1,2,..., (24)
0 0 min max ≥ ≥ e e (25)
where, N is the number of dischargers, J = {1,2,…,j,…,N} is the set of the indices of the
dischargers, fj,k is the kth piecewise waste reduction variable for discharger j, Cj,k is the unit cost for fj,k, Kj is the number of waste reduction variables for discharger j, Ai,jis the impact coefficient representing the improvement in water quality resulting from a unit waste reduction by
Brill et al. (1972) solved the above management model using the constraint method (Cohon, 1978) via linear programming (LP). The same problem was also solved using NSTEA. This problem had 44 decision variables represented as real-valued strings, and a population size of 100 was used. The number of intervals was set to 100. The noninferior solutions that were reported in Brill (1972) are used as the basis for evaluation and comparison of the performance of NSTEA. The resulting noninferior sets are shown in Figure 7.
0.00E+00
5.00E+07
1.00E+08
1.50E+08
2.00E+08
2.50E+08 0
0.1 0.2
0.3 0.4
0.5 0.6
0.7
Z1 (equity - dimesionless)
Z2
(treatment cost - dollars)
LP NSTEA
Figure 7: Comparison of noninferior solutions obtained using NSTEA and LP (linear programming) for the Delaware Estuary management problem.
of the noninferior set, except in the middle where some NSTEA solutions are slightly inferior. It must be noted that the linear programming-based noninferior solutions are globally optimal and therefore represent the best noninferior tradeoff for this problem.
6 Summary and Conclusions
This paper presents a new MOEA, Noninferior Surface Tracing Evolutionary Algorithm (NSTEA) for solving multiobjective optimization problems. NSTEA is founded upon two
simple, but powerful concepts: 1) optimization of an aggregate function of all objective functions finds a noninferior, or Pareto optimal, solution; and 2) for some classes of problems, noninferior solutions adjacent in objective space map to adjacent decision vectors with only marginal
differences in the decision space. The attractive features of NSTEA include: easily adaptable for use with existing implementation of evolutionary algorithms for an optimization problem since no new operators are needed; and relatively less compute intensive since Pareto optimality is ensured in an implicit manner, and therefore expensive sorting and pair-wise comparison operations that are typically required by other Pareto-based MOEAs are eliminated.
To evaluate the applicability of NSTEA to different MO problems, it was applied to a set of standard test problems (reported in recent MOEA literature) with differing characteristics and of varying levels of difficulty. Test problems covered continuous as well as combinatorial search, unconstrained as well as constrained optimization, real as well as binary variables, and as few as one variable to as high as 500 variables. This evaluation included performance
performed well with respect to these criteria for all problems tested. The spread and coverage of noninferior solutions obtained using NSTEA were always better than those demonstrated by other MOEAs. With respect to accuracy, NSTEA did well in almost all cases, except for the extended 0/1 multiobjective knapsack problem for which SPEA did better for a few noninferior solutions.
NSTEA was also applied to a real-world problem that required a multiobjective analysis of two conflicting, environmental management objectives. This problem, which is well
documented and reported in the literature, looked at environmental management strategies for meeting water quality standards in the Delaware estuary while minimizing the cost of
environmental pollution control as well as minimizing the differences in control levels among the polluters, i.e., maximizing the equity. Results reported by other researchers included noninferior sets with respect to the cost and equity objectives. These solutions are globally optimal since a linear programming approach was used to solve the MO model. In a comparison of noninferior solutions obtained using NSTEA with the reported results, NSTEA performed well in providing good coverage and spread, and the solutions were sufficiently accurate compared to the global optimal solutions.
Some known limitations of NSTEA include the following. The computational efficiency gain obtained in NSTEA is premised on the existence of similarities in noninferior solutions that correspond to adjacent points in the objective space. For problems where this may not hold true strongly, the search implemented by NSTEA becomes analogous to solving a number of independent single objective optimization problems, and therefore, may not realize any significant computational gain. As the underlying search mechanism for a Pareto optimal
would dictate the number of noninferior solutions found. If this increment is relatively large, it is possible to miss some of the noninferior solutions, thus affecting the coverage. As a result, NSTEA with relatively large weight increments will likely miss noninferior solutions that lie within any linear segment of the noninferior tradeoff. For a problem with more than two
objectives, incrementally updating the weight vector to obtain an adjacent point is not necessarily as straightforward as is for the two-objective cases presented here. More investigation is needed to evaluate this issue when applying NSTEA to higher dimensional problems.
The computational performance of NSTEA and other MOEAs needs to be studied further. Using the number of functions evaluations as a measure was useful in comparing the computational needs for NSTEA and a single objective-based MO analysis. This measure alone is not sufficient to compare the computational gain, if any, that may be realized by NSTEA over the other MOEAs that use explicit Pareto optimality checks. As this is dependent on the
algorithmic steps beyond just function evaluation, timing studies based on equivalent
References
1. Brill, E.D., (1972). Economic efficiency and equity in water quality management, Ph.D. dissertation, Johns Hopkins University, Baltimore, Maryland.
2. Brill, E.D., Liebman, J.C., and ReVelle, C.,S., (1976). Equity measures for exploring water quality management alternatives, Water Resources Research, 12, pp. 845-851.
3. Cieniawski, S.E., Eheart, J. W., and Ranjithan, S., (1995). Using Genetic Algorithms to Solve a Multi-Objective Groundwater Monitoring Problem, Water Resources Research, vol. 31, no. 2, pp. 399-409.
4. Coello, C.A.C., Christiansen, A.D., and Aguirre, A.H., (1998). Using a New GA-Based Multiobjective Optimization Technique for the Design of Robot Arms, Robotica, 16(4), pp. 401-414
5. Coello, C. A. C., (1999a). A comprehensive survey of evolutionary-based multiobjective optimization techniques, Knowledge and Information System, 1(3), pp. 269-308.
6. Coello, C. A. C., (1999b). List of references on evolutionary multiobjective optimization.
Available: http://www.lania.mx/~ccoello/EMOO/EMOObib.html.
7. Coello, C.A.C. and Christiansen, A.D., (2000). Multiobjective optimization of trusses using genetic algorithms, Computers and Structures, 75(6), pp. 647-660.
8. Cohon, J.L., (1978). Multiobjective programming and planning, Mathematics in Science and Engineering, Vol. 140, Academic Press, Inc.
9. Fonesca, C.M., and Fleming, P.J., (1993). Genetic Algorithms for multiobjective
10.Fonesca, C.M, and Fleming, P.J., (1995). An overview of evolutionary algorithms in multiobjective optimization, Evolutionary Computation, 3(1), pp. 1-16.
11.Fylstra, D., Lasdon, L. S., Watson, J., and Waren, A. D., (1998). Design and use of the Microsoft Excel Solver, Interfaces, 28(5), pp. 29-55.
12.Hajela, P. and Lin, C.-Y.,(1992). Genetic search strategies in multicriterion optimal design,
Structural Optimization, 4, pp. 99-107.
13.Harrell, L. J. and Ranjithan, S., (1997). Generating Efficient Watershed Management
Strategies Using a Genetic Algorithms-Based Method, Ed: D. H. Merritt Proceedings of the 24th Annual Water Resources Planning and Management Conference (ASCE), Houston, TX, April 6-9, 1997, pp. 272-277.
14.Horn, J., and Nafpliotis, N. and Goldberg, D.E., (1994). A niched pareto genetic algorithm for multiobjective optimization, Proceedings of the First IEEE Conference on Evolutionary Computation, IEEE World Congress on Computational Intelligence, 1, pp. 82-87.
15.Horn, J., (1997). Multicriterion decision making, In Back, T., Fogel, D., and Michalewicz, Z., editors, Handbook of Evolutionary Computation, Volume 1, pp. F1.9:1-F.1.9:15, Oxford University Press, Oxford, England.
16.Jiménez, J. and Cadenas, J.M., (1995). An evolutionary program for the multiobjective solid transportation problem with fuzzy goals, Operations Research and Decisions, 2, pp. 5-20. 17.Knowles, J.D., and Corne, D.W., (2000). Approximating the Nondominated Front Using the
Pareto Archived Evolution Strategy, Evolutionary Computation, 8(2): pp. 149-172.
19.Loughlin, D.H., and Ranjithan, S., (1997). The neighborhood constraint method: a genetic algorithm-based multiobjective optimization technique, Proceedings of the Seventh International Conference on Genetic Algorithms, pp. 666-673.
20.Loughlin, D. H., Ranjithan, S., Brill, E. D., and Baugh, J. W., (2000a). Genetic algorithm approaches for addressing unmodeled objectives in optimization problems, to appear in
Engineering Optimization(in print).
21.Loughlin, D. H., Ranjithan, S., Baugh, J. W., and Brill, E. D., (2000b). Application of
Genetic Algorithms for the Design of Ozone Control Strategies, Journal of the Air and Waste Management Association, 50, June 2000, pp. 1050-1063.
22.Menczer, F, Degeratu, M., and Street, W. N., (2000). Efficient and scalable pareto
optimization by evolutionary local selection algorithms, Evolutionary Computation, 8(2), pp. 223-247.
23.Obayashi, S., Sasaki, D., and Hirose, N., (2000). Multiobjective Evolutionary Computation for Supersonic Wing-Shape Optimization, IEEE Transactions on Evolutionary Computation,
4(2), pp. 182-187.
24.Ritzel, B. J., Eheart, J. W., and Ranjithan, S., (1994). Using Genetic Algorithms to Solve a Multi-Objective Groundwater Remediation Problem, Water Resources Research, vol. 30, no. 5, pp. 1589-1603.
25.Schaffer, J.D., (1984). Multiple objective optimization with vector evaluated genetic algorithms, Ph.D. Thesis, Vanderbilt University.
27.Smith, E.T., and Morris, A.R., (1969). Systems Analysis for optimal water quality management, Journal Water Pollution Control Federation, 4(9), pp. 1635-1646.
28.Srinivas, N., and Deb, K., (1994). Multiobjective optimization using nondominated sorting in genetic algorithms, Evolutionary Computation, 2(3), pp. 221-248.
29.Thomann, R.V., (1963). Mathematical model for dissolved oxygen, Journal Sanitary Engineering Division, American Society of Civil Engineers, 89(SA 5), pp. 865-875. 30.Van Veldhuizen, D.A., and Lamont, G.B., (2000). Multiobjective evolutionary algorithms:
Analyzing the state-of-the-art, Evolutionary Computation, 8(2), pp. 125-147.
31.Winston, W.L., (1993). Operations research: applications and algorithms, Duxbury Press. 32.Zitzler, E., and Thiele, L., (1999). Multiobjective evolutionary algorithms: a comparative
case study and the strength pareto approach, IEEE Transactions on Evolutionary Computation, 3(4), pp. 257-271.