GOMEZ-ALPIZAR, LUIS E. Molecular Evolution of Phytophthora infestans (Mont.) de Bary, the late blight pathogen (Under the direction of Jean B. Ristaino).
Phytophthora infestans (Mont.) de Bary causes late blight of potato and tomato and is one of the world’s most devastating plant diseases. P. infestans left its footprint in human history when, in the 19th century, it was responsible for the Irish Potato Famine. Nuclear and mitochondrial DNA
variability was used to examine the population history of P. infestans. DNA sequence data from three nuclear regions (Intron Ras, Ras, and β-tubulin) and two mitochondrial regions (P3 and P4)
were obtained from ninety isolates from various locations including Brazil, Bolivia, Ecuador,
Peru, Costa Rica, Mexico (Toluca Valley), the USA and Ireland. Population summary statistics
show that the Mexican population from the presumed center of origin of P. infestans, harbored less nucleotide and haplotype diversity than South American populations, and was genetically
differentiated from other populations, particularly at the mitochondrial loci. Coalescent-based
genealogies of mitochondrial (rpl14, rpl5, tRNAs, cox1) and nuclear (Intron Ras+Ras) loci were congruent and demonstrated the existence of two lineages leading to the present day haplotypes
of P. infestans associated with potatoes. A third lineage, associated with a group of isolates from
Solanum tetrapetalum collected in the Andean Highlands of Ecuador was also found. In the mitochondrial genealogy the two potato lineages corresponded to the mitochrondrial haplotypes
Type I and Type II described elsewhere. Mitochondrial haplotypes were associated with different
nuclear backgrounds. Haplotypes found in the Toluca Valley population were derived from only
one of the two lineages in both mitochondrial and nuclear genealogies, whereas haplotypes found
populations were not genetically differentiated from the Peruvian populations, suggesting a
common ancestry among these populations. Evidence for recombination was found for Mexican
and USA populations. Solanum tetrapetalum isolates were highly polymorphic within the
regions analyzed and may be a new species. The results support a South American origin of P.
BLIGHT PATHOGEN
by
LUIS E. GOMEZ-ALPIZAR
A dissertation submitted to the Graduate Faculty of
North Carolina State University
in partial fulfillment of the
requirements for the Degree of
Doctor of Philosophy
PLANT PATHOLOGY
Raleigh
2004
APPROVED BY:
______________________________ _____________________________ Dr. Trudy Mackay Dr. Jeffrey Thorne
Biography
Fulbright-Laspau and began his doctoral work in Plant Pathology under the guidance of Dr. Jean B.
Ristaino at North Carolina State University in August 2000. Luis is married to Ruth Villanueva,
Dedication
This work is dedicated to my beloved wife Ruth for her love, devotion, patience, support, and encouragement during our life together, and to my two sons, Esteban and Samuel, who remind
ACKNOWLEDGEMENTS
I would like to express my most sincere thanks to all those people who in one way or another helped me to succesfully complete my dissertation. To the members of my advisory committee: Dr. Jean B. Ristaino, Dr. Trudy Mackay, Dr. Jeff Thorne, and Dr. Marc Cubeta for their advice and support throughout my Ph.D. program. A special “thank you” to Dr. Ristaino for giving me the opportunity to work in her lab and achieve this important step of my professional career. I also thank Dr. Ignazio Carbone (Dept. Plant Pathology) for his advice and help with the data analysis, particularly with the use of his SNAP Workbench program. Thanks also to Dr. Kenneth Olsen (Dept. Genetics) for his wise comments focused on the results of this research.
I also appreciate to all former and current members of Dr. Ristaino’s lab: Greg, Jens, Debbie, Rachel, Andrea, Tya, Pia, Chris, Josie, Katrina, Monica, Dr. “Luck”, Dr. K. May, Dr. B. Liu, Dr. A. Cafe-Fihlo, and Dr. C. Avila-Adame for their encouragement, support, and fun time together. This appreciation is also extended to the graduate students of the Plant Pathology Department at NCSU, special recognition to Cristina, Veronica, Maria, Tania, Mui-Yun, Sang-Hoon, and Eddie.
I would also like to thank Dr. D. Ritchie for his support and good advices as Director of the Graduate Program. A special “thank you” to Josh McIntyre for his assistance and friendship. My appreciation to faculty members and staff, too.
I express my gatitude to the members of the Cary Christian Assambly for their love and care during my stay in Raleigh. Last but not least, I want to thank my family for their inconditional love, confidence and support that have been a source of strenght throughout my life: to my parents, Enrique and Lidieth; my parents-in-laws, Virgilio and Ruth; my sisters, Sandra and Lorena; and my brother and sisters-in-laws, Noe, Raquel, and Desiree.
I thank the Almighty God for His grace and mercy for without Him, I would not be able to complete this work.
TABLE OF CONTENTS
LIST OF TABLES...…...ix
LIST OF FIGURES...xi
CHAPTER ONE ... 1
POPULATION HISTORY OF PHYTOPHTHORA INFESTANS INFERRED FROM NUCLEAR AND MITOCHONDRIAL DNA SEQUENCES ... 1
Abstract... 1
Introduction... 2
Materials and Methods... 7
Isolates ... 7
DNA isolation, amplification and sequencing ... 8
Sequence analysis ... 9
Phytophthora infestans and assumptions for phylogenetic inference ... 11
Data analysis ... 12
Neutrality tests and population subdivision... 13
Coalescent analysis ... 15
Results... 17
DNA sequence variability... 17
Nucleotide diversity... 19
Tests of neutrality and population subdivision ... 21
Coalescent analysis ... 24
Discussion... 27
Geographic origin of the ancestral population... 28
Source of origin of the isolates of P. infestans that caused early epidemics ... 35
Evolution of mtDNA haplotypes of P. infestans ... 37
Sexual reproduction and variability in P. infestans ... 39
Host-adaptation... 40
References cited... 43
Figure legends... 55
Appendix... 72
CHAPTER TWO ... 73
Abstract... 73
Introduction... 74
Materials and Methods... 79
Isolates ... 79
Preparation of DNA ... 79
Identification of Ecuadorian isolates ... 80
DNA amplification and sequencing... 81
Phylogenetic analysis... 83
Results... 84
Discussion... 86
References cited... 92
Figure legends... 100
CHAPTER THREE ... 105
GENETIC STRUCTURE OF POPULATIONS OF PHYTOPHTHORA INFESTANS FROM COSTA RICA... 105
Abstract... 105
Introduction... 106
Materials and Methods... 108
Collection of isolates... 108
Isolation of the pathogen... 109
Mating type ... 109
Metalaxyl sensitivity... 110
Allozyme analysis... 111
Mitochondrial DNA haplotype ... 111
DNA fingerprinting... 112
DNA sequencing... 112
Results... 113
Mating type ... 113
Metalaxyl sensitivity... 114
Allozyme genotypes... 114
Mitochondrial DNA haplotype ... 114
DNA fingerprinting... 115
DNA sequencing... 115
Discussion... 115
Acknowledgements... 123
Reference cited... 124
LIST OF TABLES
CHAPTER ONE
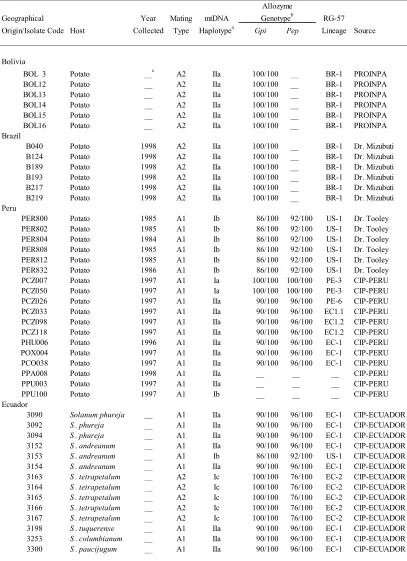
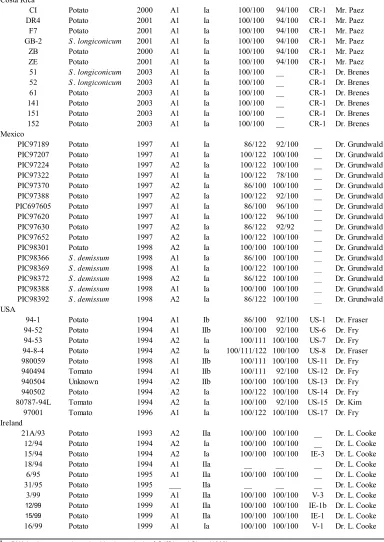
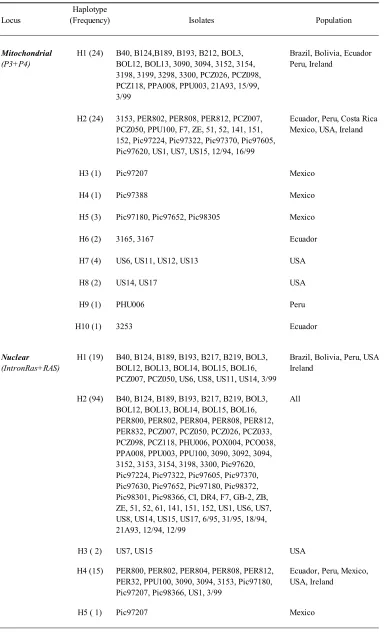
Table 1. 1 Isolates of Phytophthora infestans used in this study...57
Table 1. 2 Primers used in this study... ...59
Table 1. 3 Characteristics of the loci studied...60
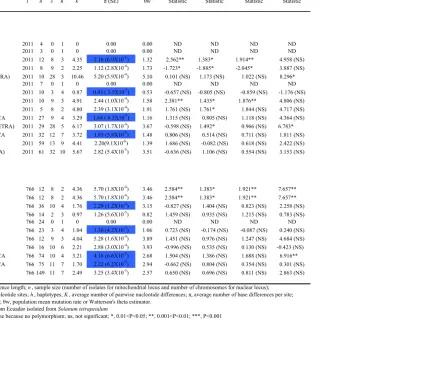
Table 1. 4 Diversity estimates and neutrality tests ...61
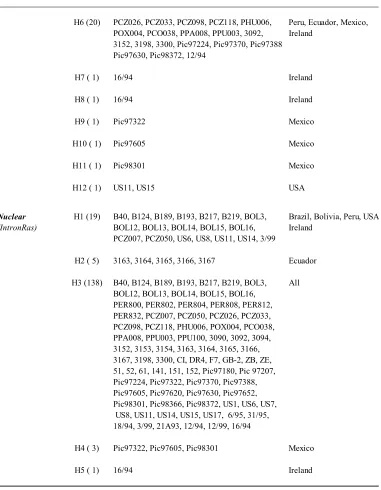
Table 1.5 Distribution of haplotypes……...……… ………...62
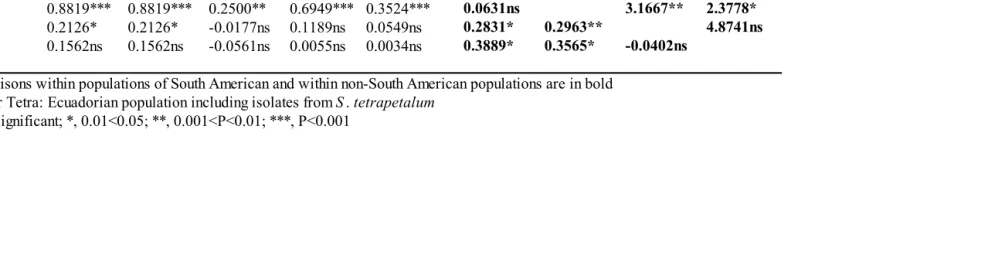
Table 1.6 Population subdivision at nuclear loci according to Hudson´s test statistics Ks (upper right matrix) and Kst (lower left atrix)…………...………...64
Table 1.7 Population subdivision at mitochondrial loci according to Hudson´s test statistics Ks (upper right matrix) and Kst (lower left matrix)………...64
Table 1. 8 Identity of haplotypes ...63
CHAPTER TWO Table 2.1 Diversity of P. infestans sensu lato on Solanaceous plants in Ecuador (Adler et al. 2004)………...97
Table 2.2 Isolates of P. infestans sensu lato from Ecuador and P. infestans used in this study………...97
Table 2. 3 Isolates of Phytophthora spp. used in this investigation and GenBank accession numbers for cox 1 sequences ...98
CHAPTER THREE
Table 3. 1 Isolates of Phytophthora infestans collected from potato and wild Solanum in Costa Rica and tested for metalaxyl sensitivity, mating type,
mitochondrial DNA (mtDNA) haplotype and allozyme genotype ...29 Table 3. 2 Sensitivity to metalaxyl of isolates of Phytophthora infestans collected
LIST OF FIGURES
CHAPTER ONE
Figure 1. 1 Phytophthora infestans Ras gene organization showing location
of sequenced regions and the NruI restriction site...67
Figure 1. 2. A) Intron Ras sequence chromatograms of Phytophthora infestans showing sites with double bands (peaks) indicating heterozygotes, F: Forward; R: Reverse; B) NruI restriction digestion of RAS PCR
products from P. infestans isolates. Lanes 2 and 3) CR-51 and CR-52 (homozygotes). Lanes 3 and 4) PER 800 and PER 832 (heterozygotes). Lanes 1 and 6) 100 bp ladder. C) NcoI restriction digestion of
β-Tubulin PCR products from P. infestans isolates. Lane 2) Undigested PCR product. Lanes 3, 4 and 5) BOL -3, BOL-6, and BOL-14
(heterozygotes). Lanes 6 and 7) US-13 and US-14 (heterozygotes).
Lanes 8 and 9) PIC97620 and PIC97224 (homozygotes). Lanes10 and 11)
CR-52 and CR-61 (heterozygotes). Lanes 1 and 12) 100bp ladder...68 Figure 1. 3 Coalescent-based genealogy with the highest root probability
showing the distribution of mutations for the mitochondrial (P3+P4) region of Phytophthora infestans. The inferred genealogy is based on 10 different starting random number seeds, using 5 million simulations of the coalescent for each run. All runs converged to the same genealogy. The time scale is in coalescent units of effective population size. In the gene genealogy, the direction of divergence is from the top of the genealogy (oldest, i.e, the past) to the bottom (youngest, i.e., the present); coalescent is from the bottom (present) to the top (past). Since the gene genealogy is rooted, all the mutations and bifurcations are also time ordered from top to bottom. The numbers below the tree from top to bottom designate each distinct haplotype and its frequency (i.e., the number of occurrences of the haplotype in the sample), the frequency of each haplotype in each population, the mating type of the isolates in the haplotype, and the Carter’s mtDNA haplotypes determined by PCR-RFLP method (Griffith and Shaw,
1998). Circles designated replacement substitutions...69 Figure 1. 4 Coalescent-based genealogy with the highest root probability
showing the distribution of mutations for the Intron Ras region of Phytophthora infestans. The inferred genealogy is based on 10 different starting random number seeds, using 5 million simulations of the coalescent for each run. All runs converged to the same
size. In the gene genealogy, the direction of divergence is from the top of the genealogy (oldest, i.e, the past) to the bottom (youngest, i.e., the present); coalescent is from the bottom (present) to the top (past). Since the gene genealogy is rooted, all the mutations and bifurcations are also time ordered from top to bottom. The numbers below the tree from top to bottom designate each distinct haplotype and its frequency (i.e., the number of occurrences of the haplotype in the sample), the frequency of each haplotype in each population, the mating type of the isolates in the haplotype, and the Carter’s mtDNA haplotypes determined by PCR-RFLP method (Griffith
and Shaw, 1998)...70 Figure 1. 5 Coalescent-based genealogy with the highest root probability
showing the distribution of mutations for the Intron Ras + Ras (IRRAS) region of Phytophthora infestans. The inferred genealogy is based on 10 different starting random number seeds, using 5 million simulations of the coalescent for each run. All runs converged to the same genealogy. The time scale is in coalescent units of effective population size. In the gene genealogy, the direction of divergence is from the top of the genealogy (oldest, i.e, the past) to the bottom (youngest, i.e.,
the present); coalescent is from the bottom (present) to the top (past). Since the gene genealogy is rooted, all the mutations and bifurcations are also time ordered from top to bottom. The numbers below the tree from top to bottom designate each distinct haplotype and its frequency (i.e., the number of occurrences of the haplotype in the sample), the frequency of each haplotype in each population, the mating type of the isolates in the haplotype, and the Carter’s mtDNA haplotypes determined by PCR-RFLP method (Griffith
and Shaw, 1998)...71 Figure 1. 6. A Neighbor-joining phylogenetic unrooted tree based on the
complete mtDNA sequence from the four extant mitochondrial haplotypes of P. infestans. Boostrap values based on 1000
replicates are shown at branches...72
CHAPTER TWO
Figure 2. 1 DNA amplified with PINF/ITS5 from isolates of Phytophthora infestans sensu lato from Ecuador, and P. infestans and P. mirabilis. Lanes 2, 3, 4, and 5: PINF amplification products of isolates from Solanum tetrapetalum (EC3163, EC3164, EC3165, EC3167). Lane 6: isolate EC3090 from S. phureja. Lane 7: Isolate EC3154 from
EC3300 from S. paucijugum. Lane 11: isolate 94-1 (US-1) from S. tuberosum. Lane 12: P. mirabilis. Lane 13: no template DNA control. Lanes 1 and 14 contain a 100-bp DNA ladder.
Middle band in the ladder with greater intensity is 600bp fragment...101 Figure 2. 2 Restriction enzyme analysis with A) RsaI; B) MspI; and C) AluI
of DNA amplified with primer pair ITS5 and ITS4 from P. infestans sensu lato from Ecuador, P. infestans, and P. mirabilis. Lanes 2, 3, 4, and 5: Isolates EC3163, EC3164, EC3165, EC3167 from
Solanum tetrapetalum. Lane 6: isolate EC3090 from S. phureja. Lane 7: Isolate EC3154 from S. andreanum. Lane 8: Isolate EC3199 from S. tuquerene. Lane 9: Isolate EC3253 from S. columbianum. Lane 10: Isolate EC3300 from S. paucijugum. Lane 11: isolate 94-1 (US-1) from S. tuberosum. Lane 12: P. mirabilis. Lane 13: no template DNA control. Lanes 1 and 14 contain a 100-bp DNA ladder. Middle band in the ladder with greater intensity
is 600bp fragment...102 Figure 2. 3 Neighbour-joining tree illustrating phylogenetic relationship
among Phytophthora species, including the Ecuadorian isolates of P. infestans sensu lato from S. tetrapetalum, based on the sequence of a fragment of the cox 1 gene from the mitochondrial genome. The tree was constructed using corrected Kimura 2-parameter distances and 1000 replicates. Gaps were handled using pairwise deletion. Numbers along the branches indicate bootstrap values.
Scale bar unit: number of nucleotide substitutions per site...103 Figure 2. 4 Neighbour-joining tree illustrating phylogenetic relationship
among Phytophthora species, including the Ecuadorian isolates of P. infestans sensu lato from S. tetrapetalum, based on the sequence of an intron of the single-copy Ras gene from the nuclear genome. The tree was constructed using corrected Kimura 2-parameter distances and 1000 replicates. Gaps were handled using pairwise deletion. Numbers along the branches indicate bootstrap values. Scale bar unit:
number of nucleotide substitutions per site...104
CHAPTER THREE
Figure 3. 1 Locations of the two major sampling areas in Costa Rica...133 Figure 3.2 Cellulose-acetate gel stained for Glucose-6-phosphate isomerase (Gpi)
lane 11) US-1 (86/100). B) Gpi genotypes of P. infestans isolates are in lanes from left to right: lane 1) US-6 (100/100); lanes 2, 8 and 9) US-1 (86/100); lane 3) US-7 (100/111);lane 4) US-8 (100/111/122); lanes 5 and 7) Costa Rican isolate 120 (100/111/122), lane 6) Costa Rican isolate 154 (100/111/122); lanes 10, 11 and 12) Costa Rican isolates TB-1, TB-2 and RM (100/100). C) Pep genotypes of P. infestans isolates are in lanes from left to right: lane 1) Mexican isolate Pic97605 (92/100), lanes 2 and 4) Costa Rican isolates ZE and CT (94/100), lane 3) Mexicann isolate Pic97310 (92/100), lane 5) Mexican isolate Pic97605 (92/100); lane 6) Mexican isolate
Pic98366 100/100)...134
Figure 3. 3 Mitochondrial DNA polymorphisms revealed by PCR-RFLP of Costa Rican isolates of Phytophthora infestans. A) PCR amplification with primer pair F4/R4 and digestion with EcoRI. B) PCR amplification with primer pair F2/R2 and digestion with MspI. Lanes 2-5 are control isolates of the Ia, Ib, IIa, and IIb haplotypes digested with Ecor1 and MspI respectively. M = molecular marker, 100 bp...135
Figure 3. 4 DNA fingerprint patterns with RG57 probe of Phytophthora infestans. Lane 1, US-1 genotype; Lane 2, US-8 genotype; Lanes 3 and 4, US-18 genotype, Lanes 5 to 9 Costa Rican isolates of the most common allozyme genotype found. RG57 fingerprint band numbers are
CHAPTER ONE
POPULATION HISTORY OF PHYTOPHTHORA INFESTANS INFERRED FROM
NUCLEAR AND MITOCHONDRIAL DNA SEQUENCES
Abstract
Nuclear and mitochondrial DNA variability was used to examine the population history
of P. infestans. DNA sequence data from three nuclear regions (Intron Ras, Ras, and β
-tubulin) and two mitochondrial regions (P3 and P4) were obtained from ninety isolates
from various locations including Brazil, Bolivia, Ecuador, Peru, Costa Rica, Mexico
(Toluca Valley), the United States (USA) and Ireland. Population summary statistics
show that the Mexican population from the presumed center of origin of P. infestans,
harbored less nucleotide and haplotype diversity than South American populations, and
was genetically differentiated from other populations, particularly at the mitochondrial
loci. Coalescent-based genealogies of mitochondrial loci (rpl14, rpl5, tRNAs, cox1) and
nuclear locus (Intron Ras+Ras) were congruent and demostrated the existence of two
lineages leading to the present day haplotypes of P. infestans associated with potatoes. A
third lineage, associated with a group of isolates from Solanum tetrapetalum collected in
the Andean Highlands of Ecuador was also found. In the mitochondrial genealogy, the
two potato lineages corresponded to the mitochrondrial haplotypes Type I and Type II
described elsewhere. The same mitochondrial haplotype was associated with different
nuclear backgrounds. Haplotypes found in the Toluca Valley population were derived
whereas haplotypes found in South American populations (Peru and Ecuador) were
derived from both lineages. Haplotypes found in USA and Ireland populations were also
derived from both lineages and these populations were not genetically differentiated from
Peruvian population, suggesting a common ancestry among these populations. Evidence
for recombination was found for Mexican and the USA populations. Solanum
tetrapetalum isolates were highly polymorphic within the regions analyzed and may be a
new species. The results support a South American origin of P. infestans and are
discussed in relation of previous hypotheses regarding the geographic origin of this plant
pathogen.
Introduction
Phytophthora infestans (Mont.) de Bary causes late blight of potato and tomato and is
one of the world’s most devastating plant diseases. The annual economic cost in
developing countries alone is estimated at $3.25 billion, with approximately $750 million
spent on fungicides (GILB 2004). P. infestans left its footprint in human history when, in
the 19th century, it was responsible for the Irish Potato Famine, which caused the
starvation and death of more than one million people, precipitating a massive migration
from Ireland to North America. Soon after this catastrophe, the speculation about the
origin of P. infestans began. Since then, three theories have been proposed to describe the
center of origin and/or the source of inoculum of P. infestans: the Andean theory (Abad
and Abad 1997), the Mexican theory (Niederhauser 1991, Goodwin et al. 1994) and the
The Andean theory considers the northern part of the South American Andes
(currently Peru and Bolivia), the center of origin of the cultivated potato (Volkov et al.
2003), as both the center of origin of P. infestans and the source of inoculum for the 19th
century late blight epidemics (Abad and Abad, 1997). Berkeley (1846) and de Bary
(1861), pioneers in the discipline of plant pathology, also believed that the pathogen
originated in the center of origin of the host. However, difficulties in proving the ancient
presence of the disease in the Andes (Niederhauser 1991) along with observations that
South American wild species did not possess major genes (R) for race-specific resistance
to late blight (Reddick, 1939, Niederhauser 1991), and the low genetic variability found
in a limited sample of isolates of P. infestans from potatoes growing in the central
highlands of Peru (Tooley et al. 1989) weakened this theory.
The Mexican theory proposes the central highlands of Mexico, which includes the
Toluca Valley, as the center of origin and the place from where the pathogen spread to
other parts of the world (Niedarhauser 1991, Goodwin et al. 1994). This theory is the
most commonly accepted because both mating types (A1 and A2) are present; there is a
high genetic diversity for P. infestans, and wild potatoes show high levels of resistance,
mainly qualitative resistance, in that region. Other species closely related to P. infestans:
P. mirabilis, P. phaseoli, and P. ipomoae have been found there. According to the
Mexican theory the first migration from Mexico to the United States (USA) occurred in
infected tubers of wild potato species (Goodwin et al. 1994). No commercial potato
production was known in Mexico in the 1840s (Bourke 1964). The pathogen was then
(Goodwin et al. 1994.). Apparently, as a consequence of a strong bottleneck a single
clonal lineage, called the US-1, became dominant in the populations of P. infestans
outside central Mexico. The US-1 is the A1 mating type and a Ib mitochondrial DNA
(mtDNA) haplotype (Goodwin et al. 1994, Gavino and Fry 2002).
The Three-Step or Hybrid theory proposes that Mexico represents the center of
origin of the late blight pathogen, but the source of inoculum for the 19th century
epidemics in Europe and the USA originated from the South American Andes (Tooley et
al. 1989; Andrivon 1996). According to this theory, P. infestans migrated first from
Mexico to South American Andes centuries ago. This theory was presented to reconcile
the fact that cultivated potatoes were not grown in Mexico in the 1840s and the US-1
genotype was found panglobally distributed (Andrivon 1996). Peru and other Andean
countries exported bat guano for fertilizer and potato seed on steamships to the USA and
Europe in the 1840s.
Some researchers (Erselius et al. 1999, Adler et al. 2004) have noted that the
above theories are based primarily on studies, with isolates of P. infestans from potato
and to a lesser extent tomato. Both are important crops in temperate zones where most of
the research has been conducted. A recent body of information, however, has challenged
the present knowledge of P. infestans population history (Abad et al. 2002). First, until
recently, most isolates of P. infestans outside Mexico belonged to the US-1 clonal lineage
(Goodwin et al. 1994). This led to the hypothesis that the US-1, considered as a migrant
from Mexico, represented the ancestral type of P. infestans and caused the original
analysis of mtDNA of P. infestans specimens taken from historical herbarium samples
collected around the time of the famine showed that the Ib mtDNA was not present in the
samples (Ristaino et al. 2001, May and Ristaino 2004). The Ia haplotype was found in a
worldwide collection of the 19th century samples and in the oldest samples from the
famine epidemics (May and Ristaino 2004). More recent samples from the Andean
region in Ecuador and Bolivia were the Ib haplotype (May and Ristaino, 2004). In
addition, surveys in the Toluca Valley and other parts of Mexico failed to find the US-1
genotype in extant Mexican populations of P. infestans (Gavino and Fry 2002; Flier et al.
2003). The Ia mtDNA haplotype was the only haplotype found in the Toluca Valley
(Flier et al. 2003). This haplotype is also present in South American populations of P.
infestans (Perez et al. 2001). Second, evidence has been presented (Ordoñez et al. 2000,
Adler et al. 2004) that the Ecuadorian highlands harbor a wide genetic diversity within P.
infestans sensu lato that infect wild Solanum and had not been detected in studies
performed elsewhere on pathogen populations that attack potato and tomato. Both mating
types (A1 and A2) were found in a common host, pear melon (S. muricatum), and the
presence of a new mtDNA was also found there (Ordoñez et al. 2000, Adler et al. 2002,
2004). New genotypes of P. infestans have been also found in Peru in a nationwide
survey, although only the A1 mating type was detected (Perez et al. 2001). Recent studies
indicate that P. infestans populations in the main potato late blight areas in Bolivia are
entirely A2 mating type and complex, with an average of seven virulence genes (Navia et
al. 2001; Fernandez-Northcote and Plata, 1998). Third, evidence is growing that R genes,
occur in potatoes indigenous to South America (Perez et al. 2000; Trognitz et al. 1996).
Taken together the new evidence indicates that the genetic variability of P. infestans in
South America is higher than previously realized. The possibility still exists that the
pathogen originated in the Andean region, perhaps in co-evolution with potato’s wild
relatives among the Solanum species (CIP, 2002).
Over the past decade, studies of DNA sequence variability have been applied to
study the geographic origin and population history of diverse taxa including plants,
animals, fungi, and humans. This has been most notable within the field of
phylogeography, a discipline concerned with the demographic, behavioral, and historical
factors influencing the geographic distributions of gene lineages (Avise et al. 1987; Hare
and Avise, 1998, Avise 2000). Rapidly evolving and non- recombining cytoplasmic DNA
(mitochondrial and chloroplastic) has been used as markers of choice, but recently
nuclear genes have been studied (Hare 2001; Emerson et al. 2001). There is a general
agreement that the combined use of both mitochondrial and nuclear DNA sequences may
provide a better understanding of the phylogeographic structure of species as well as
populations. Principles of genealogical concordance have been developed as conceptual
guides to relate significant partitions in gene trees to significant historical partitions at the
level of organismal phylogeny (Avise and Ball, 1990, Hare and Avise, 1998). This
approach has not been yet applied to study the population history of P. infestans,
although recently the first multi-gene based phylogeny of Phytophthora species,
In this article we describe a population genetic and phylogeographic analysis
using mitochondrial and nuclear genes to investigate the origin of Phytophthora
infestans. Two questions are addressed: i) Does mitochondrial and nuclear DNA evidence
justify the specific hypothesis that a common ancestor of P. infestans originated in South
American or Mexican populations? and ii) What can be inferred about the geographic
origin of the inoculum that caused the early epidemics of the 19th century?
Materials and Methods
Isolates
Ninety-one isolates of Phytophthora infestans were obtained from eight geographical
locations (populations), including countries associated with the origin and migration
theories. The isolates were collected by different scientists from 1984 to 2003 (Table
1.1). Six to eighteen isolates per region were used. Most of the isolates have been
characterized for mating type; mitochondrial DNA (mtDNA) haplotype, allozyme
genotypes, glucose-6-phosphate isomerase (Gpi) and Peptidase (Pep); and DNA
fingerprint using the RG-57 probe by the collectors and represent the degrees of genetic
and phenotypic diversity found in each location based on these phenotypic and molecular
markers. In this study isolates were examined for mtDNA haplotype and allozyme
genotype Gpi using standard protocols (Griffith and Shaw, 1998; Goodwin et al. 1995).
The isolates were obatained predominately from potato (Solanum tuberosum). Isolates
from Ecuador were obtained from different species of Solanum (Adler et al. 2004). The
presumed center of origin of P. infestans according to two theories (Niederhauser 1991;
Goodwin et al. 1992, Andrivon 1996). Isolates were maintained on rye B agar medium
(Caten and Jinks, 1968) or rye-V8 agar medium at 18 °C.
DNA isolation, amplification and sequencing
Isolates were grown in 90-mm plates containing pea broth (300 g frozen garden peas
boiled for 10 min in 1 liter distilled water) for 2 to 4 weeks at 18 °C. Total DNA was
extracted from dried mycelium by using a cetyltrimethylammonium bromide (CTAB,
Sigma Chemical Co., St. Louis, MO, USA) protocol (Ristaino et al. 2001). DNA was
diluted 1:10 or 1:100 (3 to 10 ng/ µl) for all PCR reactions.
Two regions of the mitochondrial genome (P3 and P4) and portions of two
single-copy nuclear genes, RAS and B-tubulin, were amplified via polymerase chain reaction
(PCR). P3 region includes the genes rp114, rp15, and tRNAs. P4 region includes a part of
the cox 1 gene. Two regions of the RAS gene were amplified, intron 1 (223 bp) located in
the 5’ untranslated region of the gene and a 600 bp portion covering part of exon 3, exon
4, exon 5, part of exon 6 and introns 3 and 4 (Figure 1.1). The PCR primers, their
location on the GenBank accession on which the primer is based and the source are
shown in Table 1.2. Two 50-µl reactions were carried out per primer set and isolate.
Each reaction contained 1X PCR buffer (Invitrogen, Carlsbad, CA), 2.75mM MgCl2, 1
unit Taq polymerase (Invitrogen), 200 µM each dNTP, 0.4 µM each forward and reverse
primer, 160 µg/µl BSA (20 mg/ml, Roche, Mannheim, Germany) and ~ 5-10 ng genomic
cycles of 94˚ (40 sec), 55˚ (1 min), 72˚ (1.5 min); and a final extension of 72˚ (10 min).
For nuclear genes, 96˚ (1 min); then 35 cycles of 96˚ (1 min), 55˚ (1 min), 72˚ (2 min);
and a final extension of 72˚ (10 min). The two PCR products were pooled and purified
with QIAquick PCR Purification Kits (QIAGEN, Valencia, CA). Purified fragments were
sequenced directly on both strands by using the same primers as those used in the initial
amplification. Sequencing reactions were prepared using the ABI PRISM® BigDye
Terminator Cycle Sequencing Ready Reaction Kit and analyzed on an ABI PRISM® 377
automated sequencer (Applied Biosystem, Foster City, CA).
Sequence analysis
All sequences were aligned manually and edited using BioEdit (Hall 1999). Multiple
sequence aligment was also performed in Clustal X (Thompson et al. 1997). All
polymorphims were rechecked from the chromatograms. For Ras and B-tubulin genes,
sites showing the presence of two coincident peaks in the forward and reverse sequence
chromatograms were observed (Figure 1.2), indicating heterozygous positions, as a result
of the coamplification and simultaneous sequencing of two complementary loci. Isolates
of P. infestans are diploid (Brasier 1992) and show disomic inheritance (Tooley et al.
1985; Spielman, 1991), such that individuals can be either homozygous (single peak) or
heterozygous (double peak) at some loci. Scoring of most heterozygotes was
accomplished by reading double-peaked variable sites directly from the chromatograms.
The identity of the two haplotypes within the heterozygote was then inferred by using
Clark’s “haplotype subtraction” algorithm (Clark 1990), whereby the heterozygote
double-peaked sites can be accounted for. Most of the isolates examined were either
homozygous or heterozygous at a single site, yielding unambiguous haplotype solutions.
When the isolates were heterozygous at more than one site, preference was given to
combinations involving known haplotypes of higher regional population frequency (Le
Jossec et al. 2004).
Sequence analysis showed that some heterozygosities in the amplified PCR
products of RAS and B-tubulin genes resulted in the creation of a Nru I and of an Nco I
restriction sites in one of the alleles, respectively. No Nru I or Nco I restriction sites were
found anywhere else in each of the whole gene fragment. To ascertain the accuracy of
determination of heterozygosity, the correspondent gene fragment was digested for 4 h at
37°C with Nru I (Promega, Madison, WI) or Nco I (New England Biolabs) in a 30-µl
reaction volume containing 10 µl PCR product, 3 µl of 10 x buffer (supplied with the
enzyme), and 1.5 ul of 12 U/µl Nru I or 10 U/µl Nco I, respectively. Digestion products
were loaded onto a 1.6% agarose gel containing ethidium bromide (1.0 µg/ml). TBE (45
mM Tris Borate, 1 mM EDTA, pH 8.3) was used as the running buffer, and a 100-bp
ladder (Invitrogen) was used as molecular size markers. DNA bands were visualized by
Phytophthora infestans and assumptions for phylogenetic inference
Several assumptions are key in estimating the evolutionary history from DNA sequence
data: no selection, a lack of recombination, random mating within a single population,
and random sampling (Emerson et al. 2001). These assumptions have been taken into
account for developing different programs to estimating gene genealogies and
demography histories. Violations of the assumptions can affect the results and their
interpretations. Due to recombination, for example, different segments within a haplotype
will have independent evolutionary histories. Ignoring recombination can undermine
phylogeny reconstruction by introducing homoplasy (Emerson et al. 2001, Hare, 2001,
Hey and Machado, 2003).
Phytophthora infestans is heterothallic and requires two compatibility types
(=mating types), designated A1 and A2, to complete the sexual stage (Brasier 1992). P.
infestans regularly completes the sexual stage (outcross) only in central Mexico (Toluca
Valley), and there is evidence of sexual reproduction in some European countries and the
USA in recent years. Anywhere else populations of P. infestans reproduce clonally and
one or several clonal lineages are present. Therefore the assumption of random mating
within a single population does not apply for populations of P. infestans outside central
Data analysis
Data analysis was performed using the Java program SNAP Workbench (Price
and Carbone, 2003) and following several steps outlined by Carbone et al. (2004). SNAP
Workbench manages and coordinates a series of other programs used for phylogenetic as
well as migration analyses. An important functionality of the SNAP Workbench is the
implementation of protocols consisting of a defined set of programs, assumptions, and
parameter settings for following different paths during the analysis (Carbone et al. 2004).
After aligning the DNA sequences of each locus, sequences were collapsed into unique
haplotypes removing insertions and deletions (indels) and excluding infinite-sites
violations using SNAP Map (Aylor and Carbone 2003). Base substitutions were
categorized as phylogenetically informative or uninformative, transitions vs
transversions, and replacement vs. synonymous amino acid changes in the coding region.
A phylogenetic analysis with unweighted parsimony was performed using PHYLIP
(Felsenstein 1993); if the heuristic searches yielded two or more equally parsimonious
trees, a strict consensus tree was inferred.
To examine the overall support or conflict among the variable sites in the DNA
sequence alignment, compatibility matrices were generated for the entire alignment of
each locus as well as for all subsets of haplotypes that share a common ancestor in the
consensus tree using SNAP Clade (Markwordt et al. 2003). Compatibility matrices were
graphically illustrated using SNAP matrix (Markwordt et al. 2003) and examined for the
existence of two or more identical pattern of compatibility/incompatibility. Clusters of
blocks were evident two different paths were followed. In one path, recombination
block boundaries and the minimum number of recombination events were identified
using RecMin (Myers and Griffiths 2003). The putative recombination boundaries
identified within each recombining clade from RecMin were used as a guide to identify
the common or shared recombination block boundaries among all clades. The
nonrecombining blocks were collapsed again into unique haplotypes using SNAP Map.
When detectable recombinants were few, they were removed from the analysis. In the
second path, RecPars (Hein, 1990) was used to infer the number of recombinant
segments (i.e. recombination blocks) in each locus data set. Two non-recombinant
blocks were defined, one formed by the mitochondrial regions P3 and P4 and other by the
two segments of the Ras gene (Intron Ras + Ras) and were used for reconstructing gene
genealogies. The nuclear locus did not include the variable site found in B-tubulin gene
because of its incompatibility with other sites.
Neutrality tests and population subdivision
After no recombining blocks were defined, the DNA sequences were analyzed in DnaSP
4 (Rozas and Rozas, 1999). For each locus in each population the population mutation
parameter per nucleotide site θ using Watterson’s (1975) estimate θw, based on the
number of segregating sites, s, and the average pairwise nucleotide diversity, π (Tajima,
1983) were estimated, and different tests of neutrality (Tajima, 1989; Fu & Li, 1993; Fu
1997) were performed in order to determine whether the data were consistent with the
constant population size, no recombination and no migration, that each sample is taken
from a single randomly mating population and random sampling. The latter assumption is
violated in this study, particularly for the USA sample, since different previously
characterize US genotypes were included in equal number. The consequences of violating
this assumption are considered in the Results and the Discussion. The tests were
performed on the two non-recombining blocks. Departures from neutrality may be caused
by demographic forces such as population growth, contraction, and subdivision (Fu 1996,
1997; Simonsen et al. 1995) or by the effect of diversifying or directional selection on
linked sites (genetic hitchhiking, Fu 1997). Carbone et al. (2004) distinguished among
population growth and background selection by comparing Tajima’s D, Fu and Li’s D*
and F* and Fu’s Fs tests. If only Fu and Li’s D* and F* are significant background
selection is assumed (Fu 1997). If only Tajima’s D and Fu’s Fs are significant there is
evidence for population growth or genetic hitchhiking. Small sample size of individual
populations limits the power of these tests (Simonsen et al. 1995). To increased the
sample size the eight initial populations were also analyzed as a POOLED (all
populations combined); as two populations South America (SA: Brazil, Bolivia, Peru,
and Ecuador) and non South America (NSA: Costa Rica, Mexico, the USA, and Ireland);
and as a four populations: Brazilian and Bolivian isolates (BRABO), Peruvian and
Ecuadorian isolates (PEECU); Mexican and Costa Rican isolates (MECO); and USA and
Irish isolates (USIR). The criteria for amalgamating were geographical location
(sampling areas), sharing of genotypes (Table 1.1), and relation with migration theories
Genetic differentiation among populations (individual and as a group) was
analyzed using SNAP Map and Permtest (Hudson et al. 1992a,b) as implemented in the
SNAP Workbench (Carbone et al. 2004). This analysis was also performed using
DnaSP4 (Rozas and Rozas, 1999). The Permtest was done using a nonparametric
permutation method based on Monte Carlo simulations. Hudson’s test statistics (KST, KS,
and KT) were calculated for each recombining block and again for the entire data set.
Testing the hypothesis of no genetic differentiation is an important first step and
determines whether a panmictic or a subdivided population model is assumed for
examining population divergence using Genetree and recombination parameter
estimation using Recom58 (Griffiths and Marjoram 1996).
Coalescent analysis
If evidence for geographic subdivison was found, the observed patterns of genetic
divergence were further explored to determine whether there was evidence for constant
migration among populations or shared ancestral polymorphisms followed by population
divergence but no migration. Two migration models were used for this analysis. First,
MDIV was used to test for equilibrium migration vs. shared ancestral polymorphisms
between two subdivided populations (Nielsen and Wakeley 2001). The approach of
Nielsen and Wakeley (2001) uses either an infinite sites or a finite sites model without
recombination and implements both likelihood and bayesian methods using Markov
chain Monte Carlo coalescent simulations for jointly estimating the population mean
common ancestor (TMRCA) between two subdivided populations. This approach
assumes that both populations descended from one panmictic population that may (or
may not) have been follow by migration. Second, if MDIV showed evidence of
equilibrium migration, MIGRATE was used to estimate migration rates assuming
equilibrium migration rates (symmetrical or asymmetrical) in the ancestral history of the
populations (Beerli and Felsenstein 2001). Both MDIV and MIGRATE assume neutrality
and no recombination and therefore these analyses were restricted to the neutral
nonrecombining blocks in the data set.
The ancestral history of the sample for each nonrecombining block, mitochondrial
(P3+P4) and nuclear (IntronRas and IntronRas+RAS), was reconstructed using Genetree
version 9.0 (Griffiths and Tavaré 1994) as implemented in SNAP Workbench. The
genealogy with the highest root probability, the ages of mutations, and the TMRCA of
Results
DNA sequence variability
A total of 3266 nucleotides were sequenced, 1256 nucleotides corresponding to portions
of two single-copy nuclear genes, RAS (Intron Ras and Ras) and B-tubulin, and 2010
nucleotides corresponding to the two regions of the mitochondrial genome, P3 (rpl14,
rpl5, tRNAs) and P4 (part of cox 1), described by Griffith and Shaw (1998). Though
sequence data were collected from 91 isolates, complete sequence data for all five loci
were not available for all isolates. Complete sequence data were available for 76 and 66
isolates for the three nuclear loci and for the two-mitochondrial regions, respectively. The
same isolates were present in the two data sets.
Sequence diversity, estimated as the proportion of polymorphic nucleotides, was
2.23 % for Intron Ras (five variable sites), 1.29% for RAS (seven variable sites), 0.20 %
for B-tubulin (one variable site), 0.76% for P3 (nine variable sites), and 0.48% for P4
(four variable sites) (Table 1.3). Overall sequence diversity estimates were 1.03% and
0.65% for single-copy nuclear genes and mitochondrial regions respectively. Four
nucleotide substitutions leading to amino acid change were found in P3 region (rpl14
gene). No amino acid changes were observed in the other genes examined. Two and one
synonymous substitutions were detected for Ras and B-tubulin genes respectively (Table
1.3). For each polymorphic site only two nucleotide changes were observed. Isolates
from S. tetrapetalum from Ecuador were highly variable across all loci and when
and 1.44% for both mitochondrial regions, respectively (Table 1.3). Seven nucleotide
substitutions leading to amino acid changes were also found in the P3 region (Table 1.3).
P. infestans is diploid and evidence has been obtained for heterozygosity from
analysis of dimeric enzyme patterns (Tooley et al. 1985, Spielman 1991). Therefore,
amplification of genomic DNA is expected to result in PCR products that arise from both
chromosomes and that upon direct sequencing yield profiles that show two coincident
peaks in the sequence chromatogram resulting from the coamplification of both alleles. In
the two nuclear loci investigated in this study, sequence results showed either one of the
two bases or the heterozygous combination of the same two bases. However, sequencing
errors rather than true heterozygosities could have also generated the observed patterns.
Sequence analysis showed that some heterozygosities in the PCR products of RAS and
B-tubulin genes create a unique Nru I or Nco I restriction site in one of the alleles,
respectively. To investigate whether the double peaks (Figure 1.2) represented true
heterozygosities or sequencing errors, since no Nru I or Nco I restriction sites were found
anywhere else in the corresponding gene fragment, the PCR products were digested with
Nru I or Nco I, respectively. As shown in Figures 2b and 2c, the digested products
confirmed that the allele with the restriction site gave two DNA fragments, while the
other one remained undigested. The size of the two fragments added to the size of the
undigested fragment. Therefore, sequencing errors were unlikely to account for the
polymorphims observed in the nuclear genes of this diploid organism (Brasier 1992).
Recently, Dr. D.E.L. Cooke, (Scottish, Crop Research Institute, Invergowrie, Dundee,
isolates and found the same heterozygous sites reported in this study, confirming that
both chromosomal alleles were amplified. Although the results do not preclude the
possibility that some isolates might be aneuploid or polyploid (Tooley and Therrien
1991), interpretation of the sequence data from this study is most consistent with isolates
being diploid. These results agree with other studies that demonstrated typical diploid
heterozygous patterns for dimeric enzyme markers in P. infestans (Tooley et al. 1985,
Spielman, 1991).
Nucleotide diversity
Summary statistics describing the sequence diversity in the pooled and individual
populations for both nuclear and mitochondrial loci are presented in Table 1.4.
Nucleotide diversity (π) for the pooled (total) sample was 0.00220 for mitochondrial loci
and 0.00329 for nuclear loci. The average per-nucleotide expected heterozygosity, θw, for
the pooled sample was 0.00139 and 0.00280 for mitochondrial and nuclear loci,
respectively. When S. tetrapetalum isolates were included (Pooled Tetra), π and θw
increased to 0.00282 and 0.00351 in the mitochondrial loci, for which these isolates were
sequenced. Among population samples and the mitochondrial locus, the Ecuadorian Tetra
population, which includes isolates from S. tetrapetalum, had the highest nucleotide
diversity, followed by the USA, Irish, Peruvian, Ecuadorian, and Mexican populations.
No nucleotide diversity was found in the Brazilian and Bolivian populations, since only
one haplotype was found in this population. The Mexican population had low nucleotide
population. The South American (SA) and Non-South American (NSA) populations
showed similar levels of nucleotide diversity in the mitochondrial loci. Brazilian and
Bolivian populations had the highest nucleotide diversity for the nuclear loci, followed by
the USA, Irish, Peruvian, Mexican and Ecuadorian populations. The Costa Rican
population was monomorphic for the nuclear loci. The Mexican population again showed
a relatively low level of nucleotide diversity compared to other populations, however
nuclear diversity was 42% of the Pooled sample. The South American population showed
higher nucleotide diversity compared to the Non-South American population. The low
nucleotide diversity found in the Mexican population, in both mitochondrial and nuclear
loci, is quite surprising since central Mexican populations of P. infestans are considered
the most diverse in the world based on RFLP, AFLP and isozyme analyses (Goodwin
1997, Flier et al. 2003). The high nucleotide diversity found in the USA population might
reflect the non-random selection of the USA sample. The equal frequency of highly
differentiated haplotypes causes an artificial increase in polymorphic sites (Ballard, 2000)
rendering high values of π and θ. Isolates from S. tetrapetalum formed a highly divergent
haplotype, which explains the highest nucleotide diversity obtained for the Ecuadorian
Tests of neutrality and population subdivision
In order to determine whether the data departured from an equilibrium neutral model,
four neutrality tests were performed. No significant values were observed for the Pooled
(total) sample for both mitochondrial and nuclear loci (Table 1.4), so the equilibrium
model of neutral evolution could not be rejected. The values of the tests tend to be
positive. Positive values might be the result of the observed predominance of two classes
of haplotypes in the mitochondrial loci and only four classes of haplotypes in the nuclear
loci. In the mitochondrial loci the two-haplotype classes were evenly represented in the
sample whereas in the nuclear loci one haplotype class dominated the sample, whereas
the other three-haplotype classes were at similar frequencies (Table 1.5).
The pattern observed for different populations was informative and showed some
significant values, especially for the mitochondrial loci, suggesting departure from
neutrality in some populations. Positive significant values were observed for the Peruvian
sample at the mitochondrial loci, whereas the values were significantly negative for the
Ecuadorian sample. In the Peruvian sample, the two-haplotype classes were present at
similar frequencies, but in the Ecuadorian sample one haplotype class dominated. When
all South American isolates were pooled, the South American and South American Tetra
populations, Fu’s F statistic was positive and significant, indicating that selection might
be acting on these loci in these populations. Significant positive values were observed for
all tests in the USA sample. These results are most likely related to the sampling strategy
used for this population that included an equal subsample of differentiated US genotypes.
sample indicating an excess of low-frequency polymorphisms, which is expected under
a model of population growth from its ancestral size or a recent selective sweep. Two of
the three variable sites found in the Mexican sample had a minor allele frequency of 10%
compared to the most common allele, implying that the rare alleles are derived. However
the most common allele had a frequency in the Mexican sample of 50%. This pattern in
the Mexican population is consistent with drift and a strong founder effect. Positive
significant values were observed in Brazilian and Bolivian populations at the nuclear loci.
Two nuclear haplotype classes were evenly represented in these samples. It should be
noted that small sample sizes and the presence of population subdivision limited the
power of the neutrality tests (Simonsen et al. 1995; Fu 1996).
Alternative tests for population subdivision (Hudson et al. 1992) were used to
avoid inferring false positives from neutrality tests (Carbone et al. 2004). Tables 1.6 and
1.7 summarize the values of Hudson’s test statistics for each population (eight
geographical regions) for nuclear and mitochondrial loci, respectively. Pairwise
comparisons between South American (SA) and non-South American (NSA) samples
showed genetic differentiation for both nuclear (P =0.0265, Kst= 0.0175, Ks=2.5082) and
mitochondrial (P=0.0000, Kst=0.2143, Ks=3.8625) loci. The differentiation level was
similar within the non South American group (P=0.0001, Kst=0.1162, Ks=1.6608) and
within the South American group (P=0.0001, Kst=0.2347, Ks=2.4530 for nuclear loci,
whereas for the mitochondrial loci, the differentiation level was higher within the non
South American group (P=0.0013, Kst=0.31364, Ks=2.8229) than within the South
Kst=0.2303, Ks=2.7602) Solanum tetrapetalum isolates. Among South American
populations, the Brazilian and Bolivian population were not different from each other but
were different from the Peruvian and Ecuadorian populations in the nuclear loci. Among
non South American populations, the Mexican population was genetically different from
the USA and Irish populations for both nuclear and mitochondrial loci. The USA and
Irish populations were not genetically differentiated. Mexican population was genetically
differentiated from all South American populations in the mitochondrial loci, whereas
was not differentiated from Peruvian and Ecuadorian populations in the nuclear loci. The
USA and Irish populations were more closely related to South American populations,
particularly to the Peruvian population.
When the analysis was performed grouping the isolates in four populations,
Hudson’s tests for population subdivision showed the same trend. Genetic differentiation
was detected between BRABO and USIR (P = 0.0438, Kst = 0.0800, Ks= 3.6543, Kt =
3.9720), BRABO and PEECU (P = 0.0000, Kst = 0.2649, Ks= 2.3557, Kt = 3.2051); and
BRABO and MECO (P = 0.0000, Kst = 0.3403, Ks= 1.8029, Kt = 2.7331) for the nuclear
locus. For the mitochondrial locus, significant population differentiation was found
between BRABO and MECO (P = 0.0093, Kst = 1.0000, Ks= 0.0000, Kt = 1.8461),
PEECU and MECO (P = 0.0000, Kst = 0.4567, Ks= 2.1698, Kt = 3.9938), MECO and
Coalescent analysis
Coalescent analysis using Genetree was carried out to infer the mutational history, time
scale of the origin and evolution of polymorphic variation, of the mitochondrial (P3/P4,
Figure 1.3) and nuclear (Intron Ras and Intron Ras + RAS, Figures 1.4 and 1.5) loci,
separately. Recombining haplotypes were excluded from the analysis (Table 1.5). The
analysis was performed assuming an infinite-sites model, constant population size,
random mating within a single population, and population subdivision. The topology of
the coalescent-based genealogy inferred for the mitochondrial loci (Figure 1.3) was
essentially the same as those of the coalescent-based genealogy inferred for the nuclear
loci (Figure 1.4 and Figure 1.5). The distribution of haplotypes among populations is
indicated below the trees. The isolates associated with each haplotype are shown in Table
1.8. Three independent ancient lineages were present in the mitochondrial (Figure 1.3)
and nuclear coalescent-based genealogies (Figure 1.4). One of the lineages included the
isolates from Solanum tetrapetalum from Ecuador. The other two ancient lineages gave
rise to the extant haplotypes found in isolates from potato, some wild Solanum species
and to a lesser extent tomato (Table 1.1). The lineage associated with S. tetrapetalum
isolates was highly differentiated from the other two lineages and may be a separate
species. The ancestral lineages that gave rise to the present day haplotypes of P. infestans
from potato were derivated from a common ancestor at T= 0.4 (mitochondrial) and T=
0.6 (nuclear). Mutations on these ancestral lineages gave rise to the extant haplotypes of
In the mitochondrial genealogy (Figure 1.3), the two ancestral lineages
associated with potato correspond to the mtDNA haplotypes Type I and II, respectively
described for P. infestans (Carter et al. 1990,1991). Mutations 23 and 16, found in P4 and
P3 regions respectively, create the EcoRI restriction sites used in the PCR-RFLP method
developed by Griffith and Shaw (1998) to differentiate Type I and II. Since these
mutations occured in the ancient lineage corresponding to Type II, Type I can be inferred
as the ancestral mitochondrial haplotype since no mutation occurred after the splitting
event from the common ancestor (T= 0.4) earlier than mutations 23 and 16. The fact that
the lineage associated with S. tetrapetalum is also Type I, and can be considered as a
closely related outgroup, also supports the Type I as the ancestral lineage. No mutations
were found in the mitochondrial regions that separate mitochondrial haplotype Ia from
mitochondrial haplotype Ib to determine which is the ancestral to each other. However,
several recent mutations have given rise to other rare haplotypes among the Type I.
Within the ancestral Type II lineage, haplotype IIa was inferred as ancestral to
haplotype IIb, due to mutation 4, which arose more recently. The two most common
haplotyes of each lineage (H1 and H2) contain isolates of both A1 and A2 mating types
(Figure 3). The Type I haplotype was globally distributed, with the exception of Brazilian
and Bolivian populations. The Type II haplotype was also found widely distributed,
although it was not found in the Toluca Valley and Costa Rican populations (Table 1.8).
Haplotype H7 (Type IIb) contains members of the US6, US11, US12, and US13
genotypes previously had been considered either tomato specific isolates or sexual
recombinants (Goodwin et al. 1998).
The two ancestral potato lineages observed for the nuclear loci (Figure 1.4 and
1.5) did not exactly match the two-mitochondrial lineages, indicating the nuclear
haplotypes contain isolates with distinct mitochondrial haplotypes. In other words, the
same mtDNA haplotypes were associated with different nuclear backgrounds, as has been
observed by others using different molecular markers (Gavino and Fry, 2002). The two
most common nuclear haplotypes (H1 and H2) of each ancient lineage contained isolates
of both mtDNA lineages (Types I and II) and of both mating types (A1 and A2). Two
other common nuclear haplotypes (H4 and H6) also contained isolates from the two
mtDNA lineages. H1 haplotype contained mainly isolates of the Type II mitochondrial
lineage and A2 mating type. The Peruvian isolates PCZ 007 and PCZ 0050 and the Irish
isolate 16/94 were the only isolates of the H1 haplotype that were of the Type I lineage
and A1 mating type.
In general, the Type I mtDNA lineage showed more nuclear diversity than the
Type II mtDNA lineage. All eight nuclear haplotypes contained isolates of Type I
mtDNA lineage, but only four of the nuclear haplotypes contained isolates of the Type II
mtDNA lineage (Figure 1.5).
Several unique haplotypes were found in the Mexican population (Toluca Valley),
but they were descendents from only one of the ancient lineages in both mitochondrial
(Figure 1.3) and nuclear (Figure 1.4 and 1.5) genealogies, whereas South American
isolate from Peru (PHU006) represented a unique haplotype (H9) and an Ecuadorian
isolate (3252) was inferred as recombinant haplotype (H10) (Table 1.6). The USA and
Irish haplotypes were also derived from both ancestral lineages and unique haplotypes
were also observed for these populations.
Discussion
This is the first time that DNA sequence variability analyses from both mitochondrial
(mtDNA) and nuclear loci have been used to study the evolutionary history of
Phytophthora infestans. Gene genealogies inferred from the mtDNA data (P3+P4
regions) and the autosomal data (Ras gene) were congruent. Both mitochondrial and
nuclear coalescent-based genealogies showed the existence of two ancient lineages
leading to the present day haplotypes of P. infestans associated with potato (Solanum
tuberosum), some wild Solanum species; and to a lesser extent tomato (three isolates
included) (Table 1.1). The ancient lineages from the mitochondrial genealogy
corresponded to the known Type I and Type II mitochondrial haplotypes (Carter et al.
1990, 1991) and contained individuals of both A1 and A2 mating types. The two ancient
lineages in the nuclear genealogy included individuals of the two mitochondrial lineages
and both mating types. A third lineage, associated only with a group of isolates from
Solanum tetrapetalum collected in the Andean Highlands of Ecuador was also found.
These results are unlikely to be due to a sampling bias. Gavino and Fry (2002) assessed
the diversity in mtDNA in a worldwide collection of 596 isolates of P. infestans using the
PCR-RFLP method developed by Griffith and Shaw (1998). Only four mtDNA
isolates. They also found that the two-mtDNA haplotypes were associated with
different nuclear backgrounds. Purvis et al. (2001) fingerprinted ninety-eight isolates
from England and Wales using both the RG-57 probe and AFLP. Both techniques
distinguished isolates of mtDNA haplotype Ia from those of haplotype IIa. No other
mtDNA haplotypes were found in their samples.
Geographic origin of the ancestral population
We were interested in two questions. First, does mitochondrial and nuclear DNA
evidence justify the specific hypothesis that a common ancestor of P. infestans originated
in South American or Mexican populations? In other words, what is the geographic origin
of the ancestral population? Population genetic theory predicts that ancestral populations
will have increased polymorphisms compared to more recent, non-ancestral populations.
Greater genetic diversity in central Mexico (Toluca Valley) than other areas of the world,
based on allozymes, RG-57 and AFLP markers, has frequently been taken as evidence of
this population’s antiquity (Spielman 1991, Goodwin 1997; Flier et al. 2003). The fact
that the genetic diversity of P. infestans outside central Mexico can be interpreted as
being a subset of the central Mexican one has been seen as even more compelling and
overwhelming evidence for the Mexican origin of the pathogen (Goodwin 1997).
However, greater diversity in a place may be due to a particular history of founder
effects, extinctions, and expansions of local populations (Takahata, 1994; Jaruzelska et
al. 1999). Surprinsingly, data presented here show that the nucleotide diversity in the
loci compared to South American populations (Table 1.4). The nucleotide diversity in
central Mexico population was five-fold less than the Peruvian sample for the
mitochondrial loci and nearly half for the nuclear loci. Globally, nucleotide diversity in
central Mexican populations represented 19% and 42% of the mitochondrial and nuclear
diversity of the pooled (total) sample. In contrast, the genetic variability found in South
American populations accounted for almost 90% of the variability found in non South
American populations for the mitochondrial loci and was almost twice of that of the Non
South American populations for the nuclear loci. This indicates that central Mexican
populations of P. infestans harbor less genetic diversity than populations in South
America, suggesting an ancestral condition for South American populations.
The haplotype structure also indicates less ancestral diversity in the Toluca Valley
Mexican population compared with South American populations. Haplotypes found in
the Toluca Valley of central Mexico, even rare haplotypes, were always derived from
only one of the ancient lineages for the mitochondrial (Figure 1.3) and nuclear (Figure
1.4 and 1.5) loci. The Type II mitochondrial haplotype class was not found in the Toluca
Valley population. Both mitochondrial haplotype classes (Type I and Type II) were found
in South American populations. If we assume that the accepted central Mexican origin of
P. infestans is correct, the following two scenarios are possible. One is that mutations
leading to Type II haplotypes occurred before the separation of Type II haplotypes and
their closest Type I haplotypes, but the former became very low in frequency or extinct in
the Toluca Valley populations. In other words, both haplotype classes originated in the
that mutations occurred in a lineage that was outside of Toluca Valley. Given the fact
that Type II haplotypes, particularly Type IIa, have a high frequency among populations
of P. infestans outside the Toluca Valley (Gavino and Fry, 2002), the first scenario is less
likely. In addition, mutations leading to the present day Type II haplotypes occurred after
and not before the splitting of the two ancient lineages from their common ancestor
(Figure 1.3), supporting the second scenario. The Toluca Valley population is unlikely to
be the center of origin of the mitochondrial Type II haplotype class. Gavino and Fry
(2002) and Flier et al. (2003) also reported a monomorphic condition for the
mitochondrial haplotypes for the Toluca Valley population. Only mtDNA haplotype Ia
was found in this population.
The pattern of genetic variability in the Toluca Valley Mexican population for the
mitochondrial locus was also consistent with a strong founder effect, not seen in other
populations (Table 1.4). In addition, Hudson’s tests for population subdivision (Table 1.6
and 1.7) showed that Mexican population is genetically differentiated from Peruvian and
Ecuadorian populations in the mitochondrial locus, but not in the nuclear locus. Levels of
differentiation estimated from mitochondrial and autosomal nuclear loci are expected to
differ at equilibrium because of their effective population size differences. Mitochondrial
locus with a lower effective size often has its diversity more strongly affected by
historical events such as founder effects or bottlenecks than do autosomal nuclear genes
(Arnaud-Haond et al. 2003).
A third lineage associated with S. tetrapetalum from Ecuador was found. This