DEVELOPMENT AND VALIDATION OF STABILITY-INDICATING REVERSE-PHASE
HIGH-PERFORMANCE LIQUID CHROMATOGRAPHY METHOD FOR THE ESTIMATION OF
LEDIPASVIR IN BULK AND TABLET DOSAGE FORM
MINAL R GHANTE*, SANJAY D SAWANT, AMOLDEEP SHINDE, SHITAL GODSE, VANDANA S NIKAM
Sinhgad Technical Education Society’s, Smt. Kashibai Navale College of Pharmacy, Savitribai Phule Pune University, Pune, Maharashtra, India. Email: [email protected]
Received: 01 November 2018, Revised and Accepted: 28 December 2018
ABSTRACT
Objective: The objective of this study was to develop a stability-indicating reverse-phase high-performance liquid chromatography (RP-HPLC) method for the estimation of ledipasvir (LDP) in bulk and tablet formulation.
Methods: Stability-indicating RP-HPLC method was developed and validated for the estimation of LDP in bulk and tablet formulation. RP-HPLC was
carried out on HiQ SiL C18 columns (250 mm × 4.6 mm, 5 μ particle size) using mobile phase acetonitrile:1 mM ammonium acetate buffer in the ratio of 90:10 v/v at a flow rate of 1 ml/min. The analytes were monitored using MD 2010 PDA detector at 333 nm.
Results: The retention time was found to be 3.843 min. The proposed method was found to be having linearity in the concentration range of 5–30 µg/ml. The number of theoretical plates obtained was 4236.50 which indicate the efficient performance of the column. The limit of detection was 0.305 µg/ml and limit of quantification was 0.923 µg/ml, which indicate the sensitivity of the method; the high percentage recovery indicates that
the proposed method is highly accurate. The developed method has been validated according to the ICH guidelines and found to be simple, specific, precise, and accurate.
Conclusion: The proposed method is precise, accurate, and stability indicating. Therefore, the proposed method can be used for routine quality control and analysis of LDP during stability studies in bulk samples and tablet dosage forms.
Keywords: Method development, Stability indicating, Reverse-phase high-performance liquid chromatography, Ledipasvir, ICH.
INTRODUCTION
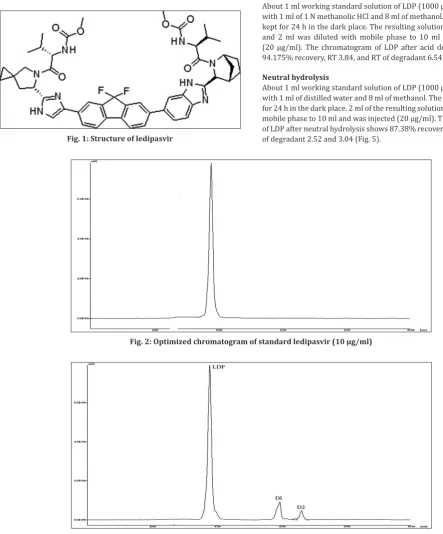
Ledipasvir (LDP) is chemically methyl
N-[(2S)-1-[(6S)-6-[5-[9,9-difluoro-7-[2-[(1S,2S,4R)-3-[(2S)-2-(methoxycarbonylam ino)-3-methylbutanoyl]-3-azabicyclo[2.2.1]heptan-2-yl]-3H-benzimidazol-5-yl]fluoren-2-yl]-1H-imidazol-2-yl]-5-azaspiro[2.4] heptan-5-yl]-3-methyl-1-oxobutan-2-yl]carbamate. It is a potent inhibitor of HCV NS5A, a viral phosphoprotein that plays an important
role in viral replication, assembly, and secretion. LDP in combination with sofosbuvir is used for the treatment of chronic hepatitis C, genotypes 1-6, usually in combination with other medications
depending on the specific genotype [1,2]. A literature review revealed
few spectrophotometric, reverse-phase high-performance liquid chromatography (RP-HPLC), stability-indicating RP-HPLC, and
UPLC-ESI MS/MS [3-13] methods for the estimation of LDP. The purpose of
this work was to develop a simple basic rapid and economic stability-indicating RP-HPLC method for the determination of LDP in its bulk and pharmaceutical dosage form so as to provide better scope for further research on the drug (Fig. 1).
METHODS
Chemical and reagents
The reagents used in this work were methanol (HPLC grade), ammonium
acetate (AR) Grade, HCl (AR), NaOH (AR), and hydrogen peroxide (3%, m/v) (AR), which were procured from Merck, India. Distilled water (HPLC grade) was also used. LDP API was procured from Cipla.
Equipment
The instruments used in the study were HPLC (Jasco, PU 2080 Plus pump) integrated using Empower software, Photostability Chamber
(Newtronic), Hot Air Oven (Kumar Laboratory Oven), electronic balance (Shimadzu balance), sonicator, digital pH meter, and calibrated
glasswares.
Preparation of standard stock solution
Standard stock solution of LDP was prepared by dissolving 10 mg of
drug in 10 ml of acetonitrile to get a concentration of 1000 µg/ml. From
the standard stock solution, 1 ml was further diluted to 10 ml with
mobile phase to get 100 µg/ml solution of LDP.
Analysis of formulations
Blend equivalent to 90 mg of LDP was prepared to satisfy dose/tablet of marketed formulation. Blend containing 90 mg LDP was prepared by
spiking drug into excipients (20 mg starch, 4 mg magnesium stearate and lactose [q.s upto 200 mg]). Mixing was done by geometric addition method.
Preparation of test solutions
Blend equivalent to 10 mg of LDP was weighed and transferred to 10 ml volumetric flask and was diluted with methanol. It was sonicated for 10 min and filtered so as to get solution having a concentration of
1000 µg/ml. 1 ml of filtrate was further diluted with methanol, of which
1 ml was diluted with mobile phase to get the final concentration of
10 µg/ml LDP. Six determinations were carried out from homogenous
sample to determine percentage assay.
Preparation of mobile phase
Mobile phase was prepared by mixing acetonitrile and 1 mM ammonium acetate buffer in the ratio of 90:10 v/v. It was then filtered through 0.45-µm membrane filter paper using filtration assembly and
then sonicated on ultrasonic water bath for 10 min.
© 2019 The Authors. Published by Innovare Academic Sciences Pvt Ltd. This is an open access article under the CC BY license (http://creativecommons. org/licenses/by/4. 0/) DOI: http://dx.doi.org/10.22159/ajpcr.2019.v12i3.30565
HPLC method development
After trying several permutation and combinations, it was found that mixture of acetonitrile and 1 mM ammonium acetate buffer in the ratio of 90:10 v/v gave a sharp peak of LDP and this system was optimized. It
was observed that the developed chromatographic condition provides
better separation of LDP (3.843 min) as shown in Fig. 2.
Stress degradation studies of bulk drug [14]
Degradation studies of the drug substance can help to identify the likely degradation products which can assist to establish the degradation pathways and the stability of the molecule. LDP was subjected under
different condition of acid, base, neutral hydrolysis, oxidation, dry heat,
and photolysis. For each study, two samples were prepared (Blank and of LDP drug solution).The blank subjected to stress in the same manner
as the drug solution. Dry heat and photolytic degradation were carried out in a solid state.
API degradation
Alkaline hydrolysis
About 1 ml working standard solution of LDP (1000 µg/ml) was mixed with 1 ml of 1 N methanolic NaOH and 8 ml of methanol. The
solution was kept for 24 h in dark place. The resulting solution was neutralised and 2 ml was diluted with mobile phase to 10 ml and
was injected (20 µg/ml). The chromatogram of LDP after alkaline hydrolysis shows 68.49% recovery, RT 3.849, and RT of degradant
5.91 and 6.58 (Fig. 3).
Acidic hydrolysis
About 1 ml working standard solution of LDP (1000 µg/ml) was mixed
with 1 ml of 1 N methanolic HCl and 8 ml of methanol. The solution was kept for 24 h in the dark place. The resulting solution was neutralised, and 2 ml was diluted with mobile phase to 10 ml and was injected
(20 µg/ml). The chromatogram of LDP after acid degradation shows 94.175% recovery, RT 3.84, and RT of degradant 6.54 (Fig. 4).
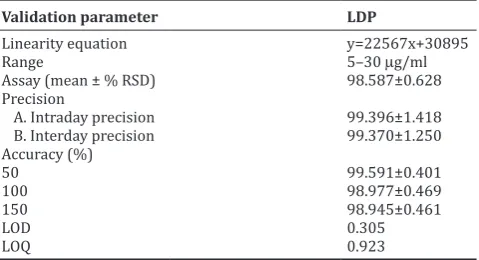
Neutral hydrolysis
About 1 ml working standard solution of LDP (1000 µg/ml) was mixed
with 1 ml of distilled water and 8 ml of methanol. The solution was kept for 24 h in the dark place. 2 ml of the resulting solution was diluted with
mobile phase to 10 ml and was injected (20 µg/ml). The chromatogram of LDP after neutral hydrolysis shows 87.38% recovery, RT 3.84, and RT of degradant 2.52 and 3.04 (Fig. 5).
Fig. 1: Structure of ledipasvir
Fig. 2: Optimized chromatogram of standard ledipasvir (10 µg/ml)
Oxidation
About 1 ml standard solution of LDP (1000 µg/ml) was mixed with 1 ml of 30% H2O2 solution and 8 ml of methanol. The solution was kept for
24 h in the dark place. 2 ml of the resulting solution was diluted with
mobile phase to 10 ml and was injected (20 µg/ml). The chromatogram of LDP after oxidation shows 97.07% recovery, RT 3.84, and RT of degradant 5.93 (Fig. 6).
Degradation under dry heat
Dry heat studies were performed by keeping drug sample in oven (80°C) for 24 h. Sample was withdrawn after 24 h and processed as per standard solution preparation procedure mentioned under 1.5 to get
20 µg/ml as final concentration and was injected. The chromatogram of LDP after exposing to dry heat shows 99.781% recovery and RT 3.84
(Fig. 7).
Fig. 4: Chromatogram of blank HCl and ledipasvir (20 µg/ml) after acid degradation
Fig. 5: Chromatogram of blank and ledipasvir (20 µg/ml) after neutral hydrolysis
Photodegradation studies
Photolytic studies were carried out by exposure of drug to UV light up to 200 watt-h/m2 and subsequently to cool fluorescent light to
achieve an illumination of 1.2 million Lux.Hr. A sample was withdrawn after exposure and processed as per standard solution preparation procedure mentioned under 1.5 to get 20 µg/ml as final concentration
and was injected. The chromatogram of LDP after photodegradation
shows 98.71% recovery (Fig. 8).
RESULTS AND DISCUSSION Linearity and range
From the standard stock solution (100 µg/ml) of LDP, further dilutions
were made with mobile phase to obtain a range of solution containing
six different concentrations. Five replicates per concentration
were injected. The linearity (relationship between peak area and concentration) was determined over the concentration range of
5–30 µg/ml as shown in Table 1.
Precision
The precision of the method was demonstrated by intra- and inter-day variation studies. In the intrainter-day studies, three replicates of three
different concentrations (10, 20, and 30 µg/ml) of LDP were analyzed
in a day, and percentage RSD was calculated. For the interday variation
studies, three replicates of different concentrations were analyzed on 3
consecutive days and percentage RSD was calculated as shown in Table 2.
Accuracy
To check the accuracy of the method, recovery studies were carried out by adding standard drug to sample at three different levels 50,
Fig. 7: Chromatogram of ledipasvir (20 µg/ml) after exposing to dry heat
Fig. 8: Chromatogram of ledipasvir (20 µg/ml) after photodegradation
Table 1: Linearity study of LDP
Replicates Concentrations of LDP
5 µg/ml 10 µg/ml 15 µg/ml 20 µg/ml 25 µg/ml 30 µg/ml Peak area
1 151972.1 255990.9 367001.2 469512.7 590079.1 710045.9
2 149580.2 255500.5 366714.9 470997.9 591457.7 719094.6
3 150306.9 255866.2 363674.1 471719.4 589971.6 717073.1
4 151639.5 256245.6 362299.1 488759.8 597698.1 720149.2
5 150123.1 253683.1 358676.1 483872.2 591721.1 712947.7
Mean 150724.4 255457.3 363673.1 476972.4 592185.5 715862.1
SD 1029.481 1027.496 3434.636 8739.073 3180.901 4260.782
100, and 150%. Basic concentration of sample chosen was 10 µg/ml
of LDP from tablet solution. These solutions were injected in stabilized
chromatographic conditions in triplicate to obtain the chromatograms. The drug concentrations of LDP were calculated using linearity equation of LDP as shown in Table 3.
Limit of detection (LOD)
LOD is calculated from the following formula:
LOD = 3.3 s/S
Where,
σ = standard deviation of response for the lowest concentration in the
range.
S = slope of the calibration curve.
Limit of quantification (LOQ)
The quantitation limit is expressed as follows:
LOQ = 10 s/S
Where,
σ = standard deviation of response for the lowest concentration in the
range.
S = slope of the calibration curve.
Robustness
Robustness of the method was determined by carrying out the analysis under conditions during which flow rate and wavelengths were altered and the effects on the area were noted as indicated in Table 4. The summary of validation parameters is included in Table 5.
DISCUSSION
Stability-indicating RP-HPLC method for the determination of LDP was
developed. Linearity for LDP was found in the range of 5–30 µg/ml with regression coefficient (r²) = 0.999. LOD and LOQ values were 0.30 µg/ml and 0.92 µg/ml, respectively. The RSD values for intra- and inter-day precision studies were found to be <2%.
Degradation of LDP was found to occur under acidic condition (1N HCL,
24 h), alkaline condition (1N NaOH, 24 h), oxidative condition (30%
H2O2, 24 h), and neutral (24 h) stress. LDP was considerably stable in
dry heat and photostability stress testing.
CONCLUSION
In the present work, stability-indicating RP-HPLC method for the estimation of LDP was developed and validated as per the ICH
guidelines. The standard deviation and % RSD (<2%) are within limit,
indicating a high degree of precision of the methods.
From the above discussion, it can be concluded that the proposed method is precise, accurate, and stability indicating. Therefore, the proposed method can be used for routine quality control and analysis of LDP during stability studies in bulk samples and in tablet dosage forms.
ACKNOWLEDGMENT
The authors are thankful to the management of STES and faculty of SKNCOP for support and M/s Cipla Ltd., Mumbai, for providing gift sample of LDP.
AUTHORS’ CONTRIBUTIONS
The work was carried out by Amoldeep Shinde, under the guidance of Dr. Mrs. Minal Ghante and Dr. Sanjay Sawant. Both, Dr. Vandana Nikam
Table 2: Precision study of LDP
Intraday precision Interday precision
Concentration(µg/ml) % Recovery SD Concentration (µg/ml) % Recovery SD
10 98.611 0.236 10 98.410 0.257
20 98.544 0.257 20 98.929 0.355
30 101.023 1.273 30 100.772 0.851
Table 3: Recovery study of LDP
Level (%) Concentration (µg/ml) Area % Recovery Mean % RSD
Sample Standard
50 10 5 369546 100.043 99.591 0.401
367516 99.443
366987 99.287
100 10 10 477687 98.992 98.977 0.469
475487 98.505 479678 99.433
150 10 15 589254 98.969 98.945 0.461
591614 99.387
586478 98.477
Table 4: Robustness study of LDP
Drug % RSD found for robustness study
Flow rate (1 ml/min) Wavelength (nm)
0.9 1.0 1.1 332 333 334
LDP 0.269 0.220 0.252 0.314 0.260 0.212
Table 5: Summary of validation study
Validation parameter LDP
Linearity equation y=22567x+30895
Range 5–30 µg/ml
Assay (mean ± % RSD) 98.587±0.628
and Mrs. Shital Godse have contributed in writing the manuscript and
proofreading of the same.
CONFLICTS OF INTEREST
The authors do not have any conflicts with any organization.
REFERENCES
1. Bhatia HK, Singh H, Grewal N, Natt NK. Sofosbuvir: A novel treatment option for chronic hepatitis C infection. J Pharmacol Pharmacother 2014;5:278-84.
2. Lawitz E, Mangia A, Wyles D, Rodriguez-Torres M, Hassanein T, Gordon SC, et al. Sofosbuvir for previously untreated chronic hepatitis C infection. N Engl J Med 2013;368:1878-87.
3. Devilal J, Durgaprasad B. New method development and validation for the determination of ledipasvir in bulk drug form by using reverse phase HPLC technique. World J Pharm Pharm Sci 2016;5:1312. 4. Pan C, Chen Y, Chen W, Zhou G, Jin L, Zheng Y, et al. Simultaneous
determination of ledipasvir, sofosbuvir and its metabolite in rat plasma by UPLC-MS/MS and its application to a pharmacokinetic study. J Chromatogr B Analyt Technol Biomed Life Sci 2016;1008:255-9. 5. Zaman B, Siddique F, Hassan W. RP-HPLC method for simultaneous
determination of sofosbuvir and ledipasvir in tablet dosage form and its application to in vitro dissolution studies. Chromatographia 2016;79:1605-13.
6. Nagaraj T, Vardhan SV, Kumar DR, Ramachandran D. A new RP-HPLC method for the simultaneous assay of sofosbuvir and ledipasvir in combined dosage form. Int J Chem Tech Res 2017;10:761-8.
7. Siva Kumar R, Sravan Kumar KV, Kondareddy L, Yogeshwara KR, Manish G, Jeenet J, et al. Stability indicating RP-HPLC method for estimation of potential impurities in ledipasvir and characterization of a new degradation impurity. J Chromatogr Sci 2018;56:383-5.
8. Naazneen S, Sridevi A. Development of assay method and forced degradation study of ledipasvir and sofosbuvir by RP-HPLC in tablet formulation. Indo Am J Pharm Res 2017;7:2231-687.
9. Kranthi K, Kiran M, Saisri M, Priyanka M, Manikanta SM, Kranthi KK. A new analytical method development and validation for the simultaneous estimation of ledipasvir and sofosbuvir using RP-HPLC. Inter Cont J Pharm Invest Res 2017;4:142-65.
10. Akshay P. Rote, Janardan Alhat, Amol A. Kulkarni. Development and validation of RP-HPLC method for the simultaneous estimation of ledipasvir and sofosbuvir in bulk and pharmaceutical dosage form. Int J Pharm Sci Drug Res 2017;19:291-8.
11. Baker MM, El-Kafrawy DS, Mahrous MS, Belal TS. Validated spectrophotometric and chromatographic methods for analysis of the recently approved hepatitis C antiviral combination ledipasvir and sofosbuvir. Ann Pharm Fr 2018;76:16-31.
12. Hassouna, Mohamed MA. Novel and facile spectrophotometric techniques for the determination of sofosbuvir and ledipasvir in their tablet dosage form. J Anal Pharm Res 2018;7:92-9.
13. Eissa MS. Simultaneous determination of the brand new two-drug combination for the treatment of hepatitis C: Sofosbuvir/ledipasvir using smart spectrophotometric methods manipulating ratio spectra. Spectrochim Acta A Mol Biomol Spectrosc 2017;183:362-70. 14. Singh S, Bakshi M. Guidance on conduct of stress tests to determine