FABRICATION AND EFFECT OF PROCESS VARIABLES OF SITAGLIPTIN MICROSPHERES
REVATHI S*, DHANARAJU MD
Department of Pharmaceutics, GIET School of Pharmacy, Rajahmundry, Andhra Pradesh, India. Email: [email protected] Received: 01 December 2017, Revised and Accepted: 11 January 2018
ABSTRACT
Objective: The study is to formulate and assess the effects of different variables on the release profile of sitagliptin microspheres.
Methods: The microspheres were prepared by emulsion-solvent diffusion method and ionotropic gelation method using ethyl cellulose and sodium alginate as the polymers, respectively. The formulations are optimized by applying 23 factorial design based on the drug-polymer ratio, stirring speed,
and method of preparation.
Results: The drug-polymer interaction was checked by the Fourier-transform infrared spectroscopy and differential scanning calorimetry the results of which indicated no incompatibility. The formulated sitagliptin microspheres were evaluated for shape, morphology, particle size, the degree of swelling, encapsulation efficiency, in vitro drug release studies for 12 h, and kinetics of drug release.
Conclusion: The results showed that the drug-polymer ratio and stirring speed affected the particle size and drug release. The release of the drug was found to be sustained, and diffusion path is following cube root law of Hixson-Crowell kinetics. The batch F3 was found to be desirable and was further characterized by scanning electron microscope for morphology.
Keywords: Sitagliptin, Factorial, Ethyl cellulose, Solvent diffusion.
INTRODUCTION
Microspheres are impregnable particles ranging from 1 µm to 1 mm containing dispersed medication in either solution or microcrystalline contour. Microcapsules are belittled particles that contain a dynamic agent as a gist material and coating agent as a shell. At present, there is no generally acknowledged size range that particle must have to be named as microcapsules. Commercial microcapsules ordinarily have a width between 3 and 80 µm and contain 10–90 weight % cores. The microsphere is a quickly extending innovation. It is the way of applying moderately thin coatings to little particles of solids or droplets of fluids and dispersions [1]. The microsphere is accepting impressive consideration generally, formative and industrially. The microspheres comprise proteins or biodegradable polymers in nature which are usually free streaming powders. Strong biodegradable microcapsules consolidating a medication dispelled or dethawed all through the molecule framework have the potential for the controlled arrival of medication [2].
The World Health Organization stated that more than 180 million persons are suffering from abnormal high glucose level globally. The predominance of diabetes is anticipated to two-fold in next 15 years, goaded by untoward way of life changes. Sitagliptin is the new and foremost drug in this new class of medications to be sanctioned by Food and Drug Administration. For the patients who are not able to maintain the control over blood glucose, sitagliptin helps in keeping them in control. Sitagliptin has been affirmed as a monotherapy and as an extra treatment to two different sorts of oral diabetes meds, metformin, and thiazolidinediones. perhaps, sitagliptin is useful in averting diabetes in those patients with prediabetes [3].
MATERIALS
Sitagliptin is obtained as gift sample from Richer Pharmaceuticals, Hyderabad. Ethyl cellulose and sodium alginate are obtained as gift samples from Maan Pharmaceuticals, Ahmedabad. All other chemicals used were of analytical grade.
Compatibility study of drug and the polymer
Fourier-transform infrared absorption spectra: 2 mg of the substance being examined was triturated with 300–400 mg of finely powdered and dried potassium bromide. This quantity was usually sufficient to give a disc of 13 mm diameter and a spectrum of suitable intensity. The mixture was ground carefully, spread it uniformly in a suitable die, and submit in a vacuum to a pressure of about 800 MPa (8t.cm−2) [4].
Differential scanning calorimetry (DSC)
Thermal analyses of sitagliptin, ethyl cellulose, sodium alginate, calcium chloride, and physical mixture were performed using a DSC to study the thermal behavior of samples. All samples were heated in hermetically sealed aluminum pans at a constant scanning rate of 10°C/min from 40 to 260°C applying the minimum possible pressure under a nitrogen atmosphere. An empty aluminum pan was used as reference [5].
Formulation of sitagliptin microspheres
The sitagliptin microspheres are prepared by emulsion solvent diffusion method (ESD) and ionotropic gelation (IG) method.
ESD method
The drug sitagliptin was dissolved in 15 ml of acetone. Ethyl cellulose is dissolved in the solvent mixture of ethanol and dichloromethane (1:1). The drug is then dispersed in the polymer solution and stirred well for uniform dispersion. The polymer solution containing drug was then emulsified in an aqueous phase containing 100 ml of 0.1% Tween 80 and stirred well with a mechanical stirrer for 2 h at room temperature to allow the volatile solvent to evaporate. The prepared microspheres were then collected on Whatman filter paper, dried and stored in desiccator [6,7].
IG method
Sodium alginate was dissolved in distilled water, and the drug was dispersed in the polymer solution with vigorous agitation. The © 2018 The Authors. Published by Innovare Academic Sciences Pvt Ltd. This is an open access article under the CC BY license (http://creativecommons. org/licenses/by/4. 0/) DOI: http://dx.doi.org/10.22159/ajpcr.2018.v11i4.24068
drug-polymer solution was then introduced gently into 5% w/v solution of calcium chloride through 21G stainless steel needle and stirred at a constant speed for 2 h to improve their mechanical strength. Then, microspheres are decanted, washed with water, allowed to dry at room temperature for 24 h and stored in a desiccator (Table 1) [6,7].
Statistical optimization technique
The optimization was designed statistically using 23 factorial design
using Minitab® Statistical Software (Version 17). A 2-level 3-factor
full-factorial design consists of 8 full-factorial design points. According to the model, 8 experiments were conducted in total (Table 2). For this study, X1 - method of preparation, X2 - drug: Polymer
concentration, and X3 - stirring speed were selected. The dependent
variables were Y1 - particle size analysis, Y2 - degree of swelling,
Y3 - encapsulation efficiency, and Y4 - % drug release. The factors and
levels of independent variables and independent variables are as shown in Tables 3 and 4, respectively. The results obtained from the experiment were statistically analyzed for response variables using Minitab® Statistical Software (Version 17). The statistical model
incorporating interactive and polynomial terms was used to evaluate the response:
Y = b0+b1X1+b2X2+b3X3+b12X1X2+ +b13X1X3+b23X2X3+b123X1X2X3
Physicochemical evaluation of sitagliptin microspheres Shape and surface morphology
Shape and surface morphology of the microspheres were observed using scanning electron microscopy (SEM). Samples mounted on an aluminum stub were sputter coated with god under the reduced pressure and a thick gold coated was applied using a sputter coater. The sample was placed under the microscope and vacuum was applied. The microspheres were observed under SEM [5].
Particle size analysis
The particle size of the microsphere was determined using optical microscopy method. The microspheres were counted approximately for particle size using a calibrated optical microscope fitted with an ocular micrometer and a stage micrometer [7,8].
Yield of microspheres
The prepared microspheres were collected and weighed. The actual weight of obtained microspheres divided by the total amount of all drug and polymer material that was used for the preparation gives the yield of microspheres [7].
%Yield = Actual weight of the microspheres Total weight of tthe drug and polymer* 100
Degree of swelling of microspheres
The degree of swelling was calculated using phosphate buffer pH 6.8 without enzyme. In all the formulations, the quantities of microspheres were accurately weighed and placed in the Petri dish which was completely immersed in the phosphate buffer pH 6.8. After 2 h, the microspheres were removed dried by filter paper and
weighted accurately again [9]. Then, the degree of swelling was calculated as,
W1 = Initial weight of the dry microspheres W2 = Final weight of the swollen microspheres
Encapsulation/incorporation efficiency
An accurately weighed quantity of microspheres equivalent to 100 mg of the drug was crushed and dissolved in 100 ml of phosphate buffer pH 6.8 in a volumetric flask and stirred for 12 h. After stirring, the solution was filtered through Whatman filter paper, and the filtrate was diluted using phosphate buffer pH 6.8 and absorbance was measured for the determination of un-entrapped drug at 267 nm using UV spectrophotometer. Values are taken to calculate the drug loading efficiency [9].
The drug release rate of the microspheres was determined in 900 ml of phosphate buffer pH 6.8 using USP XXII dissolution apparatus type 2 (paddle type). An equivalently weighted amount of microspheres equivalent to 100 mg was placed in a non-reacting muslin cloth having a smaller mesh size than the microspheres. The cloth was tied with a nylon thread to avoid the escape of any microspheres. The temperature of the medium was maintained at 37.0±0.5°C at 50 rpm. The sample aliquots were collected at specified time intervals, diluted with the same medium and analyzed at 267 nm for drug sitagliptin. Samples withdrawn were replaced with equal volume of the dissolution medium to maintain in vitro sink condition [9].
Kinetics of drug release
To know the mechanism of the drug release from the microspheres, the results obtained from the in vitro dissolution process were fitted into different kinetic equations as follows and coefficient of correlation (r) values was calculated by regression analysis as follows [10,11]: 1. Zero-order drug release: Cumulative % drug release versus time. 2. First-order drug release: Log cumulative % drug retained versus
time.
3. Higuchi’s equation: Cumulative % drug release versus square root of time.
4. Peppa’s-Korsmeyer exponential equation: Cumulative % drug release versus log time.
5. Hixson-Crowell cube root plot: Cube root of % drug remaining versus time.
RESULTS AND DISCUSSION Compatibility study
It was concluded that the drug along with the polymers showed no change in any characteristic peak of the drug, which confirms that
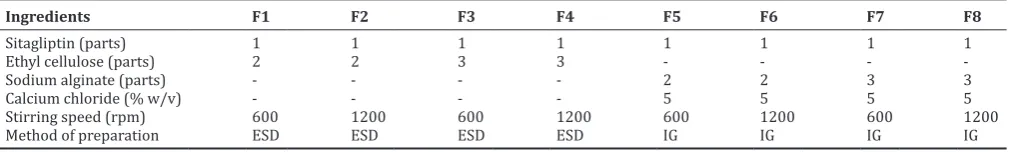
Table 1: Formulation of sitagliptin microspheres
Ingredients F1 F2 F3 F4 F5 F6 F7 F8
Sitagliptin (parts) 1 1 1 1 1 1 1 1
Ethyl cellulose (parts) 2 2 3 3 - - -
-Sodium alginate (parts) - - - - 2 2 3 3
Calcium chloride (% w/v) - - - - 5 5 5 5
Stirring speed (rpm) 600 1200 600 1200 600 1200 600 1200
Method of preparation ESD ESD ESD ESD IG IG IG IG
there is no interaction between the drug and the polymer used in the formulation of microspheres. The presence of peaks at the expected range confirms that the materials taken for the study are genuine (Figs. 1-4).
Shape and morphology
SEM of best formulation batch F3 shows that ethyl cellulose microparticles are discrete with a rough and rugged outer surface with corrugations (Figs. 5 and 6) [12].
Particle size
The average particle size of sitagliptin microspheres ranged from 350 µm to 2.09 mm. The mean particle size was significantly increased with increasing polymer concentration; this may be attributed to the high viscosity of polymer concentration (Fig. 7).
Entrapment efficiency
The maximum entrapment efficiency ranged from 68% to 79%, and the highest was found in F3 batch and was noted to be 78.5%. This may be
attributed to increasing concentration of the polymer and due to the formation of more intact matrix network in ESD method (Fig. 8) [13].
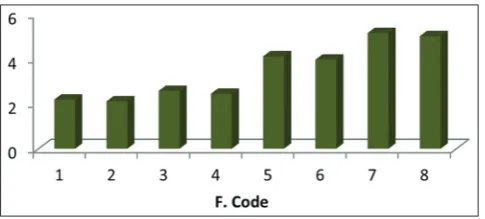
Degree of swelling
The swelling degree ranged from 2.1 to 5.16, and the highest was found in the F7 batch. This is precisely due to the increase in the concentration of the polymer and swelling capacity of the polymer used (sodium alginate) in IG method [14] (Fig. 9).
In vitrodrug release studies
The in vitro drug release studies were conducted for all batches of microspheres shown in Fig. 10. Drug release from microspheres of batch F1-F4 was slow based on the nature and concentration of polymers used. Among all the formulations F3 showed good dissolution profile with 78.4%. It was found that drug release rate decreased as the concentration of polymer increased. Hence, it is considered as the best microsphere formulation, which seems to be a good candidate for controlled release of sitagliptin.
Release kinetic study
The drug release data were analyzed according to different kinetic equations by analyzing regression coefficient method (r2) of all batches.
Table 2: Independent variables/factors
Code Variables/factors Low level (−1) High level (+1) X1 Method of
preparation Emulsion solvent -diffusion method
IG method
X2 Drug: Poly Conc. 1:2 1:3
X3 Stirring speed 600 rpm 1200 rpm
IG: Ionotropic gelation
Table 3: Dependent/response variables
Code Dependent variables
Y1 Particle size analysis
Y2 Degree of swelling
Y3 Encapsulation efficiency
Y4 Drug release in 12 h
Fig. 1: Fourier-transform infrared of sitagliptin
Fig. 3: Differential scanning calorimetry of sitagliptin
Fig. 4: Differential scanning calorimetry of sitagliptin + ethyl cellulose + sodium alginate
Fig. 5: Scanning electron microscopy of batch F3 microparticles ×600
Fig. 6: Scanning electron microscopy of batch F6 microspheres at ×40
The ESD formulations were best expressed by zero-order drug release and Hixson-Crowell as the plots showed the highest linearity. The IG formulations were best expressed by zero-order drug release and Higuchi. The drug release pattern of the formulations shows the best fit with the highest correlation coefficients for Hixson-Crowell indicating that the release of sitagliptin is controlled by diffusion. This indicates that the change in surface area, the diameter of the dissolved particles and the change in diffusion path length during the dissolution process follows the cube root law [15,16].
DISCUSSION [15,17-19] F1-F4: ESD method
The microparticles of formulations from F1 to F4 which are prepared by ESD method were irregularly spherical in shape. The percentage yield increased with increase in polymer concentration from 88.3% to 93.6%. Stirring speed does not show any valid effect on the percentage of yield. Particle size increased with increase in the polymer concentration due to the viscosity character of the polymer which comes in contact with the drug to form microparticles. The particle size decreased with increase in stirring speed. Encapsulation efficiency was increased with the increase in the polymer to drug ratio. Since the drug is well soluble in aqueous media, the encapsulation efficiency is good overall in this method. Stirring speed had a decreased effect on the encapsulation efficiency. The degree of swelling is less when compared to that of the other method because ethyl cellulose is not much swellable than sodium alginate. Encapsulation efficiency increases with increase in polymer concentration. The in vitro drug release rate decreased significantly with increasing the amount of
polymer because of the thickness of polymer around the drug particle which takes more time to diffuse out throughout the polymer matrix. The drug release in having a positive effect with an increase in the stirring speed which may be because the particle size is reduced and surface area is more [15,17-19].
F5-F8: IG method
It is observed that microspheres prepared using ESD method does not show a significant Y2 and IG method, Y2 is greatly charmed with an
increase in X2 (Fig. 12).
Effect of process variables on encapsulation efficiency (Y3) The entrapment efficiencies Y3 ranged from 68% to 78%. The entrapment
efficiency of sitagliptin is dependent on its solubility. Since sitagliptin is soluble in both water and ethanol, the Y3 in both methods is nearly
equal in both the method of preparations. The increase in X2 has well
influenced Y3. The polymer concentration X2 is directly proportioned to
the entrapment efficiency Y3. Hence, lower the polymer concentration
lesser the entrapment efficiency and vice versa. However, the highest entrapment efficiency is observed in ESD method, may be due to the less viscosity of the ethyl cellulose when compared to the sodium alginate. The X3 stirring speed has opposite effect on the entrapment efficiency
Y3, i.e., the stirring speed X3 is inversely proportional to the entrapment
efficiency Y3. Thus, as the speed is increased the entrapment efficiency
has been decreased and vice versa (Fig. 13).
Effect of process variables on drug release characteristics
The drug release ranged from 78% to 98%. The contour plot clearly shows that drug-polymer concentration X2 influences more in drug
release Y4. The drug release Y4 is directly proportional to the polymer
concentration X2. As the polymer concentration increases in a
microsphere, the drug takes a long time to diffuse through the polymer, so that drug release is getting slower and vice versa. The stirring speed X3 has an indirect effect on drug release Y4 because of small particle size
in ESD method. Since the particle size Y1 is slightly affected by stirring
speed X3, the drug release Y4 is also slightly disturbed because of the
same (Fig. 14).
CONCLUSION
In the present endeavor, the microspheres were prepared in two different methods of preparations for their ease of preparation. The reason for using two different polymers is to observe the release-modifying characteristics of the polymers. The shape of the
Fig. 7: Schematic representation of particle size analysis of F1-F8
Fig. 8: Schematic representation of encapsulation efficiency of F1-F8
Fig. 9: Schematic representation of degree of swelling of F1-F8
Fig. 10: Comparative % drug release Factorial equations
All the polynomial equations were found to be statistically significant determined using Minitab® statistical software. The equation can draw
a conclusion after considering the magnitude of the coefficient and mathematical sign carried (Table 5).
Effect of formulation variables on particle size (Y1)
The mean particle size of the microspheres ranged from 300 µm to 2 mm. The mean size increased with increasing X2 (1:2–1:3) which
produces a significant increase in the viscosity, leading to the formation of larger size emulsion droplets and finally a higher microsphere size, particularly in IG method. The mean size was also influenced by X3. It is
observed that microspheres prepared using ESD method does not show a significant variation in their mean size value. Notably, in IG method, when X2 ratio was increased from 1:2 to 1:3 there was the formation of
microspheres with larger sizes due to an increase in solution viscosity of the polymer sodium alginate (Fig. 11).
Effect of formulation variables on degree of swelling (Y2)
The degree of swelling of the microspheres ranged from 2 to 5. The contour plot clearly shows that X2 influences the Y2 and X3 have no
influence on the swelling capacity of the polymer. This shows that the swelling capacity is decided by the nature of the polymer, not by the X3.
Furthermore, with increase X2 (1:2–1:3) viscosity also increases which
ultimately results in more swelling. Sodium alginate is a hydrophilic polymer, and ethyl cellulose is a hydrophobic polymer which actually influences the swelling of microspheres and viscosity of the solution.
Fig. 11: (a and b) Contour and surface plots of particle size Y1
microparticles is observed to be irregularly spherical in shape. The microspheres prepared by the method of ESD had a sustained effect of polymers more than 12 h may be because of the polymer ethyl cellulose which is not aqueous soluble, and diffusivity of the drug through it is difficult when compared to another polymer. The microparticles prepared by the IG method showed complete drug release in 10 h may be due to aqueous solubility of the polymer sodium alginate even though the size of the particles is larger than that of the other. Based on the percentage of drug release and encapsulation efficiency, the
formulation F3 behaves the best formulation among these optimized formulations showing the sustained diffusion drug release of about 78.5% following Hixson-Crowell kinetics.
AUTHORS CONTRIBUTION
S. Revathi has carried out the work and investigated the study. Dr. Dhanaraju is the principal advisor who supported with ideas and provided the mechanical resources of research work to do the overall study.
CONFLICTS OF INTEREST
The authors declare no competing interests.
REFERENCES
1. Chien YW. Controlled and modulated release drug delivery systems. In: Swarbrick J, Boylan JC, editor. Encyclopaedia of Pharmaceutical Technology. New York: Marcel Dekker Inc.; 1990. p. 280-85.
2. Patel A, Ray S, Thakur RS. In vitro evaluation and optimization of controlled release floating drug delivery system of metformin Fig. 12: (a and b) Contour and surface plots of degree of
swelling Y2
b a
Fig. 14: (a and b) Contour and surface plots of drug release (Y4)
a b
Fig. 13: (a and b) Contour and surface plots of encapsulation efficiency (Y3)
a b
Table 4: Kinetic values of formulations F1 to F8
Formulation code Zero-order First-order Higuchi Peppa’s Hixson-Crowell
R2 R2 R2 n R2 R2
F1 0.988 0.972 0.968 1.201 0.752 0.992
F2 0.985 0.966 0.971 1.185 0.728 0.991
F3 0.990 0.986 0.960 1.238 0.794 0.997
F4 0.990 0.974 0.962 1.223 0.777 0.993
F5 0.996 0.814 0.943 1.367 0.743 0.935
F6 0.993 0.773 0.952 1.352 0.727 0.928
F7 0.996 0.880 0.940 1.387 0.763 0.959
F8 0.995 0.824 0.939 1.374 0.752 0.936
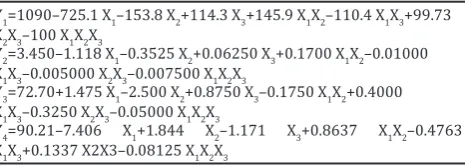
Table 5: The regression coefficients for each term in the regression model are summarized as follows Y1=1090–725.1 X1–153.8 X2+114.3 X3+145.9 X1X2–110.4 X1X3+99.73
X2X3–100 X1X2X3
Y2=3.450–1.118 X1–0.3525 X2+0.06250 X3+0.1700 X1X2–0.01000
X1X3–0.005000 X2X3–0.007500 X1X2X3
Y3=72.70+1.475 X1–2.500 X2+0.8750 X3–0.1750 X1X2+0.4000
X1X3–0.3250 X2X3–0.05000 X1X2X3
Y4=90.21–7.406 X1+1.844 X2–1.171 X3+0.8637 X1X2–0.4763
hydrochloride. Drug Deliv 2006;14:57-64.
3. Bardsley JK, Ratner RE. Sitagliptin: An oral agent for Glucose control. Expert Rev Endocrinol Metab 2008;3:691-7.
4. Sadashivaiah R, Dinesh BM, Patil UA, Desai BG, Raghu KS. Design and in vitro evaluation of haloperidol lactate transdermal patches containing ethyl cellulose-povidone as film polymers. Asian J Pharm 2008;2:43-9.
5. Chawla A, Sharma P, Pawar P. Eudragit S-100 coated sodium alginate microspheres of naproxen sodium: Formulation, optimization, and in-vitro evaluation. Acta Pharm 2012;62:529-45.
6. Sahoo SK, Mallick AA, Barik BB, Senapathi PC. Formulation and in vitro evaluation of eudragit microspheres of stavudine. Trop J Pharm Res 2005;4:369-75.
7. Gupta R, Prajapati KS, Pattnaik S, Bhardwaj P. Formulation and evaluation of novel stomach specific floating microspheres bearing famotidine for treatment of gastric ulcer and their radiographic study. Asian Pac J Trop Biomed 2014;4:729-35.
8. Shruti R, Alpana R. Formulation and characterization of an intragastric floating drug delivery system of doxorubicin hydrochloride: In vitro-in vivo release study. Asian J Pharm Clin Res 2012;5:150-8.
9. Dang T, Cui Y, Chen YD, Meng XM, Tang PF, Wu JB. Preparation and characterization of colon-specific microspheres of diclofenac for colorectal cancer. Trop J Pharm Res 2015;14:1541-7.
10. Korsmeyer RW, Gurny R, Doelker E, Buri P, Peppas NA. Mechanism of solute release from porous hydrophilic polymers. Int J Pharm 1983;15:25-35.
11. Higuchi T. Mechanism of sustained-action medication. Theoretical analysis of the rate of release of solid drug dispersed in the solid
matrices. J Pharm Sci 1963;52:1145-9.
12. Ararath D, Velmurugan S. Formulation and evaluation of nevirapine mucoadhesive microspheres. Int J Pharm Pharm Sci 2015;7:342-8. 13. Sundar VD, Sathyamoorthy N, Madhuri M, Dhanaraju MD. Preparation
and evaluation of ethyl cellulose microspheres of pioglitazone HCl for sustained drug delivery. Int J Pharm 2014;4:189-93.
14. El-Menshawe SF, Abdeltwab AM, Mohamed AI. Novel gastro-retentive polymeric microspheres: An approach for increased bioavailability and an once-daily dosing of terbutaline sulfate. Int J Pharm Pharm Sci 2016;8:320-9.
15. Raslan H K, Maswadeh H. In-vitro dissolution kinetic study of theophylline from mixed controlled release matrix tablets containing HPMC and glyceryl behenate. Ind J Pharm Sci 2006;68:308-12. 16. Sundar VD, Dhanaraju MD, Nandhakumar S. Preparation and
characterization of anastrozole loaded magnetic poly (epsilon-caprolactone) microspheres for anticancer activity. Der Pharm Lett 2016;8:118-28.
17. Mazumder B, Sarkar MK, Dey S, Roy N. Effect of formulation and process variables on the characteristics of microspheres of an anti-viral drug prepared by a solvent evaporation technique. Int J Pharm Pharm Sci 2010;2:52-9.
18. Garud N, Garud A. Preparation and in-vitro evaluation of metformin microspheres using non-aqueous solvent evaporation technique. Trop J Pharm Res 2012;11:577-83.