Sub
s
urface
s
tructure
s
derived from receiver function analy
s
i
s
and relation to
hypocenter di
s
tribution
s
in the region from the ea
s
tern Shikoku
to the northern Chugoku di
s
trict
s
, Southwe
s
t Japan
Tomotake Ueno1,2, Takuo Shibutani1, and Kiyoshi Ito1
1Disaster Prevention Research Institute, Kyoto University, Uji, Kyoto 611-0011, Japan 2National Research Institute for Earth Science and Disaster Prevention, Japan
(Received October 7, 2006; Revised December 9, 2007; Accepted February 8, 2008; Online published July 4, 2008)
We carried out receiver function imaging to estimate detailed configurations of the Philippine Sea (PHS) slab beneath the Shikoku and Chugoku districts and crustal structures in the region. We used two temporary seismic arrays with an average station spacing of about 10 kmin the Chugoku district. Beneath Shikoku a clear northward dipping discontinuity at about 20–40 kmdepth was found, with other discontinuities below. We present a new interpretation that the clear boundary corresponds to the under surface of a low velocity layer in the upper part of the PHS slab. We also found a discontinuity at about 60 kmdepth beneath the Chugoku district, which is thought to be the aseismic PHS slab. Small scale discontinuities were found in the crust beneath the source area of the 2000 western Tottori Earthquake and around the Median Tectonic Line. The discontinuitiesmight relate to the occurrence of large inland earthquakes.
Key words:Receiver function, Philippine Sea plate, hypocenter distribution.
1.
Introduction
Detailed distributions of earthquakes have recently been obtained from dense seismic networks operated by uni-versities, national institutes and the Japan Meteorological Agency (JMA) in Japan. Miyoshi and Ishibashi (2004) ob-tained contourmaps of the top of the Philippine Sea (PHS) slab fromhypocenter distributions in southwest Japan. As a result, the seismic PHS slab was well-defined beneath the Setouchi Inland Sea. Also, Nakanishi (1980) suggested there was an aseismic PHS slab in western Chugoku by an-alyzingScSpphases.
Yamauchiet al.(2003) and Shiomiet al.(2004) obtained depth contourmaps of the PHS slab in southwest Japan by receiver function analyses for the recent seismic network data. They interpreted the PHS slab image as the oceanic Moho discontinuity of the PHS plate. In this interpretation, earthquakes are thought to occur in the uppermantle of the subducting PHS plate beneath eastern Shikoku. Similarly, Kurashimoet al. (2002) reported that the earthquakes ex-isted in themantle beneath there fromresults of refraction and wide-angle reflection surveys.
On the other hand, Ohkura (2000) concluded the earth-quakes occurred in the oceanic crust of the PHS plate and/or the plate boundary, since guided phases were recorded at stations in the Chugoku district from earthquakes occur-ring beneath Shikoku. Shibutani (2001) obtained an S -wave velocity structure by analyzing receiver functions and wide-angle reflection phases below eastern Shikoku, and
Copyright cThe Society of Geomagnetismand Earth, Planetary and Space
Sci-ences (SGEPSS); The Seismological Society of Japan; The Volcanological Society
of Japan; The Geodetic Society of Japan; The Japanese Society for Planetary Sci-ences; TERRAPUB.
suggested that the subcrustal earthquakes occurred in the oceanic crust and/or at the plate boundary.
A large earthquake (Mw6.6) occurred on 6 October 2000,
in western Tottori Prefecture in southwest Japan (Shibutani
et al., 2002, 2005). Nishidaet al.(2002) carried out seismic explosion surveys in the aftershock area of this earthquake, and obtained reflectors at the depths of about 12, 30 and 60 km. In eastern Shikoku, there exists the Median Tectonic Line (MTL) which is themost significant fault in southwest Japan. Itoet al.(1996) found a sharp reflector dipping 30– 40◦north in the upper crust by a seismic reflection survey.
Kawamuraet al.(2003) and Satoet al.(2005) also found
that the sharp reflector extended to the lower crust froma recent seismic explosion survey. Although the subsurface structures in these regions have become clearer by analyz-ing geophysical data, the relations among the structures or between the structures and hypocenter distributions are not still clear.
In this study, we estimated the subsurface structures from the crust to the upper mantle, and compared them
to hypocenter distributions. To investigate the subsurface structures, we used dense seismic networks deployed from
the northern Chugoku and eastern Shikoku districts, includ-ing the source area of the 2000 western Tottori Earthquake (Fig. 1), and analyzed receiver functions calculated by a
multiple-tapermethod (Park and Levin, 2000). The pur-poses of this study are (1) to investigate relationships be-tween the locations of hypocenters and the configuration of the PHS slab in the eastern Shikoku region, (2) to im -age the Moho discontinuity and the discontinuity at 60 km
depth beneath the northern Chugoku district, and to discuss the relationships between the discontinuity at the 60 km
0 50 100100
Fig. 1. Distributions of seismic stations (inverted triangles) used in this study and hypocenters in southwest Japan determined by JMA. Plus signs show hypocenters (M > 0.5) from2002–2004. Open circles indicate DLF earthquakes. Thin solid lines show active faults. The earthquakes and DLF earthquakes in the boxes A–A and B–B are plotted in the depth sections of A–A and B–B, respectively.
depth and the aseismic PHS slab, and (3) to find relation-ships between discontinuities and hypocenter distributions in the crust in the source area of the 2000 western Tottori Earthquake and around the MTL.
2.
Method
2.1 Data
We used waveformdata recorded at 63 seismic stations in a cross-shaped array (A–A and B–B lines in Fig. 1) from
2002 to 2004. The arrays included 28 permanent stations of the National Research Institute for Earth Science and Dis-aster Prevention (NIED), JMA, Kochi University and Ky-oto University. The two lines of stations intersected in the source region of the 2000 western Tottori Earthquake. The average station spacing of the arrays was about 10 kmin the Chugoku district. These temporary stations were op-erated by the Japanese University Group of the Joint
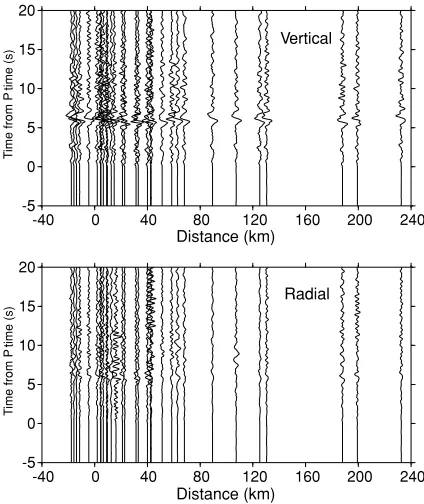
Seis-mic Observation in the Southwestern Japan (2002). Most stations were equipped with three-component short-period seismometers with a natural period of 1 s. The earthquake parameters used in this study are provided by the U.S. Geo-logical Survey (USGS). 70 earthquakes with epicentral dis-tances between 30 and 80◦and closer events with the depths greater than 300 kmwere chosen, as shown in Fig. 2. Fig-ure 3 shows an example of thePwaveforms of the vertical and radial components recorded along the A–A line. The waveforms have good correlations among the stations and also between the components. Phases within several
sec-0 100 200 300 400
Depth (km)
ChugokuShikoku
Fig. 2. Epicenter distribution of teleseismic events used in this study. Gray scale shows depths of the events.
-5
Fig. 3. Record sections of the vertical (upper figure) and the radial (lower figure) components of an earthquake recorded along the A–A line in Fig. 1. The earthquake (Mw6.4) occurred in the Malay Archipelago on October 18, 2003. The origin of thex-axis is the epicenter of the 2000 western Tottori Earthquake.
onds after theP onsetmay be caused by source processes. We try to remove the source effects and emphasize phases caused by velocity discontinuities beneath each station by the receiver function analysis.
2.2 Analyses
dis-Back azimuth (degree)
AYKH 0
2 4 6 8 10
14 12
Tps(s)
0 40 80 120 160 200 240 280 320 360
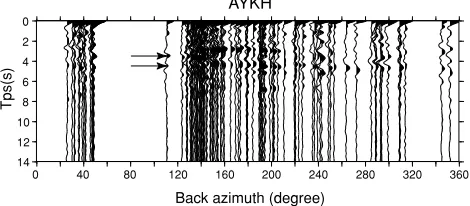
Fig. 4. Example of radial receiver functions ordered by back azimuths at station AYKH. Arrows show the phases of thePsconverted waves.
continuities, and reverberations. Because the effect of the earthquake source andP-wave reverberations are removed,
S-waves arriving at the surface are enhanced in receiver functions (e.g., Langston, 1979; Owenset al., 1984; Am
-mon, 1991). We assume that individual Ps phases corre-spond to structure boundaries. Receiver functions are cal-culated by a deconvolution of the radial component by the vertical component which containsmainly P-waves. The simplest way to accomplish this calculation is to divide the frequency spectrumof the radial component by the spec-trumof the vertical component. In order to stably calculate this division in the frequency domain, a water level (am in-imum allowable amplitude) is often applied to the power spectrumof the vertical component in order to fill spectral holes in the denominator (e.g., Helmberger and Wiggins, 1971). The spectral holes occur as a result of using a taper with a limited time length or a waveformwith a low signal-to-noise ratio (Sodaet al., 2001). Smaller water levels can not sufficiently fill the spectral holes, while larger water lev-els tend to contaminate the spectral amplitudes. Therefore, we have to choose carefully water levels according to the power spectrumof the individual vertical component.
Since we calculatedmany receiver functions in this study, the water levelmethod was unsuitable. To circumvent this problem, we applied themultiple-taper method (Park and Levin, 2000) for the calculation of receiver functions. We fixed parameters of themultiple-tapermethod to beP =4 and K = 3, where P is the time-bandwidth product and
K is the number of the eigentapers. The taper length T
was 60 s. Since the half width of spectral leakage W is calculated by P/T (Park et al., 1987), W becomes about 0.07 Hz. The time domain receiver functions obtained with these parameters tended to have low amplitudes for delay times greater than 8 s. We excluded high frequency noise by a Gaussian low-pass filter with a corner frequency of about 1–2 Hz (e.g., Owenset al., 1984). Figure 4 shows a record section of receiver functions ordered by back az-imuths at station AYKH on the A–A line, processed by the
multiple-taper deconvolution. In order to enhance coherent phases of the receiver functions, a singular value decom -position (SVD) filter was applied to the waves in the time domain. The SVD filtering with the largest six eigenval-ues provided a better receiver function image (Chevrot and Girardin, 2000).
2.2.2 Imaging Since the phases of receiver functions correspond to boundaries of theS-wave velocity structure,
the time axis of the receiver functions can be transformed into the depth axis using a 1-D velocity structure, such as JMA2001 (Uenoet al., 2002). Assuming that a plane P -wave impinging on an interface frombelow, the delay time,
Tps, of the convertedPsphase fromthe directP pphase, is
given by the following equation,
Tps(Z)=
Z
0
1
β(z)2 −p2−
1
α(z)2 −p2
d z,
whereαandβarePandS-wave velocities as a function of depthz, respectively. Zdenotes the depth of the interfaces.
p is the ray parameter. The depth series of each receiver function can be represented by a bending ray with the ray parameter and a backazimuth. We projected the rays onto 1 kmby 1 kmcells for the two array profiles. When two or
more rays were projected onto the same cell, the amplitudes were averaged. Figures 5–8 show the images of Ps con-verters obtained by thismethod. In the figures, the positive (negative) amplitudes of the receiver functions are shown with red (blue) colors and indicate velocity discontinuities fromfast (slow) to slow (fast) for upward rays.
3.
Re
s
ult
s
3.1 Estimatesof receiver functions
The receiver functions calculated with themultiple-taper
method weremore stable than those with the water level
method. Strong positive pulses at 3 and 4.5 s are observed in the radial receiver functions shown in Fig. 4, and they in-dicate interfaces in the crust and the uppermantle beneath station AYKH. The pulses appear fromback azimuths of 110 to 250◦. This result indicates that the receiver func-tions are affected by different structures for different arrival directions of the incident P-waves. We identified these pulses as velocity discontinuities (i.e., the Moho disconti-nuity and/or the plate boundary of the PHS plate). The im -ages obtained in this study show clearer results in Chugoku, the Seto Inland Sea and northern Shikoku, than previous re-ceiver function studies (e.g., Yamauchiet al., 2003; Shiomi
et al., 2004) because of a higher density of seismic obser-vation stations. Fromthe result of these two profiles, we obtained the velocity discontinuity structures.
3.2 A–A line
Figure 5(a) shows the receiver function image of the Ps
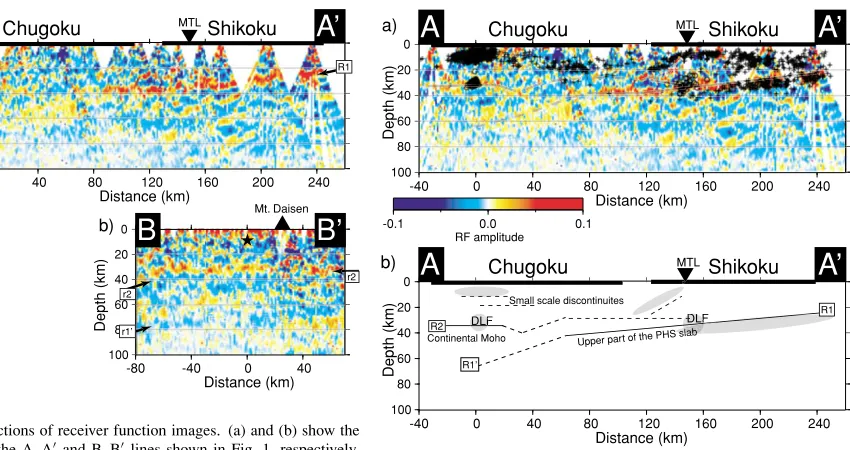
converted waves beneath the A–A line in Fig. 1. Contin-uous red cells (R1) are located clearly at 20–40 kmdepth beneath the Shikoku and the southern Chugoku districts. The R1 surface with a dip of about 10◦ becomes gradu-ally deeper towards the north. In the northern Chugoku dis-trict, there are continuous red cells (R2) at 30 kmdepth and deepen to about 40 kmtowards the south in themiddle of the Chugoku district. Moreover, there are continuous yel-low cells (R1) dipping towards the north at about 60 km
depth beneath the northern Chugoku district. In addition, there are small scale discontinuities at depths of 12–20 km
Depth (km)
Fig. 5. Cross sections of receiver function images. (a) and (b) show the images along the A–A and B–B lines shown in Fig. 1, respectively. Red and blue colors indicate the positive and negative amplitudes of the receiver functions, respectively. A star shows the hypocenter of the 2000 western Tottori Earthquake, which indicates the origin of thex-axis.
Depth (km)
Fig. 6. Cross sections of the receiver function images with seismic activity. Solid lines indicate clear discontinuities, the plate boundary and the Moho discontinuity. Dashed lines indicate other discontinuities in the crust and uppermantle. Plus signs and open circles indicate earthquakes and DLF earthquakes, respectively. A star shows the hypocenter of the 2000 western Tottori Earthquake, which indicates the origin of the
x-axis.
3.3 B–B line
Figure 5(b) shows the receiver function image of thePs
converted waves beneath the B–B line in Fig. 1. At the depth of 30 km, there are continuous horizontal red cells (r2). This discontinuity is disturbed beneath Mt. Daisen. It is possible that this is an artifact as discussed in the next section. Continuous yellow cells (r1) are found at approximately 60 to 70 kmdepth, which correspond to R1 in Fig. 5(a).
4.
Di
s
cu
ss
ion
We obtained the 2-D images of the receiver functions (Figs. 5–7) on an assumption that the structure does not
b) cross section of the receiver function image for the A–A section with seismic activity. Inmodel (b) the clear red cells are assumed to be the upper part of the PHS slab. Shaded areas show active seismicity.
Distance (km)
100 120 140 160 180
Distance (km) 0
20
40
100 120 140 160 180
Distance (km)
Fig. 8. Enlarged shallow portions of the cross section of the receiver func-tion image in Figs. 5(a) and 6(a) around the 2000 western Tottori Earth-quake (a) and the MTL (b). i, ii, iii show small scale discontinuities. In the lower two figures, seismicity near the cross sections is superimposed on the same images as in the upper figures.
change verymuch along the short side of the boxes. The assumption of the 2-D structure in the box A–A is con-sidered valid because isodepth contours related to the sub-ducting PHS plate derived fromthe earthquake distribution (e.g., Miyoshi and Ishibashi, 2004) and other receiver func-tion studies (e.g., Yamauchiet al., 2003; Uenoet al., 2008) and geotectonics in southwest Japan are roughly perpendic-ular to the A–A profile line and do not show abrupt changes in the studied area. It is not well known that the structure changes along the short side of the box B–B. However, the receiver function image along the profile B–B is less sub-ject to the structural change in the short direction because
We discuss in detail the relationship between the discon-tinuities derived fromthe receiver function analysis and the hypocenter distributions in the following three sections.
4.1 Relation ofslab tosubcrustal earthquakesin east-ern Shikoku
Our receiver function images and hypocenter distribu-tion shown in Fig. 7(a) show that the hypocenters beneath Shikoku are located beneath the continuous red cells (R1), indicating thatmost of the earthquakes are below the dis-continuity. The depth of R1 is similar to one derived from
previous receiver function studies. Yamauchiet al.(2003) and Shiomiet al.(2004) suggested that the continuous red cells (R1) fromsouthern Shikoku to central Chugoku corre-spond to the oceanic Moho discontinuity in the PHS plate. If their suggestion is correct, the subcrustal earthquakes be-neath eastern Shikoku occur below the oceanic Moho dis-continuity and deep low frequency (DLF) earthquakes oc-cur around the oceanic Moho discontinuity.
Kurashimoet al. (2002) constructed a P-wave velocity
model fromrefraction and wide-angle reflection data and pointed out that the oceanic Moho discontinuity was shal-lower than the subcrustal earthquakes. However, the phases of reflections fromthe oceanic Moho discontinuity in their study were obscure. Although the clear R1 cells in this study locate at similar depths to the oceanic Moho discon-tinuity, it seems improbable that they correspond to the ob-scure reflectors of Kurashimoet al.(2002).
Kodairaet al.(2002) pointed out the existence of water at the PHS plate boundary by analyzing reflected phases with large amplitudes recorded in an onshore-offshore deep seismic survey conducted in the western Nankai Trough seismogenic zone, and estimated the very thin layer (about 300 m) with very low velocity at the plate boundary. Kurashimoet al.(2002) also suggested a very low velocity layer with 1 kmthickness at the uppermost part of the PHS slab obtained fromthe same waveformcalculation for very clear reflected phases as Kodairaet al.(2002). Although there are slight differences between their low velocitym od-els (i.e., the location and the thickness of the low velocity layer), they both suggested the existence of the low velocity layers around the plate boundary. The R1 discontinuity pos-sibly indicates the lower boundary of the low velocity layer, though there is a question that receiver functions can detect such thin layers. Uenoet al.(2008) calculated synthetic re-ceiver functions for a thin low velocity layer, and showed that the receiver function was sensitive to a thin layer with at least 1 kmthickness when a large velocity gap existed.
Recently, Satoet al.(2005) determined that the thickness of the reflective layer around the PHS plate boundary was about 7 kmfroma seismic reflection survey across the over-all Outer Zone of Southwest Japan fromeastern Shikoku to eastern Chugoku. They interpreted the reflective layer as a contamination zone of the oceanic layers 1 and 2 and the base of the continental plate. The R1 discontinuity is lo-cated at the similar depth of the base of the reflective layer. In addition, Yamaguchiet al.(1999) gave a similar result by a network MT investigation in eastern Shikoku and sug-gested that the thin high-conductive layer (about 10 km) is caused by pore water and/or sediments in the upper part of the subducting PHS plate. Katsumata and Kamaya (2003)
suggested that themost plausible liquid causing tremor is water because a large quantity of water is transported by the subduction of the PHS plate. Nugraha and Mori (2006) found that the DLF earthquakes occur at highVp/Vs area
and suggested that the occurrence of the DLF earthquakes were involved with fluids. The layer with a large amount of water indicates very low velocity and the DLF earthquakes occur in it. As shown in Fig. 6(a), the DLF earthquakes occur around the R1. Therefore, the R1 can be the lower boundary of the low velocity layer.
To summarize this section, the reflective low velocity layer obtained from the seismic surveys and the high-conductive layer fromthe MT investigation are considered to be commonly caused by the existence of water supplied in the subducting processes beneath the onshore-offshore region in eastern Shikoku. As the result, a large velocity contrast exists at the base of the reflective low velocity layer and the R1 in our receiver function image can correspond to the discontinuity as shown in Fig. 7(b). Consequentlymost earthquakes associated with the subducting PHS plate oc-cur at the plate boundary and/or the oceanic crust beneath eastern Shikoku as well as in other regions, such as west-ern Shikoku and the eastwest-ern Kii Peninsula. Ohkura (2000) found later phases in seismograms at observation stations in the Chugoku and Kinki districts for earthquakes beneath Shikoku, and interpreted the later phases as guided waves in the low velocity layer in the oceanic crust. The conclusion that the earthquakes occurred within the low velocity layer is consistent with our interpretation.
4.2 Upper mantle discontinuitiesbeneath Chugoku
In the northern Chugoku district, the Moho discontinuity appeared clearly at 30 km depth (R2 in Fig. 5(a)). This discontinuity reaches about 40 kmin the central Chugoku district. This dipping Moho beneath the Chugoku district is consistent with low Bouguer gravity anomalies in the region (Gravity Research Group in Southwest Japan, 2001). In the B–B line (Fig. 5(b)) the Moho discontinuity (r2) is also located at about 30 kmdepth. r2 becomes obscure beneath Mt. Daisen at about 20 kmalong the horizontal axis. It is possible that this is an artifact because seismic stations located in this area did not have good recordings due to thick pyroclasticmaterial fromDaisen volcano.
DLF earthquakes occur around the Moho discontinuity beneath the aftershock area of the 2000 western Tottori Earthquake as shwon in Fig. 7(a). Most DLF events are not tremor, but earthquakes which have predominant frequen-cies of 2–4 Hz, andP-waves with a high-frequency com po-nent in the onset (Ohmi and Obara, 2002). Ohmi and Obara (2002) indicated that themechanismof DLF earthquakes were single-forces which suggested transport of fluids, such as water ormagma. These fluidmaterialsmight affect the
S-wave velocity. However, we could not obtain any charac-teristic receiver function images at the Moho discontinuity around the hypocenters of DLF earthquakes. The volume of these fluidsmight not be large enough to be detected by the receiver function analysis.
In Fig. 5, a discontinuity (R1 or r1) is seen at 50–60 km
2003), and inclines to the north (Fig. 5(a)). Although the r1 image is week, it is deeper beneath east area than west (Fig. 5(b)). As shown in Fig. 6, this discontinuity seems to be an extension of the upper part of the PHS slab (R1). The discontinuity is not as clear as R1 in Fig. 5(a). A possible reason for the diffuse observation is a characteristic of the
multiple-taper method which tapers the amplitudes of the receiver functions for delay times greater than 8 s, that is, for the depths greater than 60 km.
4.3 Hypocenter distributionsand discontinuitiesin the crust
We found small scale discontinuities in the crust in this study. A shallow portion of our results is enlarged in Fig. 8. In the Chugoku district beneath the area of the 2000 western Tottori Earthquake, there are two discontinuities at about 12 and 20 kmdepth (‘i’ and ‘ii’ in Fig. 8). The discontinuity ‘i’ exists beneath the source area of the 2000 western Tot-tori Earthquake andmay correspond to a reflector observed by Nishidaet al.(2002), and to the top of a zone of large scattering coefficient (Matsumotoet al., 2002; Asano and Hasegawa, 2004). Another discontinuity ‘ii’ exists beneath the southern region of the source area. This discontinuity does not coincide with any large scattering coefficient zone although the spatial resolution of their studiesmay not be adequate to be compared with our result in this region. As shown in Fig. 8(a), comparing ‘i’ and ‘ii’ with the hypocen-ter distribution, we found the shallower discontinuity ‘i’ is located at the base of the seismogenic zone and the deeper discontinuity ‘ii’ is located several kilometers below. There
might be a distinctive relationship among the discontinu-ities, the areas of large inland earthquakes and active faults.
Uenoet al.(2005) suggested a relationship between
veloc-ity discontinuities and seismogenic zones in the crust be-neath the Atotsugawa Fault which is an active fault located in central Japan. The fault is approximately 60 kmlong with right-lateral displacement. They identified discontinu-ities fromreflection and refraction surveys, and presented a four layermodel composed of a surface, upper crust (brit-tle),middle (brittle-ductile transition), and lower (ductile) layers. The ‘i’ and ‘ii’ discontinuitiesmay correspond to the boundaries between the upper andmiddle, andmiddle and lower crust, respectively. The ‘i’ discontinuity is seen only beneath the area of the 2000 western Tottori Earth-quake, andmay be a characteristic structure around a large earthquake.
Beneath the area around the MTL in Shikoku, there is a dipping discontinuity (‘iii’ in Fig. 8). This discontinu-ity is distributed under the northern portion of the surface trace of the MTL. The location of this discontinuity is sim -ilar to a reflector derived froma seismic explosion survey (Kawamuraet al., 2003; Satoet al., 2005). Therefore, we can identify the boundary as the deep extension of the MTL. The distribution of hypocenters around the MTL dips north-wards at an angle of 30–40◦. The discontinuity ‘iii’ is lo-cated several kilometers below the dipping distribution of hypocenters. Tabeiet al.(2002) presented amodel with a 35–45◦ northward dipping fault plane for the MTL, which is fully locked in the upper portion to a depth of 15 km, and slips steadily in the right lateralmotion at 5mm/yr be-low that depth. Themodel explained the GPS velocity field
fromwhich elastic deformation caused by the PHS subduc-tion had been removed. The discontinuity ‘iii’ possibly cor-responds to the aseismic fault plane of Tabei’smodel. The MTL is one of themost active and longest faults on land in Japan, and is a potential source of large destructive earth-quakes (Gotoet al., 2001). This discontinuity ‘iii’ might be a special structure below the area of large inland earth-quakes.
Ito (1999) constructed a model explaining a relation-ship between the lower limit of seismogenic zones and heat flow structures. He suggested large inland earthquakes would occur in areas where the depths of seismogenic zones changed abruptly. This lateral change of the seismogenic layer thickness was correlated to the large lateral tem pera-ture gradients caused by high pressure and high temperature fluid ormagma in the crust (Ito, 1999). The discontinuities (‘i’, ‘ii’, ‘iii’) in the crust are possibly related to the struc-tures affected by suchmaterials.
5.
Conclu
s
ion
s
We applied amultiple-taper receiver functionmethod to the teleseismic waveformdata recorded by temporary
seis-mic arrays and permanent stations. Since we used a high density set of seismic stations, we were able to obtain high resolution receiver function images along the arrays in the region fromeastern Shikoku to northern Chugoku districts, southwest Japan. Fromthe results, we concluded as fol-lows,
1) In the Shikoku to southern Chugoku districts, a clear discontinuity dips slightly to the north. We infer this to be the lower surface of the low velocity layer in the upper part of the PHS slab. This interpretation implies that most subcrustal earthquake occurs at the plate boundary and/or in the oceanic crust beneath eastern Shikoku.
2) In the northern Chugoku district, we observe the Moho discontinuity at about 30 kmdepth. We also find a dis-continuity at 50–60 kmdepth dipping to the northwest. This discontinuitymight indicate the deep extension of the PHS slab.
3) Small scale discontinuities in the crust seemto be lo-cated at the base of the seismogenic zone and at several kilometers below in the area of the 2000 western Tot-tori Earthquake. These discontinuities correspond to seismic reflectors. Around the MTL, we found a north dipping boundary in the lower crust whichmay cor-respond to the fault plane of the MTL, which inferred fromGPS velocity field. These discontinuitiesmay in-dicate a relationship between a characteristic structure and large inland earthquakes.
Japan. The data recorded by the permanent seismic stations are provided by JMA, NEID, Kochi University, and Kyoto Univer-sity. We used the computer systemof the Kyoto University Active Geosphere Investigations for the 21st Century Centers of Excel-lence Program(KAGI21). We also used GMT software (Wessel and Smith, 1991) to draw the figures.
References
Ammon, C. J., The isolation of receiver effects formteleseismicP wave-forms,Bull. Seismol. Soc. Am.,81, 2504–2510, 1991.
Asano, Y. and A. Hasegawa, Imaging the fault zones of the 2000 west-ern Tottori earthquake by a new inversionmethod to estimate three-dimensional distribution of the scattering coefficient,J. Geophys. Res., 109, B06306, doi:10. 1029/2003JB002761, 2004.
Chevrot, S. and N. Girardin, On the detection and identification of con-verted and reflected phases fromreceiver functions,Geophys. J. Int., 141, 801–808, 2000.
Doi, I., K. Nishigami, K. Tadokoro, and A. Shimokawa, Three Dim en-sional Distribution ofSWave Reflectors in and around the Source Re-gion of the 2000 Western Tottori Earthquake,Earth Monthly,25, 647– 651, 2003 (in Japanese).
Goto, H., T. Nakata, H. Tsutsumi, K. Okumura, T. Imaizumi, T. Nakamura, and T. Watanabe, The Latest Surface-Faulting Events on the Median Tectonic Line in Shikoku, Southwest Japan, Based on Mini-Trenching and Geoslicer Studies,Zisin 2 (J. Seismol. Soc. Jpn.),53, 205–219, 2001 (in Japanese with English abstract).
Gravity Research Group in Southwest Japan, Cravity database of south-west Japan [CD-ROM],Bull. Nagoya Univ. Museum Special Report,9, Nagoya, Japan, 2001.
Helmberger, D. V. and R. Wiggins, Uppermantle structure ofmidwestern Unites States,J. Geophys. Res.,76, 3229–3245, 1971.
Ito, K., Seismogenic layer, reflective lower crust, surface heat flow and large inland earthquakes,Tectonophysics,306, 423–433, 1999. Ito, T., T. Ikawa, S. Yamakita, and T. Maeda, Gently north-dipping
Me-dian Tectonic Line (MTL) revealed by recent seismic reflection studies, southwest Japan,Tectonophysics,264, 51–63, 1996.
Japanese University Group of the Joint Seismic Observation in the South-western Japan, The Joint Seismic Observations at the Southwestern Japan,Program. Abst., Seismol. Soc. Jpn., P004, 2002 (in Japanese) Katsumata, A. and N. Kamaya, Low-frequency continuous tremor around
the Moho discontinuity away fromvolcanoes in the southwest Japan,
Geophys. Res. Lett.,30, doi: 10.1029/2002GL015981, 2003.
Kawamura, T., M. Onishi, E. Kurashimo, T. Ikawa, and T. Ito, Deep seis-mic reflection experimet using a dense receiver and sparse shot tech-nique for imaging the deep structure of the Median Tectonic Line (MTL) in east Shikoku, Japan,Earth Planets Space,55, 549–557, 2003. Kodaira, S., E. Kurashimo, J.-O. Park, N. Takahashi, A. Nakanishi, S.
Miura, T. Iwasaki, N. Hirata, K. Ito, and Y. Kaneda, Structural factors controlling the rupture process of amegathrust earthquake at the Nankai trough seismogenic zone,Geophys. J. Int.,149, 815–835, 2002. Kurashimo, E., M. Tokunaga, N. Hirata, T. Kaneda, K. Ito, R. Nishida,
and S. Kimura, Geometry of the subducting Philippine Sea plate and the crustal and uppermantle structure beneath eastern Shikoku Island revealed by seismic refraction/wide-angle reflection profiling,Zisin 2 (J. Seismol. Soc. Jpn.),54, 489–505, 2002 (in Japanese with English abstract).
Langston, C., Structure under Mount Rainier, Washington, inferred from telesesimic body waves,J. Geophys. Res.,84, 4749–4762, 1979. Matsumoto, S., K. Obara, N. Kimura, and M. Nakamura, ImagingP-wave
Scatterer Distribution around the Focal Area of the 2000 Western Tottori Earthquake (Mw6.6),Zisin 2 (J. Seismol. Soc. Jpn.),55, 229–232, 2002 (in Japanese).
Miyoshi, T. and K. Ishibashi, Geometry of the seismic Philippine Sea Slab beneath the region fromIse bay to Western Shikoku, Southwest Japan,
Zisin 2 (J. Seismol. Soc. Jpn.),57, 139–152, 2004 (in Japanese with English abstract).
Nakanishi, I., Precursors to ScS phases and dipping interface in the upper mantle beneath southwestern Japan,Tectonophysics,69, 1–35, 1980. Nishida, R., N. Hirata, K. Ito, Y. Umeda, T. Igawa, and M. Onishi,
Subsur-face survey beneath the western Tottori region (Part 1),Program. Abst., Seismol. Soc. Jpn., P62, 2002 (in Japanese).
Nugraha, D. A. and J. Mori, Three-dimensional Velocity Structure in the Bungo Channel and Shikoku Area, Japan, and its Relationship to Low-frequency Earthquakes,Geophys. Res. Lett.,33, L24307, doi:10. 1029/2006GL028479, 2006.
Ohkura, T., Structure of the upper part of the Philippine Sea plate estimated by later phases of uppermantle earthquakes in and around Shikoku, Japan,Tectonophysics,321, 17–36, 2000.
Ohmi, S. and K. Obara, Deep low-frequency earthquakes beneath the focal region of theMw6.7 2000 Western Tottori earthquake,Geophys. Res. Lett.,29, doi:10.1029/2001GL014469, 2002.
Owens, T. J., G. Zandt, and S. R. Taylor, Seismic evidence for an ancient rift beneath the Cumberland Plateau, Tennessee: a detailed analysis of broadband teleseismicP-waveforms,J. Geophys. Res.,89, 7783–7795, 1984.
Park, J. and V. Levin, Receiver functions from multiple-taper spectral correlation estimates,Bull. Seismol. Soc. Am.,90, 1507–1520, 2000. Park, J., C. R. Lindberg, and F. L. Vernon III, Multitaper Spectral Analysis
of High-Frequency Seismograms,J. Geophys. Res.,92, 12675–12684, 1987.
Sato, H., Y. Kojima, A. Murata, T. Ito, Y. Kaneda, M. Onishi, T. Iwasaki, Y. Oho, S. Ogino, K. Kano, T. Kawamura, E. Kurashimo, S. Koshiya, A. Takasu, T. Takeshita, N. Tsumura, Y. Terabayashi, F. Toyohara, T. Naka-jima, K. Noda, Y. Hashimoto, S. Hasegawa, N. Hirata, T. Miyauchi, T. Miyata, S. Yamakita, T. Yoshida, S. Harder, K. Miller, G. Kaip, T. Ozawa, and T. Ikawa, Crustal Structre of the Outer Zone in Southwest Japan revealed by Shikoku and Seto-Inland-Sea Seismic Profiling in 2002,Bull. Earthq. Res. Inst.,80, 53–71, 2005 (in Japanese with En-glish abstract).
Shibutani, T., The crust and slab structre beneath the eastern Shikoku by receiver function analyses,Earth Monthly,23, 708–713, 2001 (in Japanese).
Shibutani, T., S. Nakao, R. Nishida, F. Takeuchi, K. Watanabe, and Y. Umeda, Swarm-like seismic activity in 1989, 1990 and 1997 preceding the 2000 Western Tottori Earthquake,Earth Planets Space,54, 831– 845, 2002.
Shibutani, T., H. Katao, and Group for the dense aftershock observations of the 2000 Western Tottori Earthquake, Very dense aftershock observa-tions of the 2000 Western Tottori Earthquake (Mj=7.3) in southwest-ern Honshu, Japan: high resolution aftershock distribution, focalm ech-anisms and 3-D velocity structure in the source region,Earth Planets Space,57, 825–838, 2005.
Shiomi, K., H. Sato, K. Obara, and M. Ohtake, Configuration of subducting Philippine Sea plate beneath southwest Japan revealed fromreceiver function analysis based on themultivariate autoregressivemodel,J. Geophys. Res.,109, B04308, doi:10.1029/2003JB002774, 2004. Soda, Y., T. Matsuzawa, and A. Hasegawa, Seismic velocity structure
of the crust and uppermostmantle beneath the northeast Japan arc estimated fromreceiver functions,Zisin 2 (J. Seismol. Soc. Jpn.),54, 347–363, 2001 (in Japanese with English abstract).
Tabei, T., M. Hashimoto, S. Miyazaki, K. Hirahara, F. Kimata, T. Mat-sushima, T. Tanaka, Y. Eguchi, T. Takaya, Y. Hoso, F. Ohya, and T. Kato, Subsurfacestructure and faulting of the Median Tectonic Line, southwest Japan inferred fromGPS velocity field,Earth Planets Space, 54, 1065–1070, 2002.
Ueno, H., S. Hatakeyama, T. Aketagawa, J. Funasaki, and N. Hamada, Im -provement of hypocenter determination procedures in the Japan Mete-orological Agency,Q. J. Seismol.,65, 123–134, 2002 (in Japanese with English abstract).
Ueno, T., K. Ito, K. Yoshii, K. Matsumura, and H. Wada, Crustal Struc-ture and Seismic Activity around the Atotsugawa Fault System, Central Honshu, Japan,Zisin 2 (J. Seismol. Soc. Jpn.),58, 143–152, 2005 (in Japanese with English abstract).
Ueno, T., T. Shibutani, and K. Ito, Configuration of the continental Moho and Philippine Sea slab in Southwest Japan derived fromreceiver func-tion analysis: Relafunc-tion to subcrustal earthquakes,Bull. Seismol. Soc. Am., 2008 (accepted).
Wessel, P. and W. H. F. Smith Free software helpsmap and display data,
Eos Trans. Am. Geophys. Union,72, 441, 445–446, 1991.
Yamaguchi, S., Y. Kobayashi, N Oshiman, K. Tanimoto, H. Murakami, I. Shiozaki, M. Uyeshima, H. Utada, and N. Sumitomo, Preliminary report on regional resistivity variation inferred fromthe Network MT investigation in the Shikoku district, southwest Japan,Earth Planets Space,51, 193–203, 1999.
Yamauchi, M., K. Hirahara, and T. Shibutani, High resolution receiver function imaging of the seismic velocity discontinuities in the crust and the uppermostmantle beneath southwest Japan,Earth Planets Space, 55, 59–64, 2003.