QUALITY BY DESIGN BASED DISSOLUTION TEST DEVELOPMENT OF OMEPRAZOLE
EXTENDED RELEASE FORMULATION
VAYEDA CHINTAN MANRANJAN*, DEVENDRA SINGH YADAV, HITESH AMRUTLAL JOGIA
Department of Analytical Research and Development, Dr. Reddy’s Laboratories Ltd. IPDO, Bachupally, Hyderabad - 500 090, Telangana, India. Email: [email protected]
Received: 23 February 2014, Revised and Accepted: 01 September 2014
ABSTRACT
Objective: The objective of the current work is to develop dissolution method for the formulation contains mix pellets of omeprazole delayed release (DR) and extended release.
Methods: The dissolution method design was based on the quality by design principles, the selection of dissolution media, apparatus and drug release specification was based on scientific understanding of drug release mechanism and stability of omeprazole. Design of experiments (DOE) employed to assess the huskiness of the dissolution test using pH, volume of media and concentration of surfactant as critical test parameters.
Results: Omeprazole DDR formulation shows more than 85% cumulative drug release at 105 minutes with the % RSD less than 5 among six units. Based on p values (<0.1) of Shapiro-Wilk test for normality, Response-1 and 2 are statistically analysed with ANOVA statistics. The ANOVA analysis shows significant effect of ‘volume’ and ‘pH’ of dissolution media (p<0.05) on Quality Target Test Profile.
Conclusion: The outcome of DOE assessed with 95% confidence interval ANOVA statistics, which reveals that the dissolution test is rugged and can be used for routine quality control test of omeprazole dual DR formulation.
Keywords: Dissolution, Development, Omeprazole, Quality by design, Design of experiments, ANOVA.
INTRODUCTION
Over the last few decades, use of the dissolution test for quality check purpose has remarkably increased in the pharmaceutical industries [1-3]. Dissolution test is a vital tool to assess the formulation performance in vivo and also a quality control test for monitoring quality of formulation product. Dissolution profile comparison is most important to waive in vivo the bioequivalence study, particularly during scale up and post-approval changes to the product. The in vitro dissolution testing plays a major role to get approval from different regulatory agencies [3,4].
Opting dissolution test, next vital step is to select proper dissolution media considering factors like, complexity of formulation (i.e., modified release, extended release [ER], immediate release, sustain release, etc., molarity and pH of dissolution media require to ensure dissolution release, solubility of active and in-actives in the media, etc. All these factors have greater influence on drug product dissolution and so, evaluations of these parameters are very important for contemporary dissolution development [5-7]. Dickinson et al. demonstrate significance of quality by design (QbD) for clinical relevance of dissolution testing [8]. QbD is a systematic, scientific, risk-based, holistic and proactive approach to pharmaceutical development that begins with predefined objectives and emphases product and process understanding and process control. This approach uses statistical design of experiments (DOE) to develop a rugged method with “design space.” The design space defines the experimental region in which changes to method parameters will not significantly affect the quality and results of the method [9].
In the present work, the objective was to develop an in vitro dissolution test using QbD approach for newly devised omeprazole dual delayed-release (DDR) formulation [10]. The formulation was designed for patients suffering from gastroesophageal reflux disease. Omeprazole DDR is a mixture of DR (DR; enteric coating) and ER (ER; controlled release) pellets. Thus, it has sustained action for long duration [11].
Since, omeprazole is an acid labile drug and is stable at around pH - 10 [11,12], the purpose was to build an in vitro dissolution test which discriminate the release of DR and ER part of omeprazole DDR formulation, using dissolution media similar to in vivo physiological condition in a short dissolution run time.
EXPERIMENTALS Chemicals
Test samples of omeprazole pellets and all chemicals provided by Dr. Reddy’s Laboratories (Hyderabad, India). Extra pure grades of monobasic sodium phosphate anhydrous (Merck, Mumbai), sodium hydroxide (Merck, Mumbai), Sodium dodecyl sulfate or sodium lauryl sulfate (SLS) (Merck, Mumbai), hydrochloric acid (35%) (Merck, Mumbai), triethylamine (Qualigens, Mumbai) and high pressure liquid chromatography (HPLC) grades of methanol and acetonitrile (Merck, Mumbai) used for experimentation. Millipore 0.45 μm membrane filters, polypropylene syringe filter holder, were purchased from Millipore Corp. (Bedford, MA, USA).
Equipments
Dissolution (DISSO 2000-Labindia Analytical Instruments Pvt. Ltd, India) apparatus attached with autosampler used to perform dissolution tests. The HPLC (Agilent, USA) used consists of a quaternary solvent manager, a sample manager and a ultra violet-visible multiple wavelength detector. The output signal monitored and processed using Empower 2 software (Waters Corporation; Milford, Massachusetts).
Brief about chromatographic conditions
Standard preparation
A standard of 56 µg/mL was prepared using an accurately weighed amount of omeprazole standard in the dissolution media. The standard solution further stabilized using sodium hydroxide solution.
Brief about formulation
The omeprazole DDR formulation is a mixture of about 20 mg DR (≈33% of total formulation) and 40 mg ER (≈67 % of total formulation) pellets, where solubility and dispersion of DR part are pH dependent (which dissolved and release the drug between pH 5-7), while for ER part, it is pH independent. The DR part of the formulation is likely to facilitate loading dose of the drug while ER part is prone to maintain the concentration of the drug [9].
Dissolution media preparation; pH 7.0 buffer
Dissolution media containing 0.07 M monobasic sodium phosphate anhydrous, 0.09 M sodium hydroxide, 0.05 M hydrochloric acid and 5 mM SLS, was prepared using purified water. The media deaeration performed as per general chapter <711> of US pharmacopeia.
Dissolution test
The dissolution studies were performed with USP apparatus-II, employing 900 mL of dissolution media at 37±0.5°C and a stirring rate of 75 RPM. After 15 and 105 minutes, a sample of about 10 mL was withdrawn from each vessel using cannula attached to autosampler and replacement of media was done immediately with nearly 10 mL of the fresh medium at 37±0.5°C. The samples were stabilized with sodium hydroxide solution and filtered through 0.45-μm nylon filters preceding assay by HPLC.
QbD
In QbD approaches, experimentation is carried out to determine the relationship between factors acting i.e., critical test parameters (CTP), on the process/test or a product, or both and the response or properties of the process/test or a product, i.e., critical quality attributes (CQAs). The information is then used to achieve the goal, i.e., quality target test profile (QTTP) of the process/test or a product. In the present work, QTTP for the dissolution test of omeprazole DDR was to discriminate the release of DR part and ER part and complete release formulation without potential degradation of omeprazole. The CTPs selected for DOE were volume of dissolution media, pH of the dissolution media and concentration of surfactant (SLS) (Table 1).
RESULTS AND DISCUSSION
Omeprazole is an acid liable drug and unstable at entire gastrointestinal (GI) tract pH range (1.2-7.5) [11,12]. Further; omeprazole DDR was formulated to commence hypothetical releases of drug from the upper jejunum (pH between 5.5 and 7) and provide greater than one release of omeprazole in vivo using DR and ER pellets [10,13]. Based on scientific understanding of omeprazole drug, formulation design and therapeutic target, the in vitro dissolution method development was started with QTTP as, dissolution method should be able to discriminate the DR and ER part and ensure more than 85% of cumulative drug release.
Initial method development trials were taken using the compendial dissolution medium [14] for omeprazole DDR capsules in which dissolution test was carried out for 8 hrs to ensure the complete release of formulation. However, due to instability of omeprazole in compendial media, the cumulative percentage drug dissolved after 8 hrs was <50%. Mass balance of this result was confirmed with in-house developed related substance analytical method [15]. To prevent the drug degradation in dissolution media the approach of dissolution test with shorter dissolution run time was attempted with use of surface active agent in dissolution media, which facilitates the faster drug release from ER pellets, due to reduction in surface tension between pellets surface and dissolution media. At the end, dissolution media were finalized based on omeprazole DDR hypothetical release pattern in GI tract fluid, which contains salts and acids [10,13]. To maintain resemblance between in vitro and in vivo conditions a mixture of salts and acid were used to prepare dissolution media of pH 7.0, which is a combination of phosphate buffer and hydrochloric acid. SLS was selected as a surfactant for dissolution test and concentration was kept as 5 mM in dissolution media pH 7.0 buffers.
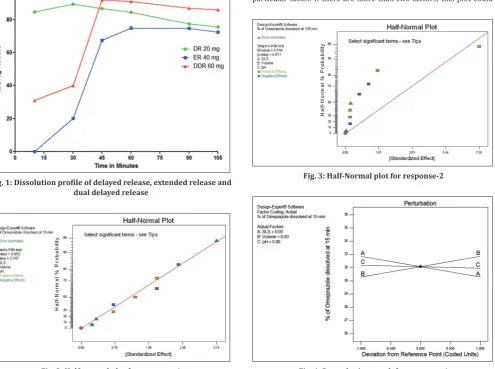
Optimization of dissolution method was done, using pH 7.0 buffer with 5 mM SLS as a dissolution medium, with USP-I and II apparatuses in which apparatus-II at RPM of 75 was finalized for dissolution test of developed formulation. Cumulative drug release from omeprazole DDR formulation was obtained more than 85%; at 105 minutes and % RSD among the six units were <5%. Discriminatory power of dissolution media was checked by dissolution of omeprazole DR and ER pallets separately with similar dissolution conditions (Fig. 1). Omeprazole DR pellets were completely released the drug within 15 minutes time while, at same time interval, drug releases from ER pellets were nil. The advanced dissolution test was shorter and ensures discrimination of DR and ER part without potential degradation of omeprazole in dissolution media (QTTP), which impels that drug release from omeprazole DDR capsule at the 15 minutes intervals, is due to DR part only, whereas, 105 minutes drug release is the combination of DR and ER part (Fig. 1). Thus, the advanced method was suitable to check the quality of the product during routine QC testing.
DOE for ruggedness of the dissolution media
Omeprazole degrades at low pH [11,12], to ensure the complete drug release; pH was specified as one of the CTPs for DOE. Finalized dissolution media were a mixture of phosphate buffer and hydrochloric acid. Consequently, increase the volume of dissolution media will increase the concentration of hydronium ion, which may degrade the drug during the dissolution test. Hence, volume of the dissolution media was also selected as CTP. To reduce the test duration, surfactant was added in dissolution media, which increase the rate of drug release from the formulation; therefore, concentration of SLS was kept as one of the CTP (Table 1).
The drug release at 15 minutes due to DR part and at 105 minutes cumulative drug release for QTTP, hence, these two dissolution time points were comprised in DOE as CQAs (Table 1).
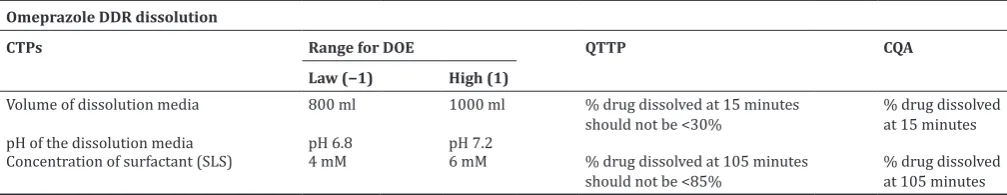
Table 1: CTP, CQA and QTTP for dissolution test Omeprazole DDR dissolution
CTPs Range for DOE QTTP CQA
Law (−1) High (1)
Volume of dissolution media 800 ml 1000 ml % drug dissolved at 15 minutes
should not be <30% % drug dissolved at 15 minutes
pH of the dissolution media pH 6.8 pH 7.2
Concentration of surfactant (SLS) 4 mM 6 mM % drug dissolved at 105 minutes
To optimize the ruggedness of the dissolution media, two levels full factorial design with three center points has been generated (Table 2) using Design Expert V8 software (Waters Corporation; Milford, Massachusetts).
DOE result for response-1 and response-2
The Shapiro–Wilk test for normality was carried out for response-1 (Fig. 2), where the p>0.10 when no terms (CMP) selected in the half-normal plot. This indicates no statistically significant effect of any CMPs, within the selected range of DOE, on response-1. In addition, the unselected terms are not normally distributed. Similarly, Shapiro–Wilk
normality test shows the p<0.1 with no terms selected (Fig. 3) in the half-normal plot for response-2. This indicates that, there are terms, which have statistically significant effects within the range selected for DOE, on this response and the unselected terms are normally distributed.
Based on above, ANOVA analysis with 95% confidence interval was performed only for the response-2. Volume and pH of the dissolution media were found the most significant CTPs (p<0.05) based on DOE (Table 3) results’ using ANOVA statics. The perturbation plot helps to compare the effect of all the factors (parameters for a method) at a specific point for the selected response. A steep slope or curvature in a factor shows that the response is sensitive to that factor, while relatively flat line shows insensitivity to change in that particular factor. If there are more than two factors, this plot could
Fig. 1: Dissolution profile of delayed release, extended release and dual delayed release
Fig. 2: Half-normal plot for response-1
Fig. 3: Half-Normal plot for response-2
Fig. 4: Perturbation graph for response-1
Table 2: Experimental design generated by Design Expert V8 Run
No. Standard order Design ID Block Type Concentration of SLS Volume of dissolution media pH of dissolution media
1 6 6 Block 1 Factorial 1 −1 1
2 11 0 Block 1 Center* 0 0 0
3 4 4 Block 1 Factorial 1 1 −1
4 10 0 Block 1 Center 0 0 0
5 2 2 Block 1 Factorial 1 −1 −1
6 8 8 Block 1 Factorial 1 1 1
7 5 5 Block 1 Factorial −1 −1 1
8 9 0 Block 1 Center 0 0 0
9 7 7 Block 1 Factorial −1 1 1
10 3 3 Block 1 Factorial −1 1 −1
11 1 1 Block 1 Factorial −1 −1 −1
be used to find those factors that most affect the response. The perturbation plot (Figs. 4 and 5) for response-1 and response-2, display the effect of all factors for chosen responses. The responses are plotted by changing only one factor over its range while holding all the other factors constant. The plots indicate no major effect of chosen parameters on response-1, while for response-2 all the parameters are significantly affecting. The design space graph (Fig. 4) shows working range of selected (p<0.05) term for certain stipulation. Here, response-2 is the combine release of DR and ER; consequently, norm for design space was set between 88 and 95%.
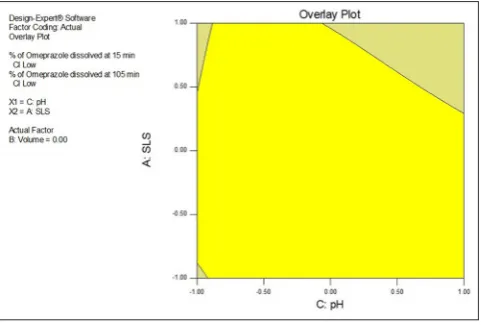
The design space, which is an imaginary area bounded by the extremes of the tested factors, of the method, can be appraised using, overlay graph (Figs. 6-8). In the graphs, the yellow region demonstrates proven acceptable working range of selected two parameters by keeping third parameters at the actual level. To get desired hypothetical in-vivo drug profile, in-vitro release of drug at 15 minutes should be >30% while the complete drug release at 105 minutes should be more than 85% (QTTP). Based on this, the criterion for design space was; 30% drug release at 15 minutes, while at 105 minutes, none of the DOE trials gave <87% cumulative release hence, it was set between 88 and 95% drug releases.
Table 3: ANOVA test results for response-1 and response-2 ANOVA statistics
Parameters selected for ANOVA analysis
Response-1 Response-2 Acceptance criteria
for ANOVA p value for
ANOVA#
Significant/not significant#
p value for
ANOVA Significant/not significant#
A-SLS concentration NA NA 0.0259 Not significant p<0.05 for significant
B-volume of media NA NA 0.0062 Significant
C-pH of media NA NA <0.0001 significant p<0.05
Model NA NA <0.0001 Significant
Lake of fit NA NA 0.5207 Not significant
Curvature NA NA 0.5004 Not significant
*NA=Not applicable, #Test not performed as p value of Shapiro–Wilk normality test is >0.1, SLS: Sodium lauryl sulfate
Fig. 5: Perturbation graph for response-2
Fig. 6: Design space (yellow) for response-1 and response-2 with respect to pH of dissolution media and sodium lauryl sulfate
concentration
Fig. 7: Design space (yellow) for response-1 and response-2 with respect to volume of dissolution media and sodium lauryl sulfate
concentration
All the CTPs which affect the quality of product were well within design space. Hence, the dissolution test is suitable and robust to check the routine quality of omeprazole DDR capsule.
CONCLUSION
A simple, fast and robust method for dissolution test was developed for omeprazole DDR capsules based on QbD principles. The huskiness of the dissolution media assessed using DOE, by considering pH, volume of media and concentration of SLS as CTPs. The DOE results verified the developed dissolution test to be rugged and reproducible. The test can be used for routine quality control purpose of an ER formulation with acid labile drug.
ACKNOWLEDGMENTS
The authors would like to thank the management of Dr. Reddy’s Laboratories Ltd. for their valuable support and permission to carry out and published the work. Authors also would like to thank all the colleagues and experts for their support during the development of method and execution of experimental design.
REFERENCES
1. Prasanthi NL, Rao NR, Manikiran SS. Studies on dissolution enhancement of poorly water soluble drug usig water soluble carriers. Asian J Pharm Clin Res 2010;3(2):95-7.
2. Van Buskirk GA. Dissolution testing as a quality control tool during scale-up of immediate release oral, solid dosage form. Dissolution Technol 1995;2(3):3-8.
3. Kramer J, Grady LT, Gajendran J. Historical development of dissolution testing. In: Dressman J, Krämer J, editors. Pharmaceutical Dissolution Testing. Boca Raton, FL: Taylor & Francis Group; 2005. p. 1-37. 4. Anand O, Yu LX, Conner DP, Davit BM. Dissolution testing for generic
drugs: An FDA perspective. AAPS J 2011;13(3):328-35.
5. USFDA & CDER: Guidance for Industry Dissolution Testing of Immediate
Release Solid Oral Dosage Forms. Available from: http://www.fda. gov/downloads/Drugs/GuidanceComplianceRegulatoryInformation/ Guidances/ucm070237.pdf. [Last seen on 2014 Oct 21; Last cited on 1997 Aug].
6. Vaghela B, Kayastha R, Bhatt N. Development and validation of dissolution procedures. J Appl Pharm Sci 2011;1(3):50-6.
7. Kramer J, Steinmetz R, Stippler E. Dissolution method development with a view to quality control. In: Dressman J, Krämer J, editors. Pharmaceutical Dissolution Testing. Boca Raton, FL: Taylor & Francis Group; 2005. p. 315-49.
8. Dickinson PA, Lee WW, Stott PW, Townsend AI, Smart JP, Ghahramani P, et al. Clinical relevance of dissolution testing in quality by design. AAPS J 2008;10(2):380-90.
9. Trivedi B. Quality by design (QbD) in pharmaceuticals. Int J Pharm Pharm Sci 2012;4(1):17-29.
10. Lingam M, Almareddy RS, Vagisha S. Modified Release Benzi Imidazole Formulations. United States Patent WO2012092486 A2. Dr. Reddy’s Laboratories, Inc.; 2012.
11. Farinha A, Bica A, Martins JM, Pais JP. Dissolution of omeprazole from delayed-release solid oral dosage forms. Drug Dev Ind Pharm 2000;26(7):785-90.
12. Mathew M, Gupta VD, Rodney EB. Stability of omeprazole solutions at various ph values as determined by high-performance liquid chromatography. Drug Dev Ind Pharm 1995;21(8):965-71.
13. Klein S, Wunderlich M, Dressman J. Development of dissolution tests on the basis of gastrointestinal physiology. In: Dressman J, Krämer J, editors. Pharmaceutical Dissolution Testing. Boca Raton, FL: Taylor & Francis Group; 2005. p. 193-227.
14. Stippler E, Kopp S, Dressman J. Comparison of US pharmacopeia simulated intestinal fluid TS (without pancreatin) and phosphate standard buffer pH 6.8, TS of the international pharmacopoeia with respect to their use in in vitro dissolution testing. Dissolution Technol 2004;11(2):6-10.