Global irradiation effects, stem cell genes
and rare transcripts in the planarian transcriptome
MIREILLE GALLONI*
University of Montpellier 2 and CNRS UMR 5237, Montpellier, France
ABSTRACT Stem cells are the closest relatives of the totipotent primordial cell, which is able to spawn millions of daughter cells and hundreds of cell types in multicellular organisms. Stem cells are involved in tissue homeostasis and regeneration, and may play a major role in cancer develop-ment. Among animals, planarians host a model stem cell type, called the neoblast, which essentially confers immortality. Gaining insights into the global transcriptional landscape of these exceptional cells takes an unprecedented turn with the advent of Next Generation Sequencing methods. Two Digital Gene Expression transcriptomes of Schmidtea mediterranea planarians, with or without neoblasts lost through irradiation, were produced and analyzed. Twenty one bp NlaIII tags were mapped to transcripts in the Schmidtea and Dugesia taxids. Differential representation of tags in normal versus irradiated animals reflects differential gene expression. Canonical and non-canonical tags were included in the analysis, and comparative studies with human orthologs were conducted. Transcripts fell into 3 categories: invariant (including housekeeping genes), absent in irradiated animals (potential neoblast-specific genes, IRDOWN) and induced in irradiated animals (potential cellular stress response, IRUP). Different mRNA variants and gene family members were recovered. In the IRDOWN class, almost all of the neoblast-specific genes previously described were found. In irradiated animals, a larger number of genes were induced rather than lost. A significant fraction of IRUP genes behaved as if transcript versions of different lengths were produced. Several novel potential neoblast-specific genes have been identified that varied in relative abundance, including highly conserved as well as novel proteins without predicted orthologs. Evidence for a large body of antisense transcripts, for example regulated antisense for the Smed-piwil1 gene, and evidence for RNA shortening in irradiated animals is presented. Novel neoblast-specific candidates include a peroxiredoxin protein that appears to be preferentially expressed in human embryonic stem cells.
KEY WORDS:
planarian, DGE, irradiation, neoblast, mRNA variant
Introduction
One of the most fascinating aspects of metazoan biology is that starting with a single cell and a unique genome, different cell types and up to several billion cells can be produced following an extremely precise building plan.
Once launched, developmental programs lead to the sorting of the primordial cell’s descendants into different tissues and higher-order structures with restricted genomic information access, and in which cellular turnover and tissue repair occur following mecha-nisms in close relation with the original developmental processes. In the adult body, a small population of cells resembling the primordial cell, the stem cell population, is in charge of tissue
www.intjdevbiol.com
*Address correspondence to: Mireille Galloni. University of Montpellier 2 & CNRS UMR 5237, PFR Biologie Santé, CC 091, Place Eugène Bataillon,
F-34095 Montpellier, France. e-mail: [email protected]
Supplementary Material (4 supplementary data sets) for this paper is available at: http://dx.doi.org/10.1387/ijdb.113455mg
Final, author-corrected PDF published online: 16 March 2012
ISSN: Online 1696-3547, Print 0214-6282 © 2012 UBC Press
Printed in Spain
Abbreviations used in this paper: AE, anchoring enzyme; AS, antisense; DGE, digital
gene expression; hesc, human embryonic stem cells; INV, invariant tags; IR, irradiated; IRDOWN-3.5X, tags decreased more than 3.5-fold in IR animals; IRUP-3.5X, tags increased more than 3.5-fold in IR animals; N, normal; NGS, next generation sequencing; occ, occurrence, number of times a tag has been sequenced; R1, rank 1, canonical tag, or 3’-most tag of a sequence; Smed, Sm & Sme, Schmidtea mediterranea; ∑occN+IR, sum of tag occurrences in the N and IR libraries; tpm, tags per million.
their progeny. Likewise, specific transcriptional programs underlie the stem cells lifestyle changes, leading them from toti/pluri or multipotency towards differentiation. This is illustrated by the fact that pluripotency can be induced in differentiated cells by ectopic expression of a small number of transcription factors (Takahashi and Yamanaka 2006; Maekawa et al., 2011).
The transcription processes that primarily reveal the encrypted genetic information lead to the production of different types of mes-sages: polyadenylated or non-polyadenylated transcripts, coding, non-coding, structural, regulatory, or catalytic RNAs, belonging to different categories, mRNAs, rRNAs, tRNAs, sn- and sno-RNAs, lincRNAs, mi and piRNAs, molecules with or without precursors, splice variants, antisense species, and even chimeras occurring through trans or cis-splicing mechanisms.
Several regulation modes can be used to fine tune transcription, from the amount of RNA produced to spatio-temporal expression, from RNA processing or sequestration to epigenetic silencing of genes. These different and combinatorial readings of DNA ensure, from a relatively simple starting code, a degree of complexity in agreement with the diversity of cell types and cellular responses observed in the living.
The great differentiation potential, progeny production and self-renewing properties of stem cells are of tremendous interest to the scientific and medical community. This knowledge could help understand and treat diseases and injuries, promote tissue or organ replacement, or control aberrant cell populations.
In the regenerative medicine field, understanding the cues that drive cells to undertake the task of renewing a tissue is crucial. Multiple interdisciplinary and integrated approaches are used to gain insights into this complex phenomenon. In addition, differ-ent organisms are studied to address the many issues raised by the regenerative process, from the recruitment of progenitor cells to the correct patterning, integration and rewiring with the surrounding tissues, while avoiding tumor-formation (Oviedo & Beane 2009; Tanaka & Reddien 2011).
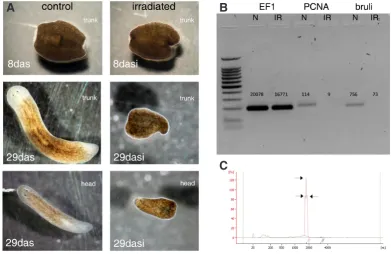
Fig. 1. Regeneration tests, RT-PCR controls and RNA profiles in nor-mal and irradiated aninor-mals. (A) IR animals were unable to regenerate 1 month after severing, contrary to N animals. das: days after severing; dasi: das after irradiation. (B) RT-PCR for Smed-EF1, Smed-PCNA and
Smed-bruli, and observed number of R1 tags in the N and IR libraries. (C)
Agilent bioanalyser profile of Smed total RNAs showing one peak with three indents corresponding to the 18S and potentially two moieties of 25S rRNAs.
tion is achieved through the recruitment of a large population of stem cells called neoblasts, scattered throughout the body and mobilized for tissue homeostasis and injury repair (Shibata et
al., 2010; Wagner et al., 2011). An envied feature of planarian
is the possibility to regenerate the brain. In addition, increasing evidence suggests that the nervous system plays a major role in regeneration. Several genes specifically expressed in neoblasts have been implicated in the regenerative process, including ortho-logs of the piwi, bruno-like, wnt pathway, b-catenin, BMP, PTEN, nanos, Hsp70, Rb gene families, transcription and translation factors (Gentile et al., 2011 and references therein).
The transcriptomics field that aims to study all the transcripts a cell can produce is expanding rapidly, with the advent of the evolving Next Generation Sequencing (NGS) technologies. Briefly, NGS transcriptomics methods concern whole RNA sequencing (i.e. RNA-seq) or RNA short tag sequencing, (i.e. Digital Gene Expression: DGE), with specialized protocols for small RNAs (Metzker 2010).
While none of the current methods allows coverage of the full range of transcripts, a richness lies in these novel datasets that allows exploration of transcriptomes with unprecedented depth. Taking advantage of the amenability of DGE, this report describes an exploitation of a comprehensive set of Schmidtea
mediterranea expressed genes to gain global insights on the
potential ensemble of polyadenylated transcripts expressed in the planarian neoblasts. DGE transcriptomes of animals with or without neoblasts lost through irradiation meeting DGE experi-ments high standards were obtained, and mRNA tag abundance was compared across the samples.
Non-canonical tags were included in the analytic process, which led to the discovery of global effects on transcription after X-ray irradiation, revealed the existence of antisense transcripts in the planarian transcriptome and the presence of mRNA variants. Novel genes including rare transcripts, gene pathways potentially active in neoblasts and others up regulated in irradiated animals
B
C
A
regenera-are described. Notably, several of the novel neoblast genes conserved throughout the species are preferentially expressed in human embryonic stem cells.
Results
Sample preparation, controls and digital gene expression (DGE) analysis
Irradiated planarians lose their pools of stem cells and their ability to regenerate. This effect of irradiation was used to infer the transcriptome of neoblasts by studying genes missing in ir-radiated animals, as classically performed. Because normal (N) and irradiated (IR) animals are compared, the differences between the samples are due in part to the missing stem cell population or to the X-ray treatment.
Irradiated animals received a 30 Grays X-ray dose and RNA was collected 7 days after irradiation. This high irradiation dose was chosen to compare the neoblast transcriptomic signatures obtained in Dugesia japonica (Dj) (Rossi et al., 2007). Each day after irradiation, animals of the N and IR samples were severed into three parts, head, trunk and tail, for regeneration tests. None of the amputated irradiated animals reconstituted the missing body parts. Furthermore, RT-PCR experiments demonstrated the loss of neoblast-specific gene expression (e.g. Smed-bruli and MCM2), and the maintenance of housekeeping genes such as Smed-EF1 in IR animals (Fig. 1). The RNA samples then followed the DGE procedure.
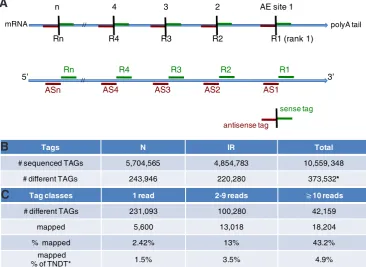
In 3’ tag DGE, tag position along polyA trapped RNAs is first determined by the action of a 4-bp recognition site type II restriction enzyme, AE (Velculescu et al., 1995). If the cutting efficiency of the AE enzyme is 100%, only the 3’-most tag, closest to the polyA tail, will be extracted from each mRNA present in a sample. This 3’-most tag is classically referred to as the canonical or R1 (rank 1) tag. However, in SAGE and DGE experiments the AE cutting efficiency, although very high and largely reproducible, is not 100%. Furthermore, extraction of non-canonical tags can result from the production of a bona fide mRNA size variant or isoform, unrelated to the AE cutting efficiency. Thus, tags other than the canonical 3’-most tag can be extracted from each mRNA molecule. For each polyA RNA, several tags can be obtained, referred to as R1, R2, Rn, depending on the number (n) of AE sites. Rn is the 5’ most tag of a given sequence. Furthermore, by definition, each AE site delimitates two tags, a sense tag and an antisense tag (Fig. 2A).
Transcriptome results and identification of gene variants
Two NlaIII DGE libraries were obtained from N and IR animals, generating 21bp tags from polyA RNAs.
More than 5.7 and than 4.8 million tags were sequenced in the N and IR libraries, respectively (>10.5 million total). These represent 373,532 different tags, with 243,946 and 220,280 different tags in N and IR, respectively (Fig. 2B and Supplemental Data 1). With sequence reads over 3 million and a tag diversity of more than 200,000, it is expected that gene detection is reaching saturation in humans, except for the (rare) transcripts that do not have NlaIII
Fig. 2. Transcriptome general results. (A) Tag ranks and AE sites along polyA RNAs.Tags are numbered according to their position (rank) relative to the polyA tail of a transcript with n AE sites. R: sense tags (above, green). R1: 3’-most tag. AS: antisense tags (below, red). AS1: 3’-most AS tag of the sense transcript. Rn/Asn: 5’-most tags. (B) Total number of tags sequenced in the N and IR libraries. The total number of different tags (TNDT)* includes common IR and N tags and tags sequenced in one of the libraries only.
(C) Number and percentage of tags mapped against the Schmidtea and Dugesia taxids according to the number of sequences/reads.
Tags N IR Total
# sequenced TAGs 5,704,565 4,854,783 10,559, 348
# different TAGs 243,946 220,280 373,532*
Tag classes 1 read 2-9 reads ≥10 reads
# different TAGs 231,093 100,280 42,159
mapped 5,600 13,018 18,204
A
sites (‘t Hoen et al., 2008).Tag occurrence (occ) is the numberof times a tag has been sequenced in a sample.
61.86% of the tags, (231,093 tags), were seen only once across the librar-ies, i.e. tag occurrence sum =1 across both banks (abbreviated henceforth ∑occN+IR=1). In the remaining 38.14% (142,439 tags), 26.84% have been sequenced between 2 and 9 times (2≥∑occN+IR≤9), and 11.28% more than 10 times ((∑occN+IR≥10).
Out of the 373,532 different tags sequenced in the N and IR banks, ~10% were mapped to a known transcript using the publicly available ESTs and mRNAs datasets from the Schmidtea and Dugesia NCBI taxids (perfect match). For comparison, this number rises up to ~15% when using the 454 whole transcriptome (454BCN) of (Abril et al., 2010).
The vast majority of the largest tag category, the ∑occN+IR=1 tags, did not map to known planarian ESTs or mRNAs: only 2.42% of the single tags matched sequences deposited on NCBI (4.6% in 454BCN).
∑occN+IR≥10 tag group, 43% of tags matched a sequence (59% in 454BCN) (Fig. 2C).
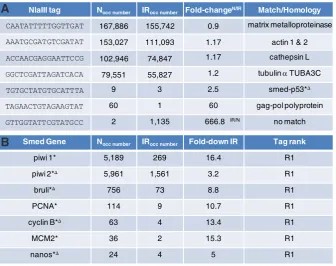
The highest occurrence in the libraries was 167,886 in N (29,430 tags per million /t.p.m, also referred to as RPM: reads per million) and 155,742 in IR (32,080 t.p.m) for a canonical tag belonging to a potential matrix metalloproteinase Smed ortholog (human MMP13). Other examples of tags with very large occurrences included tags belonging to actin genes, a cathepsin-L ortholog (Zayas, Hernández et al., 2005), a tubulin a similar to human TUBA3C, with ∑occN+IR= 264,120, 177,793, and 135,378 respectively, for a ratio N/IR close to 1. For comparison, occurences for the Smed-p53 gene (Pearson and Sánchez Alvarado 2010) were as low as 9 in N, and 3 in IR (Fig. 3).
The fold increase between both banks was up to 60 in the N library versus the IR library, and up to 660 in IR versus N. In other words, the greatest differences between both banks was for a tag represented 60 times more in N than in IR, and for a tag represented 660 times more in IR than in N. While the former tag has been mapped to a transcript showing similarities with a gag-pol polyprotein, which suggested homology with retrotransposon sequences (Contig_Planarian_90e_16927, (Abril et al., 2010)), the latter has not been mapped (Fig. 3A).
The analysis of the most abundant actin gene tag showed that it is possible to distinguish the expression of two highly
Fig. 3. Abundant tags, high fold-changes and known genes in the N and IR libraries. (A)
Highest occurrences (occ) and fold-changes between N and IR. The most abundant tag in both libraries maps to a human MMP13 matrix metalloproteinase ortholog. The highest fold-difference between N and IR is for a tag increased more than 660 times in irradiated animals. Occ numbers are raw. Fold-changes (N/IR) are normalized. All tags begin with 5’CATG. (B) Examples of
previ-ously described neoblast-specific genes found in N and IR. All of these genes show an R1 tag fold-decrease in IR of more than 5X except Smed-piwil2. Other genes not included: for example
Smed-wnt2-1&11-1 & wntP1-3, Smed-sFRP1, Smed-bcat1&2. *Neoblast genes Δ implicated in
the regenerative process.
NlaIII tag Nocc number IRocc number Fold-changeN/IR Match/Homology
CAATATTTTTGGTTGAT 167,886 155,742 0.9 matrix metalloproteinase AAATGCGATGTCGATAT 153,027 111,093 1.17 actin 1 & 2 ACCAACGAGGAATTCCG 102,946 74,847 1.17 cathepsin L GGCTCGATTAGATCACA 79,551 55,827 1.2 tubulin αTUBA3C TGTGCTATGTGCATTTA 9 3 2.5 smed-p53*∆
TAGAACTGTAGAAGTAT 60 1 60 gag-pol polyprotein GTTGGTATTCGTATGCC 2 1,135 666.8 IR/N no match
Smed Gene Nocc number IRocc number Fold-down IR Tag rank
piwi 1* 5,189 269 16.4 R1
piwi 2*∆ 5,961 1,561 3.2 R1
bruli*∆ 756 73 8.8 R1
PCNA* 114 9 10.7 R1
cyclin B*∆ 63 4 13.4 R1
MCM2* 36 2 15.3 R1
nanos*∆ 24 4 5 R1
B
A
genome, and perhaps unconventional forms of RNA processing leading to the productionof chimeras (for example see (Zayas, Bold
et al., 2005)). The mapping process greatly
depends on the degree of genome annotation available. Thus, tag mapping in the present N and IR DGE libraries is currently incomplete but will improve as the reference genome becomes more annotated.
Although it is undeniable that tag matching will augment with the novel whole transcrip-tome datasets described in (Abril et al., 2010; Blythe et al., 2010; Adamidi et al., 2011) as they become coordinated (Sandmann et
al., 2011), and as genome annotation
im-proves, the present analysis is focused on mapping against the previous classic ESTs and mRNAs NCBI deposited banks. First, at least 1065 of these sequences have been assessed in gene silencing experiments (Reddien et al., 2005). Second, in the ab-sence of a reference genome and a uniform reference transcriptome, cross-examination of global tag mapping across several inde-pendent databases is complex and is bound to remain incomplete.
In summary, the present N and IR DGE libraries largely meet DGE experiments high standards. Although rare transcripts may be found in the 2≥∑occN+IR≤9 tag category since the Smed-wntP1, Smed-wntP-3 and
Smed-AbdA (Iglesias et al., 2008; Petersen
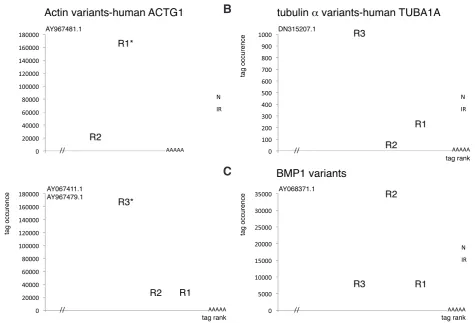
& Reddien 2008a) canonical tags belong to this group, the following differential gene related actin transcripts in normal and irradiated animals. Indeed, highly similar, but not identical, Smed actin ESTs share this tag (∑occN+IR= 264,120). In one case, AY967481.1 (gi#62199111, UniGene Sme.13855), this tag is the canonical R1 tag, closest to the polyA tail, whereas in the other, AY067411.1 (gi#2138044, Sme.13884) & AY967479.1 (gi#62199109, Sme.851), it was in R3 position (third tag from the polyA tail) (Fig. 4A). This strongly suggests that the major contributor to this highly expressed sequence was the former gene and not the latter. Interestingly, a similar situation has been observed in Schmidtea polychroa, where differential expression of highly related actin isoforms has been shown (Fagotti et al., 1998).
Other examples showed that, based on the same observation of tag abundance relative to the rank, it was possible to detect potential 3’ variants, as described in Fig. 4 B-C for a human TUBA1A and a human BMP1 orthologs.
Hence, in some instances at least, analysis of canonical and non-canonical tags gave insights into the differential contribution of related genes and the detection of isoforms.
tubulin
expression analysis will be focused on the ∑occN+IR≥10 tag category, among which 18,204 (5% of the total number of tags) were mapped to planarian expressed sequences/mRNAs of the Schmidtea and Dugesia taxids.
Potential neoblast-specific genes
Prior to the analysis of overall differences between N and IR, the status of known neoblast genes was checked in both libraries. This analysis revealed that most, if not all, already known neoblast-specific genes were differentially represented in N and IR (Fig. 3B). Many of these genes have been silenced in vivo and involved in the regenerative process. The fact that these genes are detected with an expected differential between N and IR constitutes a strong validation of both datasets.
In these datasets, the Smed-piwil2 canonical tag showed a 3.2-fold decrease in IR versus N. To account for neoblast-specific genes falling into the same expression range as Smed-piwil2, a 3-fold difference between N and IR should be considered (2,681 ∑occN+IR≥10 tags). However, to facilitate the analysis while keeping close to the Smed-piwil2 N-IR differential, the primary selection threshold was set for tags (∑occN+IR≥10) showing at least a
3.5-fold (3.5X) difference between N and IR (Supplemental Data 2). This filtering procedure revealed that 1,933 tags were ≥ 3.5X increased in N versus IR. This tag collection, the IRDOWN-3.5X tag class, represents potential neoblast-specific genes. Conversely, 5,200 tags were increased more than 3.5X in IR versus N. This class of tags, IRUP-3.5X, represents genes induced in irradiated animals and potentially involved in the cellular response to stress. Finally, 10,230 tags were found to be largely invariant (INV0.8-1.2 tag class, selected for a ratio N/IR of between 0.8 and 1.2). Subsets of tags with a minimum 5-fold difference between N and IR, re-ferred to as IRDOWN-5X (1,074 tags) and IRUP-5X (3,487 tags), and an INV0.9-1.1 invariant class (5,160 tags), were also analyzed. Examples of previously described genes found to have invariant R1 tags in the N and IR transcriptomes include Smed-TCEN49 (∑occN+IR=16,844), Smed-ctnnb1 (EU296629.1, gi#166209943) (∑occN+IR=1,137), Smed-bcat1 (EU082826.1, gi#158714112) (∑occN+IR=35), Smed-wntP-2/wnt11-5 (∑occN+IR=177) (Bueno et
al., 2002; Petersen & Reddien 2008; Iglesias et al., 2008; Gurley et al., 2010).
Because sense and antisense tags of several ranks were consid-ered here, different tags can belong to the same parent sequence
Fig. 4. Transcript variants in normal and irradiated animals. (A) Actin variants, human ACTG1 orthologs. AY96781.1 and AY067411.1/AY967479.1 are planarian actin ESTs sharing 80% identities and one highly abundant tag*, in R1 and R3 position, respectively. This tag is invariant in N and IR. AY96781.1 is likely to be the major parent of this tag, thus the most abundant transcript of this ACTG1-related gene. Note: although AY067411.1 and AY967479.1 sequences are 96% identical, they are placed in different Unigenes, Sme.13884 and Sme.851, respectively. (B) Smed tubulin a/TUBA1A: the R3 tag is more abundant than R1 (>5X) in N and IR, suggesting that a shorter polyadenylated version of this gene is produced. This is supported by the fact that R2 tags are very scarce (2 tags in N+IR). Both versions appear strongly reduced in IR: 15X for R3 (short), 8X for R1 (long). Another TUBA1A and several other tubulin a, b, g, genes have been detected in N and IR: TUBA3C (R1: ∑occN+IR=135,378, N/IR:1.2), TUBA3E, TUBA4A, TUBB, TUBB2C, TUBG1. (C)
Sme.240, human BMP1: the R2 tag is about 10 times more abundant than R1 in both N and IR (R1 ratio N/IR=1 ; R2 ratio N/IR=1.2), also suggesting the existence of isoforms.
B
(identified with a gi number). Furthermore, because the mapping was performed on the non-clustered EST/mRNAs of the Schmidtea and Dugesia taxids, the final number of matching planarian genes was lower than the number of gi. Finally, not all of the tags found a match (see previous section). For tags with multiple matches, because in most cases the ESTs had the same human ortholog and belonged to the same Unigene, only one parent sequence was considered here.
In IRDOWN-3.5X, 525 tags out of 1,933 were mapped to pla-narian ESTs/mRNAs. Sequence homology searches against the nr/nt (data not shown) and the human refprot (HRP) databases revealed that 34% of these sequences did not share obvious ho-mologies with other species. The remaining sequences amount to 329 genes with potential orthologs in other species, including 301 human genes. The following analysis will be focused on the planarian genes with human orthologs, excluding at the moment several high occurrence and/or high fold-difference tags unmapped or belonging to planarian genes with unknown orthologs (Fig. 5).
Several gene families are represented in IRDOWN-3.5X. For example 5 members of the MCM family, with a remarkable con-sistence in tag occurrences (Supplemental Data 3), 5 Zinc-finger proteins, at least 3 TNF members, 3 CDKs, 3 serine/threonine protein kinases, several methyl-transferases, chromatin-associated proteins, transcription factors, ribosomal proteins etc. KEGG
pathway enrichment analysis against the whole human genome reveals significant enrichment for cell cycle and DNA repair genes as expected, but also for the insulin and neurotrophin signalling pathways.
In the IRDOWN-3.5X mapped class, the highest occurrence tag and highest fold-difference after Smed-piwil1/humanPIWIL1 (16X down in IR; ∑occN+IR=5,189), belongs to a peroxiredoxin hu-man PRDX2 ortholog (R1 17X down in IR; ∑occN+IR=3,823). In the same range as Smed-bruli/CELF3 (9X down in IR, ∑occN+IR=829), a tubulin a/TUBA1A family member highly reduced in IR animals was detected (15X down in IR, ∑occN+IR=975). This was in striking contrast with the TUBA3C related gene that is expressed at very high similar levels in N and IR (ratio N/IR: 1.2; ∑occN+IR = 135,378) (Fig. 3A). Interestingly, tag rank analysis reveals that the most abundant tag for this TUBA1A ortholog was the R3 tag, not the canonical R1, in both N and IR. This strongly suggests that it is a TUBA1A short isoform that is predominantly expressed in the animals, and reduced in the IR sample (Fig. 4C).
Transcription factors found in this list generally show low tag occurrence numbers. Examples include a SOX5 homeobox pro-tein ortholog with a 6X-down R1 tag in IR, ∑occN+IR=16. These numbers are in the same range as for the Smed-nanos/NANOS1 gene, 5X-down, ∑occN+IR=28. In this class of rare tags, orthologs of the RAD51 DNA damage repair and CHEK1 kinase checkpoint
Fig. 5. Number of tags decreased in irradiated animals and potential neoblast-specific genes. (A) 1,933 out of 18,204 tags (∑occN+IR≥10 category) are decreased more than 3.5Xin IR. 525 tags have been mapped to planarian ESTs/mRNAs (NCBI). Out of 513 planarian transcripts recovered, 301 share homology with human genes (329 all species taken together, 184 without orthologs).1,074 tags are decreased more than 5X (257 planarian transcripts including 162 human orthologs). (B) KEGG pathways significantly represented in the IRDOWN-3.5X class. hsa: homo sapiens.
1 2 IRDOWN 3,5X tags
1 2 IRDOWN 5X tags
525 mapped 1,408
not mapped
KEGG pathway Hugo Gene Nomenclature Committee symbol pvalueadj DNA replication
hsa03030 LIG1,MCM2,MCM3,MCM4,MCM5,MCM7PCNA,POLA2,POLD2,RFC1,RFC2,RPA2 2.58E-12
cell cycle
hsa04110 CCNB1,CCNB3,CDC45L,CHEK1,ESPL1MCM2,MCM3,MCM4,MCM5,MCM7
PCNA,RBX1,YWHAB,YWHAE 5.53E-08
mismatch repair
hsa03430 LIG1,MSH2,PCNA,POLD2,RFC1,RFC2RPA2 8.25E-07
nucleotide excision repair
hsa03420 ERCC2,LIG1,PCNA,POLD2,RBX1,RFC1RFC2,RPA2 1.10E-05
Spliceosome
hsa03040 BCAS2,CDC5L,DDX23,DHX15,DHX38HNRNPK,SART1,SFRS4,SNW1,TRA2A
WBP11 2.15E-04
oocyte meiosis
hsa04114 AURKA,CALM1,CCNB1,ESPL1,PPP1CAPPP1CC,RBX1,YWHAB,YWHAE 3.56E-04
base excision repair
hsa03410 LIG1,PARP2,PCNA,POLD2,UNG 2.12E-03
pathways in cancer
hsa05200 BCL2L1,FGFR3,HSP90AA1,MMP2/9,MSH2RAD51,RBX1,TCEB2,TPR,TRAF1,TRAF2
TRAF3/6 3.02E-03
insulin signalling
hsa04910 CALM1,EIF4E,FLOT1,PCK1,PPP1CAPPP1CC,PRKAB2,SOX5 8.18E-03
homologous recombination
hsa03440 MUS81,POLD2,RAD51,RPA2 8.98E-03
neurotrophin signalling
hsa04722 CALM1,MAPK13,PTPN11,SOX5,TRAF3/6YWHAB,YWHAE 2.13E-02
bladder cancer
hsa05219 FGFR3,MMP2/9,SOX5 3.54E-02 lysine degradation
hsa00310 DLST,PLOD3,SETD8,SETMAR 4.95E-02 513 planarian transcripts
301 human orthologs
268 mapped 806
not mapped 257 planarian transcripts
162 human orthologs
genes are also present (30X-down, ∑occN+IR=30, and 10X-down, ∑occN+IR=37, respectively), as well as two histone binding Rb-related RBBP4 and RBBP7 orthologs: 6X-down; ∑occN+IR=24, and 10X-down; ∑occN+IR=38, respectively. Interestingly, the RBBP4 ortholog found here, which corresponds to Unigene Sme.4240, is not the same as the one described in (Rossi et al., 2007; Bonuc-celli et al., 2010) which corresponds to Sme.7595. In the present transcriptomes, the Sme.7595/RBBP4 R1 tag showed a ratio N/ IR=1.8, for a ∑occN+IR=618.
Rossi et al., (Rossi et al., 2007), described a Dj neoblast signature uncovered in a microarray analysis. This signature was compared to IRDOWN-3.5X, after recovery of up-to-date Dj human gene
or-thologs as a means to compare both gene lists (blastx Dj against human refprot/HGNC). Several genes were common to both lists, including RBBP4, H2FAFZ, SET, HSPD1, MCM2, PIWIL1.
However, in several cases, whereas the human orthologs were the same, the Smed and Dj orthologs did not match, as for ex-ample in the RBBP4 case described above, but also HSPD1 and MCM2 (tblastx of corresponding Dj against Smed). An in-depth comparison of Smed and Dj gene signatures will thus require establishment of homology relationships between both species on a gene to gene basis.
In summary, in the present report, 301 known and novel potential neoblast-specific genes with human orthologs have been identified
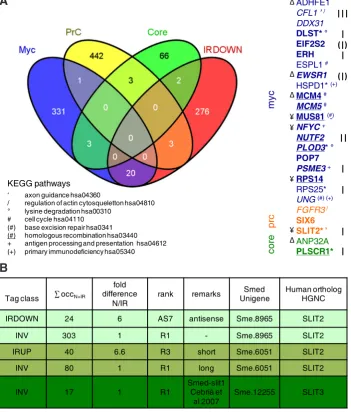
Fig. 6. Genes shared between the planarian IRDOWN list and the human ES transcriptional modules. (A) Among 301 IRDOWN-3.5X genes, 25 are found in the human ES modules (871 genes).
Bold: ratio N/IR ≥5X; bold underlined: ratio N/IR ≥10X; italic: also found in hesc-hs0238 DGE tran-scriptome (tags ≥3-fold up). I: antisense tag in IRDOWN; II: antisense tag in hs0238. III: antisense tag in IRDOWN and hs0238; (I): no poly A tail. Genes found in the same KEGG pathways are shown.
Δ: predicted targets of hsa-mir-106b, adj. pvalue 3.28289E-3; ¥: predicted targets of hsa-mir-105, adj pvalue 4.83151E-3. (B) Smed SLIT orthologs. Sme.8965/SLIT2, Sme.6051/SLIT2 and Sme.12255/ SLIT3 R1 tags are found invariants in N and IR.An antisense Sme.8965/SLIT2 could be neoblast-specific (lost in IR animals). A shorter version of Sme.6051/SLIT2 could be induced in IR animals.
in the N and IR libraries, among which 162 genes with tags decreased at least 5X in irradiated animals, and 61 decreased more than 10X.
Comparisons with human stem cells
To gain insights into potentially conserved stem cell features, the 301 IRDOWN-3.5X genes with human ortho-logs were compared to the human embry-onic stem cells (hesc) ES transcriptional modules recently identified (Kim et al., 2010) and to an hesc DGE library, hs0238 (SAGEgenie).
25 of the IRDOWN-3.5X genes were found in the ES modules (Fig. 6A and Supplemental Data 4). Most of these genes belonged at least two by two to common KEGG pathways. Furthermore, all of these genes appear to be targets of the same miRNAs at least two by two (miRBase, human). For example, human SLIT2 and SIX6 are predicted targets of hsa-mir-144, and ADHFE1, ANP32A, EWSR1 and MCM4 of hsa-mir-106b. Several other members of the same path-ways and potential targets of the same miRNAs were also found in the rest of the IRDOWN-3.5X list.
Surprisingly, 6 of the genes found in the Myc, PrC, Core modules and IRDOWN-3.5X were also found in the IRUP gene list, i.e. on opposite tag classes: SLIT2, PLOD3, HSPD1, DLST, PLSCR1, RPS25. Furthermore, SLIT2, PLOD3 and HSPD1 orthologs were also found in the INV0.8-1.2 list. Analysis of the corresponding pla-narian sequences found in the different tag classes revealed that they are not all identical even if they match to the same human ortholog, except for DLST, RPS25 and one of two PLOD3. In fact, the pla-narian sequences correspond to different members of the same family.
Notably, in the case of the slit planarian orthologs, three Smed Unigenes behaved differently: Sme.12255, Smed-slit1 (human
ADHFE1
‘ axon guidance hsa04360
/ regulation of actin cytosqueletton hsa04810
° lysine degradation hsa00310
# cell cycle hsa04110
(#) base excision repair hsa0341
(#) homologous recombination hsa03440
+ antigen processing and presentation hsa04612
(+) primary immunodeficiency hsa05340
IRDOWN 24 6 AS7 antisense Sme.8965 SLIT2
INV 303 1 R1 - Sme.8965 SLIT2
IRUP 40 6.6 R3 short Sme.6051 SLIT2
INV 80 1 R1 long Sme.6051 SLIT2
INV 17 1 R1 Smed-slit1Cebrià et
al 2007 Sme.12255 SLIT3
SLIT3) (Cebrià et al., 2007) R1 tag was invariant at a very low oc-currence, whereas Sme.6051 tags (SLIT2) were found in INV and IRUP classes. In this case, it appears that there are two variants for this gene: an invariant long version, and a short version that is increased in irradiated animals (see below, “Global response to irradiation”). Finally, Sme.8965 (SLIT2) was invariant, except that an antisense tag may be preferentially expressed in neoblasts, sug-gesting that a regulated antisense transcript exists for this gene (see below “A piwil1 antisense RNA lost in irradiated animals” (Fig. 6B). Likewise, in the case of PLOD3, two Smed Unigenes have been identified: Sme.13692/PLOD3 shows an invariant R1 tag, whereas the Sme.9672/PLOD3 canonical tag is increased in N versus IR, but not the R2 (INV), nor the R3 and R4, increased in IR, suggesting
the existence of mRNA variants. Remarkably, PLOD3, a collagen lysyl hydroxylase, was found in the ES modules, increased in the hesc-hs0238 transcriptome and in IRDOWN-3.5X, suggesting that this gene has a conserved function in stem cells. The CFL1 cofilin 1 gene presents a notable case: CFL1 is found in IRDOWN-3.5X, the ES modules and hesc-0238, but in the human and planarian DGE libraries, it is an antisense tag which appears to be up regulated in stem cells. Peroxiredoxin genes also present an interesting case. The ES modules contain the PRDX1 family member, whereas IRDOWN-3.5X and hesc-0238 highlight the preferential expres-sion of PRDX2 (R1 tag 17x-down in IR), and an antisense tag to PRDX1 in hesc-0238.
In summary, several potential neoblast-specific genes uncovered
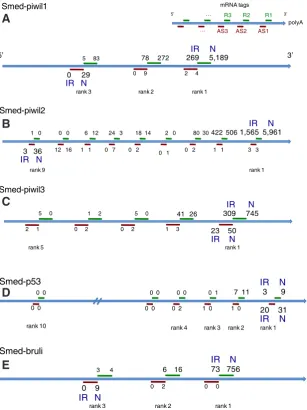
Fig. 7.Antisense tags for Smed-piwil1, 2 & 3, Smed-p53 and Smed-bruli. For each pre-dicted NlaIII tag, tag occurrence in N (right) and IR (left) are presented. (A,B) Smed-piwil1 & 2: AS tags farthest from the sense polyA tail are decreased in irradiated animals, with a 29X differential for AS3-Smwi1. (C,D) Smed-piwil3 and Smed-p53: AS tags closest to the sense polyA tail are detected, with ratios N/IR< 2. Smed-p53: AS tags are more abundant than sense tags. (E) Smed-bruli: the most abundant AS tag has been sequenced less than 10 times in N+IR.
in IRDOWN appear to be preferentially expressed in human embryonic stem cells. Several belong to gene families for which different members are either invari-ants or are preferentially expressed in normal or in irradiated animals. Furthermore, converging evidence suggests that antisense stem cell transcripts might also be conserved between the species.
A piwil1 antisense RNA lost in irradiated animals
DGE transcriptomes are analyzed according to different parameters: number of tag occurrences and fold-difference between the samples. Among the greatest differences between normal and irradiated animals, one tag showed a 29-fold increase in normal animals, with a low occurrence number: 0 in IR, 29 in N (5 t.p.m.). This tag, AS3-Smwi1, has been mapped to the Smed-piwil1 gene, in the 5’ region of the transcript, and in antisense position. For comparison, the 3’-most sense tag for Smed-piwil1, R1-Smwi1, showed occur-rence numbers of 5,189 in N (909 t.p.m.), and 269 in IR (55 t.p.m.). Antisense tags of all ranks corresponding to the Smed-piwil1 gene were also detected, although at very low occurrences (∑occ<10).
Strikingly, the sense and antisense tag occurences for Smed-piwil1 decreased with tag rank, but in op-posite directions: the most abundant sense tag was the 3’-most, whereas for the antisense tags, it was the 5’-most one (5’-3’ is relative to the Smed-piwil1 sense transcript) (Fig. 7A). Thus, AS3-Smwi1 behaves as if it was close to the 3’ end of a transcript.
These observations suggest the existence of a poly-adenylated antisense transcript for the Smed-piwil1 gene. It was not possible to know whether AS3-Smwi1 might be the 3’-most tag of a Smed-piwil1 antisense transcript, because one cannot infer the length and boundaries of an antisense transcript from a sense transcript. Mapping tags on the genome may help to solve such issues.
Attempts to validate the existence and regulation of this antisense transcript in normal versus irradiated animals by quantitative PCR have not yet proven conclusive because expression of this transcript may lie below the sensitivity threshold of qPCR.
AS3-Smwi1 was detected at low but significant levels (5 t.p.m.): indeed, 2 t.p.m is considered as a reliable DGE detection limit because it was shown that transcripts with such low occurences are detected with high reproducibility across DGE experiments (‘t Hoen et al., 2008).
The same AS3-Smwi1 tag has been detected in the X1 but not the X2 neoblast population, furthermore at a higher t.p.m. (E. Saló, personal communication).
Smed-piwil1 is not the only gene for which potential antisense
RNA have been detected in the present N and IR banks. For ex-ample, Smed-piwil2 shows antisense tags with levels and distribu-tions similar to the Smed-piwil1 ones (6 t.p.m. in N; 0.6 t.p.m in IR). Potential antisense RNA for the Smed-piwil3 and Smed-p53 gene have also been detected (piwil3: 9 t.p.m in N, 5 t.p.m. in IR; p53: 5 t.p.m in N, 4 t.p.m in IR). In this case, and contrary to Smed-piwil1 & 2, the 3’-most antisense tags (relative to the sense transcript) are the most abundant. Interestingly in the Smed-p53 case, anti-sense tags are more abundant than anti-sense tags, suggesting that an antisense to p53 is expressed at a higher level than the sense transcript. For Smed-bruli however, the most abundant antisense tag falls below 1.5 t.p.m. (Fig. 7 B-E). In fact, antisense tags have been detected for a large number of Smed genes.
Together, these observations provide compelling arguments in favor of the existence of antisense transcripts in the Schmidtea
mediterranea transcriptome, in particular regulated Smed-piwil1
& 2 antisense transcripts (lost after irradiation), more constitutive ones (Smed-piwil3 and p53) as well as up-regulated antisense in irradiated animals (data not shown).
Global response to irradiation
During the course of analysis of the N and IR DGE libraries, it became apparent that rank 2 tags were more frequent in IR than in N (see Supplemental Data 2). Analysis of tag ranks in both libraries revealed a clear discrepancy in tag rank distribution between the IRUP and IRDOWN classes (IRUP-3.5x, 5X or 10X and IRDOWN-3.5X, 5X or 10X). To check whether this effect could be seen in other tag classes, other subsets were analyzed: tags of the INV classes and tags with occurrences of at least 1, 10, 100, 1,000, 5,000, between 10-200, 100-1,000, in both N and IR.
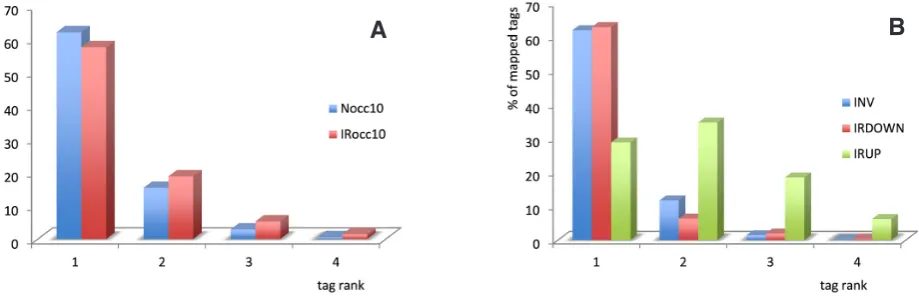
Regardless of the subset of tags analyzed in both libraries, R1 tags were the most abundant, at ~70%, with a range of 60-90% de-pending on the tag class considered, (i.e. occ≥10: ~60%, occ≥5,000: ~90%), except for IRUP. Other ranks were found in all tag subsets at ~12% R2, ~3% R3, ~0.5% R4, except for IRUP (Fig. 8A).
These estimates are relative because they largely depend on the status of the mapping set used (for example the presence of a polyA tail, proper orientation of the sequence, amount of unmapped tags), but they are a good indication of the real proportion of tag ranks.
A clear difference was observed for the IRUP tags increased in irradiated animals, i.e. tags corresponding to genes potentially induced by/after the irradiation treatment. Here R1 tags fell to ~29% of the total number of tags, with an accompanying increase of other ranks: ~34% R2, ~18% R3 and ~6% R4 (Fig. 8B). This effect was confirmed with the 454BCN whole transcriptome: ~21% R1, ~32 %R2, ~25%R3, ~12% R4 in IRUP, with a drop to as low as 17% of R1 if the IRUP-5X subset was considered (data not shown).
In contrast, the class of tags decreased in the IR library, i.e. tags corresponding to potential neoblast-specific genes, IRDOWN, showed the same pattern as the invariant tags, or the ensemble of tags in both libraries (Fig. 8B).
If we assume that observing 70% of R1 tags and 30% of lesser ranks is due to the fact that the AE enzyme has a 30% cutting error rate, i.e. a cutting probability p of 0.7, and that each AE site has the same cutting probability, then tags should follow the distribution: p for R1, p(1-p) for R2, p(1-p)2 for R3, p(1-p)3 for R4 (Gilchrist et
al., 2007), i.e. 70% R1, 21% R2, 6% R3, 1.9% R4. If we assume
a 30% AE cutting efficiency, p=0.3, the distribution of ranks should match the following: 30% R1, 21% R2, 14.7%R3, 10.3% R4.
Given that in the IR library, 4,098 mapped tags of the INV0, 8-1.2 class fit the overall distribution of tag ranks, resembling AE p=0.7 (idem for 2,104 mapped tags of INV0. 9-1.1), but that 2,556 mapped tags of the IRUP-3.5X, 5X or 10X classes did not follow this distribution, it is highly unlikely that the lowering of R1 tags in the IRUP class should be the result of incomplete digestion of the AE enzyme.
Furthermore, in experiments designed to evaluate the accuracy of the DGE method, an R1 tag category accounting for 70-80% of all tags appears to be standard across DGE experiments, implying
Fig. 8. Tag rank distribution in normal (N) and irradiated (IR) cases. Most of the tags in the N and IR libraries are mapped to R1 positions, except for the IRUP class. (A) For mapped tags sequenced at least 10 times in N (Nocc10; n=11,912) or in IR (IRocc10; n=13,007), a similar distribution is observed: R1: 57.5% and 62%, R2: 15% and 19%; R3: 3% and 5%, R4: 0.5% and 1.5%, respectively. A similar distribution is observed for tags sequenced more than 100, 1,000, 5,000 times in N or IR. The % of R1 tags increases with higher occurrence tags: for tags sequenced at least 5,000 times, 92% and 81% of tags are in R1 position in N and IR, respectively. (B) Mapped tags in the INV0.8-1.2 (n=4,098) and the IRDOWN-3.5X (n=521) classes follow a similar distribution, as in Nocc10 and IRocc10, but not tags in the IRUP-3.5X class (n=2,556): here R1 tags drop to 29%, R2 increase to 34%, R3: 18%, R4: 6%.
high reproducibility of the AE cutting efficiency (Asmann et al., 2009). When tags that have been sequenced more than a 1,000 times in either library are analyzed, particularly highly abundant tags (occ ≥5,000), the proportion of R1 in N and IR rises up to 92 and 81% suggesting that the actual cutting efficiency of the AE in the present experiments is closer to 80-90% rather than 70-75%. Furthermore, analysis of highly abundant tags suggest that it is even higher. Indeed, for the MMP13-related gene (Sme.2351) which showed the most abundant R1 tag in both libraries (Fig. 3), the proportion of R1/R2 tags is 180-fold in N and 45-fold in IR, which corresponds to a 99.5% and 98% cutting efficiency in N and IR, respectively.
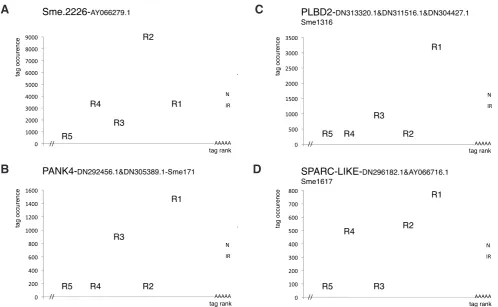
Thus, in IRUP, several RNAs for which there was a clear dis-crepancy in tag occurrence distribution have been identified which is highly unlikely to be related to the AE cutting efficiency. Genes falling into this category show for example invariant R1 tags in N and IR, and a high variant occurrence for R2 or R3 in IR, but not in N (Fig. 9). This situation can be compared with the TUBA1A example described earlier, where there is an increase of R3 instead of R1 in N versus IR, but in which case the R3 tag is also the most abundant in both N and IR (Fig. 4B).
Taken together these observations suggest that the decrease of R1 tags and the concomitant increase of lesser ranks in the IR bank observed specifically in the IRUP class of tags is due to the fact that shortened transcripts have been produced in IR as a consequence of the irradiation treatment.
Materials and Methods
Planarian culturesThe Schmidtea mediterranea asexual clonal line BCN10 was used in these experiments (Abril et al., 2010). Animals were kept at 19°C in
artificial water adapted from (Newmark and Sánchez Alvarado, 2000) and fed calf liver AB certified once a week.
Irradiation and regeneration experiments
100 animals of ~1cm were selected for further experiments: 50 animals
were irradiated in a 50ml Falcon at the Val D’Aurelle-Paul Lamarque Regional Cancer Center and received a 30 Gy X-ray total dose (6MeV X photons), at 7,4 Gy/min, 90cm from source. 50 control animals in a 50ml Falcon followed the same procedure except actual irradiation. From day 1 until day 7 after irradiation, 6 normal and 6 irradiated animals were selected: one was severed into three pieces and maintained in artificial water, the others were flash-frozen individually in liquid nitrogen. On day 7 after irradiation, the remaining animals were either cut or frozen. Cut animals were followed for over a month to assess the completion or failure of regeneration. Pictures of animals were obtained using a Leica stereomicroscope and a Nikon Coolpix 800 camera.
RNA extraction
Two total RNA pools, N7 and JIR7 were constituted. Total RNA was extracted from single animals using TRIzol (Invitrogen): 10 N and 10 IR animals from day 7 after irradiation were extracted individually. RNA quality was evaluated for each animal using an Agilent Bioanalyser. Fig. 9.Transcript size variants upregulated following irradiation. Examples of non-canonical tags increased in IR versus N that suggest the induction of shorter transcripts or variants in irradiated animals. (A) Sme2226-AY066279.1: a large transcript with similarities with a Shistosoma mansoni hypotheti-cal protein (XP_002575629.1); R2 is more abundant than R1 in IR and in N, R3 and R4 are markedly increased in IR versus N. (B) PANK4:panthotenate kinase 4, CoA biosynthesis; R1 is invariant, R3 is increased in IR, and is more abundant than R2, R4 and R5. (C) PLDB2: phospholipase B; R1 is the most abundant tag but R3 is increased versus R2, R4, R5. (D) SPARC-LIKE: matricellular protein hevin; R2, R4 but not R3 and R5 are equally abundant in IR, with a prominent increase of R2 and R4 in irradiated animals versus normal (R1 invariant, ratio N/R: 1.3). The 5’ end of transcripts is not known.
PANK4-
Sme.2226- SPARC-LIKE-
PLBD2-B
C
D
A
PANK4-
PLBD2-Since no RIN number (RNA Integrity Number) can be obtained because S. mediterranea does not possess the classical 18s and 28S rRNAs (Fig. 1C), sample quality was evaluated based on the sharpness of the single rRNA peak, and the detection of three sub-peaks which correspond to the 18S rRNA and potentially a co-migrating 25S rRNA split in two. One RNA preparation from the IR group showing degradation signs, this animal was excluded from the RNA pool. Consequently, one animal from the N group was also excluded from the N7 RNA pool. Each RNA prep was quantified using a NanoDrop ND-1000 spectrophotometer. 2mg of each
individual RNA prep was used to constitute the RNA pools N7 or JIR7, i.e.; a total of 18mg for each pool.
Reverse transcription and PCR
2.5mg each of RNA pools N7 or JIR7 were used for cDNA conversion
using an Applied High capacity cDNA Reverse Transcription kit. PCR amplification were performed using 1/10 diluted N7 or JIR7 cDNAs and the Promega GOTAQgreen mix. PCR products were analyzed on a 2% agarose gel with G210A Promega 100bp DNA ladder. Primers: Smed-EF1 5’TAT CGC ACT GTG GAA ATT CG 3’ & 5’GCT AAC AAA GCA TGC TCA CG 3’; Smed-PCNA 5’ GCA ACA TTG GAT TGC TCA GA 3’ & 5’ CTT GAA TCA GCG GCT TTC AT 3’; Smed-bruli 5’ TGT TTA CTC CTT TCG GGA ATG T 3’ & 5’ TTG TAT TCT CCC TTT GGT CGT T 3’.
DGE procedure
Two DGE libraries were obtained from intact (normal) and irradiated animals (X-rays, 30 Gy), using NlaIII as the anchoring enzyme (AE) and MmeI as the tagging enzyme (TE), thus generating, from polyA RNA, 21bp tags including the NlaIII site (CATG). Five mg of each RNA pools were
sent for tag extraction and sequencing. The Illumina, San Diego Company carried out the DGE procedure. The Skuldtech Company performed the primary tag mapping, using the NCBI Schmidtea and Dugesia taxids 55270 and 6160 against 4 ranks of tags (all ranks in 454BCN). Unmapped (unassigned/unmatched) tags are also referred to as “Not Found” or “No Match”. The CATG (NlaIII) site is generally excluded from files or figures. Tag ranks are relative to the 3’ (alleged) end of a sequence with n NlaIII sites: R1 and AS1 are the 3’-most sense (R) and antisense (AS) tags, Rn and ASn are the 5’-most tags.
Analysis
To calculate the fold-difference for tags between N and IR, the ratios were corrected according to the total number of tags present in each library.
Tag occurrences are expressed either whole per bank, as a sum in both banks, or in tags per million (t.p.m.), thus in N: occx106/5,704,565 and in
IR: occx106/4,854,783. The t.p.m. number is calculated in each library
independently unless specified. Smed genes names follow nomenclature guidelines in (Reddien et al., 2008).
Sequence analysis was carried out using the Blast2GO (Götz et al., 2008) and the Babelomics suites (Medina et al., 2010). The main programs used were blastx and tblastx at Blast2GO, ID converter and FatiGO at Babelomics, which includes KEGG and MirBase. Human refprot: gp/9606.9558/hs_refp. Human gene approved symbols (HGNC symbols-capital letters) were sought and checked against HUGO Gene Nomenclature Committee at the European Bioinformatics Institute http:// www.genenames.org/. Some of the HGNC symbols are still undergoing the validation process. The hesc hs0238 DGE library is found at SAGEGenie (http://cgap.nci.nih.gov; Hirst and Marra). The presence of polyA tails and occurrence numbers for all ranks of CATG tags was checked for individual genes/sequences.
In this study, two DGE transcriptomes of normal and irradiated planarians of the Schmidtea mediterranea species were produced to compare the polyA transcriptional landscape of animals with or without stem cells.
Although the Smed genome has been sequenced and partly an-notated (Robb et al., 2008), assembly of this AT-rich and repetitious genome has proven difficult and a planarian reference genome is still missing, which has impacts on the depth of data exploitation. However, although not exhaustive, the present analysis shows that even with incomplete genome annotation, as is the case for many non-model organisms or non-classical model organisms, valuable detailed as well as global information can be extracted from DGE experiments that would escape other means of detection.
In transcriptomics, DGE is proving highly reliable in differential gene expression analysis, and in the detection of low abundance transcripts and specific regulatory RNA species. One of the great advantages of the DGE approach is that it allows for the detection of polyadenylated transcripts of the antisense category (Quéré et
al., 2004). Furthermore, while RNA-seq is a favored method for the
listing and analyzing of full length transcripts, DGE is quite cost-effective as it was estimated that at least 10 times less sequences are required in DGE as compared to RNA-seq for suitable quantifi-cation (‘t Hoen et al., 2008; Asmann et al., 2009; Raz et al., 2011). While extremely powerful, all the current transcriptomics methods have drawbacks, as do current data mining tools. However, once produced, experimental datasets can always be reanalyzed in the light of evolving tools and as genome annotation improves. Most importantly, all the information that is extractable from these data-sets is not yet known, and there is room for method optimization. For example, it has been proposed that aiming for incomplete AE digestion in DGE should improve the accuracy of gene expression measurements. Furthermore, although non-canonical tags have been generally excluded from analysis, it is increasingly apparent that important information is lost when these tags are not accounted for. Several recent studies have shown that including all tags in the analytic process improves both the accuracy of differential gene expression measurements and the discovery of novel transcripts, in particular antisense species and mRNA variants (Gilchrist et al., 2007; Zaretzki et al., 2010; Nicolae and Mandoiu, 2011).
The existence of non-coding transcripts has been known for a long time. For example in the Drosophila bithorax homeotic gene complex, large cis-regulatory regions are transcribed (Sánchez-Herrero and Akam, 1989; Drewell et al., 2002). Although nc-RNA are more difficult to assess functionally than coding transcripts, an increasing number of studies established their functions (Rinn et
al., 2007; Yochum et al., 2007; Yu et al., 2008; Camblong et al.,
2009; Chung et al., 2011).
2009; Yassour et al., 2010; Klostermeier et al., 2011; Lasa et al., 2011), the functional importance of which is only beginning to be unravelled (Wei et al., 2011).
In the present study, evidence for the existence of a large body of antisense transcripts in the planarian genome has been uncov-ered, including potential neoblast-specific ones (e.g. antisense to
Smed-piwil1 & 2). Several lines of evidence suggest that planarian
stem cells fall into different categories in addition to the different types that can be distinguished by FACS profiles, sensitivity to X-rays, ultra structure or clonogenic potential (Hayashi et al., 2006; Higuchi et al., 2007; Wagner et al., 2011). Because antisense RNAs might be used for refined gene expression control, it is tempting to propose that the regulation of specific antisense transcripts could be a potent way to create subtle yet profound differences within pools of closely-related stem cells. Investigations into the role of these antisense transcripts may primarily require the development of specific RNAi and highly sensitive in vivo detection methods.
More than 500 Smed ESTs/mRNAs potentially expressed preferentially in the planarian neoblasts were found in the present analysis (184 without identified orthologs). The primary selection criteria were centred on the differential representation of the
Smed-piwil2 gene canonical tag that showed a ~3-fold difference between normal and irradiated animals. This list narrowed down to 260 transcripts if a ≥5-fold difference threshold between N and IR was considered. In these gene lists (IRDOWN tag classes, decreased in irradiated animals), most of the genes previously identified as being neoblast-specific and implicated in the regenerative process were detected. These findings strongly validate the N and IR da-tasets and lend solid support for the selection of neoblast-specific candidate genes for further experimental validation.
Comparative studies with other species are essential for gain-ing insights into gene function, especially since the mass of data accumulated with high-throughput technologies is tremendous and large-scale data analysis increasingly complex. One of the planarian model’s strengths is the potential knowledge transfer towards the stem cell and regenerative medicine fields. This is further supported by the peculiar gene orthology relationships between planarians and humans. Although phylogenetically more distant, planarians share with humans several genes absent in other invertebrates such as C.elegans and Drosophila (Sánchez Alvarado et al., 2002; Mineta et al., 2003).
The present work was thus focused on the IRDOWN-3.5X pla-narian genes with human orthologs (301), in a primary comparative study attempt. A list of 25 genes (8%) were found in common with the ES transcriptional modules uncovered in human stem cells (Kim
et al., 2010). Interestingly, when the human embryonic stem cell
hesc-0238 DGE transcriptome was compared to the ES modules, the number of genes found in common was not in higher propor-tion: 5% (248 genes) of the hesc preferentially expressed genes. This analysis highlighted several promising potentially conserved stem cell candidate genes, for example PRDX2, an antioxidant enzyme which has been involved in cancer cell survival (Lee et
al., 2011), PLOD3, a collagen lysyl hydroxylase over secreted by
pancreatic cancer cells (Schiarea et al., 2010), and an antisense to the actin modulating factor cofilin CFL1.
Neoblasts are not the only cells with an extraordinary behavior in planarians. From the developmental biology standpoint, fresh-water planarians are also fascinating. One striking phenomenon is the highly derived atypical gastrulation mode, termed blastomere
anarchy that planarian embryos have evolved (Cardona et al., 2005). Investigating the planarian embryonic cells in parallel to the neoblasts may concur to increase our understanding of the biological properties that enable planarians to achieve such an incredible organism-level reconstitution.
It is significant that, besides transcripts decreased in irradiated animals, a larger number of transcripts, close to 2330 (IRUP-3.5X tag class), appeared up regulated in irradiated animals (~1500 genes in IRUP-5X). Analysis of the IRUP tag class provided evidence for a global effect on transcription after X-ray treatment because a number of 3’ size variants appeared to have been produced in irradiated animals. Interestingly, genes in the IRUP class showed enrichment in several metabolic pathways (data not shown). This phenomenon could be directly triggered by genomic damage induced by X-rays or it may be the consequence of the cellular stress provoked by the irradiation treatment. Alternative splicing, alternative polyadenylation or alternative cleavage site selection mechanisms may be involved (Pauws et al., 2001; Licatalosi & Dar-nell 2010; Proudfoot, 2011). Alternative splicing and RNA shortening have been recently reported in cancer cell lines and upon cellular stress, and it has been proposed that 3’UTR variants provide a way to escape microRNA regulation (Mayr & Bartel 2009; Dutertre
et al., 2011) or influence mRNA stability (Yoon and Brem, 2010).
The observations made here are thus potentially pertinent to global changes in transcription patterns following irradiation and perhaps other types of cellular stresses. The genes affected by these changes may be involved in critical cell survival pathways, the modification of which may have profound implications for long-term cell survival and recovery from injury.
Given that transcriptomic approaches are particularly amenable to species or specimen without prior genomic information, and that these approaches are both increasingly cost-effective and highly productive in terms of data mass, it seems of crucial importance to seek the most appropriate and time-effective ways to extract the maximum information possible from these experiments, with or without an annotated genome. Coordinated efforts are necessary to find the best way to normalize experiments for cross comparisons and extend study to other species, not only for transcript discovery but especially for global analysis. This would be for example crucial for testing drugs or studying environmental effects. Furthermore, novel challenges emerge with the transcriptional information un-covered with NGS technologies, for example how to validate and functionally test very rare transcripts or nc-RNAs. Such a large task, requiring a combination of general and custom-made tools and approaches, is food for thought for the wider scientific community.
Acknowledgments
References
ABRIL, J.F., CEBRIÀ, F., RODRÍGUEZ-ESTEBAN, G., HORN, T., FRAGUAS, S., CALVO, B., BARTSCHERER, K., SALÓ, E. (2010). Smed454 dataset: unravelling the transcriptome of Schmidtea mediterranea. BMC Genomics 11: 731. ADAMIDI, C., WANG, Y., GRUEN, D., MASTROBUONI, G., YOU, X., TOLLE, D.,
DODT, M., MACKOWIAK, S.D., GOGOL-DOERING, A., OENAL, P., et al., (2011). De novo assembly and validation of planaria transcriptome by massive parallel sequencing and shotgun proteomics. Genome Res 21: 1193-1200.
ASMANN, Y.W., KLEE, E.W., THOMPSON, E.A., PEREZ, E.A., MIDDHA, S., OBERG, A.L., THERNEAU, T.M., SMITH, D.I., POLAND, G.A., WIEBEN, E.D., et al., (2009). 3’ tag digital gene expression profiling of human brain and universal reference RNA using Illumina Genome Analyzer. BMC Genomics 10:531.
BLYTHE, M.J., KAO, D., MALLA, S., ROWSELL, J., WILSON, R., EVANS, D., JOWETT, J., HALL, A., LEMAY, V., LAM, S., et al., (2010). A dual platform approach to tran-script discovery for the planarian Schmidtea mediterranea to establish RNAseq for stem cell and regeneration biology. PloS One 5:15617.
BONUCCELLI, L., ROSSI, L., LENA, A., SCARCELLI, V., RAINALDI, G., EVANGE-LISTA, M., IACOPETTI, P., GREMIGNI, V., SALVETTI, A. (2010). An RbAp48-like gene regulates adult stem cells in planarians. J Cell Sci 123: 690-698. BUENO, D., FERNÀNDEZ-RODRÍGUEZ, J., CARDONA, A.,
HERNÀNDEZ-HERNÀNDEZ, V., ROMERO, R. (2002). A novel invertebrate trophic factor related to invertebrate neurotrophins is involved in planarian body regional survival and asexual reproduction. Dev Biol 252: 188-201.
CAMBLONG, J., BEYROUTHY, N., GUFFANTI, E., SCHLAEPFER, G., STEINMETZ, L.M., STUTZ, F. (2009). Trans-acting antisense RNAs mediate transcriptional gene cosuppression in S. cerevisiae. Genes Dev. 23: 1534-1545.
CARDONA, A., HARTENSTEIN, V., ROMERO, R. (2005). The embryonic development of the triclad Schmidtea polychroa. Dev Genes Evol 215: 109-131.
CEBRIÀ, F., GUO, T., JOPEK, J., NEWMARK, P.A. (2007). Regeneration and maintenance of the planarian midline is regulated by a slit orthologue. Dev Biol 307: 394-406.
CHUNG, D.W., RUDNICKI, D.D., YU, L., MARGOLIS, R.L. (2011). A natural antisense transcript at the Huntington’s disease repeat locus regulates HTT expression.
Hum Mol Genet 20: 3467-3477.
DREWELL, R.A., BAE, E., BURR, J., LEWIS, E.B. (2002). Transcription defines the embryonic domains of cis-regulatory activity at the Drosophila bithorax complex.
Proc Natl Acad Sci USA 99: 16853-16858.
DUTERTRE, M., SANCHEZ, G., BARBIER, J., CORCOS, L., AUBOEUF, D. (2011). The emerging role of pre-messenger RNA splicing in stress responses: Sending alternative messages and silent messengers. RNA Biol 8: (Epub ahead of print). FAGOTTI, A., GABBIANI, G., PASCOLINI, R., NEUVILLE, P. (1998). Multiple isoform recovery (MIR)-PCR: a simple method for the isolation of related mRNA isoforms.
Nucleic Acids Res 26: 2031-2033.
FINOCCHIARO, G., CARRO, M.S., FRANCOIS, S., PARISE, P., DININNI, V., MULLER, H. (2007). Localizing hotspots of antisense transcription. Nucleic Acids
Res 35: 1488-1500.
GENTILE, L., CEBRIÀ, F., BARTSCHERER, K. (2011). The planarian flatworm: an
in vivo model for stem cell biology and nervous system regeneration. Dis Model Mech 4: 12-19.
GILCHRIST, M.A., QIN, H., ZARETZKI, R. (2007). Modeling SAGE tag formation and its effects on data interpretation within a Bayesian framework. BMC
Bioin-formatics 8: 403.
GÖTZ, S., GARCÍA-GÓMEZ, J.M., TEROL, J., WILLIAMS, T.D., NAGARAJ, S.H., NUEDA, M.J., ROBLES, M., TALÓN, M., DOPAZO, J., CONESA, A. (2008). High-throughput functional annotation and data mining with the Blast2GO suite.
Nucleic Acids Res 36: 3420-3435.
GURLEY, K.A., ELLIOTT, S.A., SIMAKOV, O., SCHMIDT, H.A., HOLSTEIN, T.W., SÁNCHEZ ALVARADO, A. (2010). Expression of secreted Wnt pathway com-ponents reveals unexpected complexity of the planarian amputation response.
Dev Biol 347: 24-39.
HAYASHI, T., ASAMI, M., HIGUCHI, S., SHIBATA, N., AGATA, K. (2006). Isolation of planarian X-ray-sensitive stem cells by fluorescence-activated cell sorting. Dev
Growth Differ 48: 371-380.
HE, Y., VOGELSTEIN, B., VELCULESCU, V.E., PAPADOPOULOS, N., KINZLER, K.W. (2008). The antisense transcriptomes of human cells. Science 322: 1855-1857.
HIGUCHI, S., HAYASHI, T., HORI, I., SHIBATA, N., SAKAMOTO, H., AGATA, K. (2007). Characterization and categorization of fluorescence activated cell sorted planarian stem cells by ultrastructural analysis. Dev Growth Differ 49: 571-581. ‘t HOEN, P.A.C., ARIYUREK, Y., THYGESEN, H.H., VREUGDENHIL, E., VOSSEN,
R.H.A.M., DE MENEZES, R.X., BOER, J.M., VAN OMMEN, G.B., DEN DUNNEN, J.T. (2008). Deep sequencing-based expression analysis shows major advances in robustness, resolution and inter-lab portability over five microarray platforms.
Nucleic Acids Res 36: e141.
IGLESIAS, M., GOMEZ-SKARMETA, J.L., SALÓ, E., ADELL, T. (2008). Silencing of Smed-betacatenin1 generates radial-like hypercephalized planarians.
Develop-ment 135: 1215-1221.
KAPRANOV, P., ST LAURENT, G., RAZ, T., OZSOLAK, F., REYNOLDS, C.P., SO-RENSEN, P.H.B., REAMAN, G., MILOS, P., ARCECI, R.J., THOMPSON, J.F., et
al., (2010). The majority of total nuclear-encoded non-ribosomal RNA in a human
cell is ‘dark matter’ un-annotated RNA. BMC Biol 8: 149.
KATAYAMA, S., TOMARU, Y., KASUKAWA, T., WAKI, K., NAKANISHI, M., NAKAMURA, M., NISHIDA, H., YAP, C.C., SUZUKI, M., KAWAI, J., et al., (2005). Antisense transcription in the mammalian transcriptome. Science 309: 1564-1566. KIM, J., WOO, A.J., CHU, J., SNOW, J.W., FUJIWARA, Y., KIM, C.G., CANTOR, A.B.,
ORKIN, S.H. (2010). A Myc network accounts for similarities between embryonic stem and cancer cell transcription programs. Cell 143: 313-324.
KLOSTERMEIER, U.C., BARANN, M., WITTIG, M., HASLER, R., FRANKE, A., GAVRILOVA, O., KRECK, B., SINA, C., SCHILHABEL, M.B., SCHREIBER, S. et al. (2011). A tissue-specific landscape of sense/antisense transcription in the mouse intestine. BMC Genomics 12: 305.
LASA, I., TOLEDO-ARANA, A., DOBIN, A., VILLANUEVA, M., DE LOS MOZOS, I.R., VERGARA-IRIGARAY, M., SEGURA, V., FAGEGALTIER, D., PENADES, J.R., VALLE, J. et al. (2011). Genome-wide antisense transcription drives mRNA processing in bacteria. Proc. Natl. Acad. Sci. USA 108: 20172-20177. LEE, K.W., LEE, D.J., LEE, J.Y., KANG, D.H., KWON, J., KANG, S.W. (2011).
Per-oxiredoxin II restrains DNA damage-induced death in cancer cells by positively regulating JNK-dependent DNA repair. J Biol Chem 286: 8394-8404.
LICATALOSI, D.D. DARNELL, R.B. (2010). RNA processing and its regulation: global insights into biological networks. Nat Rev Genet 11: 75-87.
LUO, Q.J., SAMANTA, M.P., KOKSAL, F., JANDA, J., GALBRAITH, D.W., RICHARD-SON, C.R., OU-YANG, F., ROCK, C.D. (2009). Evidence for antisense transcription associated with microRNA target mRNAs in Arabidopsis. PLoS Genet 5: e1000457. MAEKAWA, M., YAMAGUCHI, K., NAKAMURA, T., SHIBUKAWA, R., KODANAKA, I., ICHISAKA, T., KAWAMURA, Y., MOCHIZUKI, H., GOSHIMA, N., YAMANAKA, S. (2011). Direct reprogramming of somatic cells is promoted by maternal transcrip-tion factor Glis1. Nature 474: 225-229.
MAYR, C. BARTEL, D.P. (2009). Widespread shortening of 3’UTRs by alternative cleav-age and polyadenylation activates oncogenes in cancer cells. Cell 138: 673-684. MEDINA, I., CARBONELL, J., PULIDO, L., MADEIRA, S.C., GOETZ, S., CONESA,
A., TÁRRAGA, J., PASCUAL-MONTANO, A., NOGALES-CADENAS, R., SAN-TOYO, J., et al., (2010). Babelomics: an integrative platform for the analysis of transcriptomics, proteomics and genomic data with advanced functional profiling.
Nucleic Acids Res 38: W210-213.
METZKER, M.L. (2010). Sequencing technologies - the next generation. Nat Rev
Genet 11: 31-46.
MINETA, K., NAKAZAWA, M., CEBRIA, F., IKEO, K., AGATA, K., GOJOBORI, T. (2003). Origin and evolutionary process of the CNS elucidated by comparative genomics analysis of planarian ESTs. Proc Natl Acad Sci USA 100: 7666-7671. NEWMARK, P.A. SÁNCHEZ ALVARADO, A. (2000). Bromodeoxyuridine specifically
labels the regenerative stem cells of planarians. Dev Biol 220: 142-153. NICOLAE, M. MANDOIU, I. (2011). Accurate estimation of gene expression levels
from DGE sequencing data. Proc. 7th International Symposium on Bioinformatics
Research and Applications. 392-403. http://www.cs.gsu.edu/isbra11.
OVIEDO, N.J. BEANE, W.S. (2009). Regeneration: The origin of cancer or a possible cure?Semin Cell Dev Biol 20: 557-564.
PAUWS, E., VAN KAMPEN, A.H., VAN DE GRAAF, S.A., DE VIJLDER, J.J., RIS-STALPERS, C. (2001). Heterogeneity in polyadenylation cleavage sites in mammalian mRNA sequences: implications for SAGE analysis. Nucleic Acids
Res 29:1690-1694.