ABSTRACT
ZHANG, JI. Biodiesel and Diesel Combustion in a Constant Volume Chamber. (Under the direction of Dr. Tiegang Fang).
The combustion of renewable fuels in diesel engines has shown promise to reduce
soot emission significantly. However, biodiesel combustion is often accompanied by the
increased level of nitrogen oxides emission. The spray combustion characteristics and
pollutant formation mechanism have yet to be well understood. This dissertation advances
the knowledge that is important to utilize biofuel with higher combustion efficiency and
environmental benefits.
In this study, a constant volume combustion chamber was successfully established
with validated safety and consistency to simulate the high pressure and high temperature
environment in diesel engines. It provides optical accessibility and the ability to control the
ambient temperature and ambient oxygen concentration. By integrating a common rail fuel
system, it allows for the study of spray combustion with optical diagnostic techniques.
In this constant volume combustion chamber, low temperature diesel combustion was
investigated first. Imaging of CH* and OH* showed that a high temperature reaction region
existed in the middle- and down-stream of the jet, but not in the near-wall region, because of
the quenching effect. The CH* was found to be effective to identify the low temperature
ignition regions, but could not be used to identify the flame area where soot incandescence
dominated.
Simultaneous imaging of the natural luminosity (NL) and OH* chemiluminescence
was then applied to biodiesel and diesel fuels over a wide range of conditions. The results
indicated a similar ignition delay for biodiesel and diesel under high temperature and high
oxygen concentrations, but biodiesel showed a shorter ignition delay under low temperature
and low oxygen concentration conditions. This was primarily resulted from the poorer
The OH radical was not only involved in the high temperature reaction, as illustrated
by the simultaneous appearance in the up and middle stream of the jet, but was also involved
in the soot oxidation process. Biodiesel showed the tendency to reduce soot formation as well
as to increase soot oxidation, which was believed due to the effect of oxygen component in
the molecule.
The two-color measurement was successfully implemented using a high speed CCD
camera coupled with narrow-band filters. With correct calibration, quantitative results of
temperature and soot concentration (KL factor) were obtained. The uncertainty analysis
showed good confidence in the temperature result, while the uncertainty of KL factor was
relatively large.
From the simultaneous imaging of NL and OH* and the two color measurement, the
effects of the ambient temperature and ambient oxygen concentration were systematically
studied. Their impact on the combustion characteristics, flame structure, NL and OH*
contour map, SINL and OH* intensity, two-color temperature and KL factor were discussed
in detail.
Finally the extra high temperature with low oxygen concentration combustion mode
was investigated. The results showed the possibility to maintain a low soot level but enhance
combustion efficiency compared to the low temperature combustion.
In summary, the spray combustion of biodiesel and diesel in the constant volume
combustion chamber was studied in this dissertation. The results provided us with invaluable
insights into the fundaments of the involved physical and chemical processes. The
combustion characteristics of different fuels under varied conditions can serve as a reference
for the development of new generation engines with fuel flexibility, low emissions, and high
© Copyright 2011 by Ji Zhang
Biodiesel and Diesel Spray Combustion in a Constant Volume Chamber
by Ji Zhang
A dissertation submitted to the Graduate Faculty of North Carolina State University
in partial fulfillment of the requirements for the degree of
Doctor of Philosophy
Mechanical Engineering
Raleigh, North Carolina
2011
APPROVED BY:
_______________________________ ______________________________ Dr. Tiegang Fang Dr. William Roberts
Committee Chair
DEDICATION To my wife, Mingzhu Hu
and my parents, Yuguo Zhang and Yongjie Chen
BIOGRAPHY
Ji Zhang was born in Jianshi, Hubei, China, a mountain town in the central area of
China. His mother was a family doctor and his father was a manager in a local company. His
parents brought him up with their pure love and proud. He did not only inherit the genes from
them, but shared the great personality and life value of his parents, which shaped him as a
man.
In 1999, he graduated from Enshi High School, where he was lucky to be under the
guidance of Mr. Gang Huang, who made a good example to cope with difficulties. In 2003,
he received his bachelor degree from Huazhong University of Science & Technology in
Wuhan, China. In 2006, Ji earned his Master degree from Zhejiang University in Hangzhou,
China. He conducted the experimental research in the formation and inhibition mechanism of
dioxins, a category of persistent organic pollutants from waste incineration.
In 2007 at STATE, Ji started his PhD research in engine combustion under the
advisory of Dr. Tiegang Fang. He built up a constant volume chamber experimental system
from scratch in three years with the guidance of his advisor. He then investigated the spray
combustion of diesel and biofuels in this experimental system. If the research was the night
sky, the constant frustration, disappointment, doubts were like the endless blackness, while
the moments of successfully solving problems and uncovering a correlation between
parameters were like the shining stars, which made the night sky beautiful and charming.
He firstly met his wife, Mingzhu, in a student leaders' meeting in his first week to
begin the undergraduate study. They kept a good friendship since then, and two years later, it
turned out to be a serious relationship. In 2007, after eight years of knowing each other and
six years of relationship, they were married right before he came to Raleigh. Meeting his
wife was THE most significant event in his college life.
After graduation, he will assume a research and development job in industry and
ACKNOWLEDGMENTS
First of all, I would like to express my sincere gratitude to my advisor Dr. Tiegang
Fang, who introduced me into the engine combustion area. Dr. Fang not only shared with me
his extensive knowledge of combustion and spray, but, more importantly, set an excellent
example to be a good researcher. His continuous support is the essential driving force for me
to complete the research and his encouragement is especially invaluable at my difficult
research times.
I would also like to thank my committee faculty: Dr. William Roberts, Dr. Tarek
Echekki and Dr. Kevin Lyons. Dr Roberts kindly shared his lab space and experimental
equipments. He also shared many thoughts about my research work, which helped me clarify
confusion in the research. Dr. Echekki introduced me the beauty of turbulence in his class,
which greatly enriched my understanding in this interesting area. Dr. Lyons taught me the
laser diagnostics and quantum mechanics, which was helpful in facilitating the experiments
in my research. The effort from all committee members is indispensable for my research and
is greatly appreciated.
Dr. Alexei Saveliev is also greatly appreciated for numerous help in the experimental
equipment sharing and research suggestions.
I am grateful to Mr. Skip Richardson and Mr. Rick Lamy who offered tremendous
labor time on the chamber system and different parts. This research cannot be finished
without their help. I wish them best in future.
I am lucky to be in a lab filled with great people. Wei Jing, to whom I owe my special
thanks, helped me a lot in the last few months of experiments. I wish him best in his research
in the spray combustion. Shanshan Yao, Pin-jia Chen, Dolanimi Ogunkoya, Ranjith Kumar A
K and Vilas V Jangale are fabulous people and I enjoyed the time with you all.
Last but not least, I would express my sincere appreciation to my parents. Their
encouragement leads me to an elite life and work style. I feel indebted to them since I did not
have much time together with them when I have pursued my goals in places far away from
home. I will make the family union more often in future time. In the meantime, I am
especially indebted to my wife, Mingzhu Hu, who always stands by me and supports me
through our most difficult times. I really appreciate her understanding when I decided to
study abroad. She is a great woman, traditional and open-minded, reasonable and emotional,
TABLE OF CONTENTS
LIST OF TABLES ... ix
LIST OF FIGURES ... x
1. Introduction ... 1
1.1. Motivation ... 1
1.2. Research objective and approaches ... 2
2. Literature review... 4
2.1. Diesel spray combustion ... 4
2.1.1. Lift-off length... 4
2.1.2. Fuel air entrainment ... 4
2.1.3. Jet velocity ... 5
2.1.4. Ignition delay ... 5
2.1.5. Soot volume fraction ... 6
2.2. Effect of oxygen on soot and NOx ... 6
2.2.1. Soot ... 6
2.2.2. Nitrogen oxides ... 7
2.2.3. A short summary ... 8
2.3. Biodiesel combustion ... 9
2.3.1. Biodiesel property ... 9
2.3.2. Engine performance ... 9
2.3.3. Emission ... 12
2.3.4. A short summary ... 17
2.4. Two color pyrometry ... 18
2.4.1. Principles... 18
2.4.2. Implementation ... 23
2.4.3. Uncertainty analysis ... 24
2.5. Summary ... 26
2.6. Tables and figures ... 27
3. Experimental setup ... 30
3.1. Experimental system design ... 30
3.1.2. Peak temperature and pressure... 31
3.1.3. Safety consideration ... 32
3.1.4. Quartz window stress analysis ... 32
3.1.5. Gas supply system... 33
3.1.6. Ignition system ... 34
3.1.7. Fuel delivery system ... 35
3.2. Data acquisition and control system... 36
3.2.1. Hardware and software configuration ... 36
3.2.2. Pressure measurement ... 36
3.2.3. Protection circuit ... 37
3.3. Optical diagnostic system... 38
3.4. Tables and figures ... 40
4. Experimental study on low temperature diesel combustion ... 47
4.1. Introduction ... 47
4.2. Measurements and diagnostics ... 49
4.3. Results and discussion ... 50
4.3.1. Heat release analysis ... 50
4.3.2. Flame Structure and OH* chemiluminescence ... 52
4.3.3. Intensity of OH* chemiluminescence and Natural luminosity ... 58
4.4. Comments and summary ... 59
4.5. Tables and figures ... 61
5. Experimental study on biodiesel combustion under different conditions ... 76
5.1. Introduction ... 76
5.2. Experimental setup and diagnostics ... 77
5.2.1. Experimental setup... 77
5.2.2. Image process... 78
5.3. Time averaged imaging of OH* ... 79
5.3.1. OH* images ... 79
5.3.2. Air/fuel mixing analysis ... 81
5.4. High speed simultaneous imaging of NL and OH* ... 82
5.4.1. Effect of ambient temperature at 21% O2 ... 82
5.5. Comments and summary ... 94
5.6. Tables and figures ... 96
6. Two-color measurement of diesel and biodiesel spray combustion ... 119
6.1. Introduction ... 119
6.2. Two-color measurement ... 119
6.2.1. Camera response calibration ... 119
6.2.2. Image match calibration ... 120
6.2.3. Computation time... 121
6.3. Sensitivity and uncertainty analysis ... 121
6.4. Two-color temperature and KL factor results ... 123
6.4.1. Baseline for diesel and biodiesel ... 123
6.4.2. Effect of ambient temperature at 21% O2 concentration ... 127
6.4.3. Effect of ambient temperature at reduced O2 concentrations ... 132
6.4.4. Effect of ambient oxygen concentration ... 133
6.4.5. Extra high temperature combustion ... 138
6.5. Comments and summary ... 140
6.6. Tables and Figures ... 143
7. Conclusion ... 176
7.1. Conclusion ... 176
7.2. Future work ... 179
LIST OF TABLES
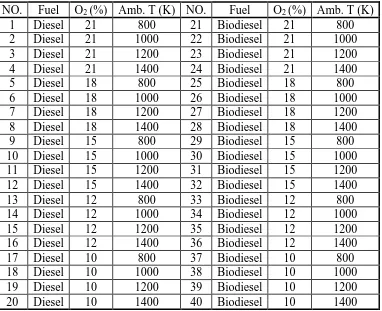
Table 2.1 Property of biodiesel prepared from vegetable oils [15] ... 27
Table 2.2 Factors investigated in affecting PM emission with biodiesel [16] ... 27
Table 3.1 Maximum allowable stress at different positions on chamber ... 40
Table 4.1 Specification of fuel injection system and conditions ... 61
Table 4.2 Summary of the experimental conditions ... 61
Table 5.1 Experimental parameters used for the averaged OH* imaging experiment ... 96
Table 5.2 Summary of the experimental conditions for the averaged OH* imaging experiment... 96
Table 5.3 Experimental parameters used for the simultaneous imaging of OH* and NL experiment... 97
Table 5.4 Summary of the experimental conditions for the simultaneous imaging of OH* and NL experiment ... 97
Table 6.1 The coefficients of different aperture ... 143
LIST OF FIGURES
Figure 2.1 Statistical trend of bsfc in function of biodiesel content in blend (heavy duty
engines without any EGR and aftertreatment system) [11]. ... 28
Figure 2.2 Comparison of Otto cycle, Dual cycle and Diesel cycle within the same compression ratio ... 28
Figure 2.3 Effect of biodiesel on the emission of heavy duty engine without EGR and after-treatment system, up to 2001 [11]... 29
Figure 3.1 Constant volume chamber. 1. Combustion chamber; 2. Fuel injector; 3. Pressure transducer; 4. Metal plug; 5. Spark plug; 6. Intake/Exhaust lines; 7. Chamber body; 8. Quartz window; 9. Plug/Window retainer. ... 41
Figure 3.2 Photo of constant volume chamber, gas supply system, fuel delivery system. ... 41
Figure 3.3 Mesh of quartz window ... 42
Figure 3.4 Stress distribution of quartz window under maximum pressure ... 42
Figure 3.5 Gas supply system: V-1 ~ V-4, V-10 ~ V-11: Low pressure solenoid valve (200 psi); V-5, V8 ~ V-9: High pressure solenoid valve (1000 psi); V-6, V-7: Ball valve (6000 psi); V-12, V-13: Relief valve; V-14: Check valve; I-1: Pressure transducer; I-2: Temperature transducer. ... 43
Figure 3.6 Premixing gas pressure adjustment software interface ... 43
Figure 3.7 Fuel system: E-1: Chamber; E-2: Fuel tank; E-3: Low pressure pump; E-4: Fuel filter; 5: High pressure pump; 6: Motor; 7: Common rail; 8: Injector; E-9: Spark plug ... 44
Figure 3.8 Common rail pressure control software interface ... 44
Figure 3.9 Main control software interface ... 45
Figure 3.10 An example of pressure curves of no fuel injection and fuel injection cases. ... 46
Figure 4.2 Apparent heat release rate (AHRR) and pressure change of diesel combustion. Ambient temperature: 1200 K ... 62
Figure 4.3 Apparent heat release rate (AHRR) and pressure change of diesel combustion. Ambient temperature: 1000 K ... 63
Figure 4.4 Apparent heat release rate (AHRR) and pressure change of diesel combustion. Ambient temperature: 800 K ... 63
Figure 4.5 Cumulative heat release of diesel spray combustion. Ambient temperature: 800, 1000 and 1200 K. Ambient O2 concentration: 15% and 10%. ... 64
Figure 4.6 Natural Luminosity and OH* chemiluminescence images of diesel combustioin at ambient temperature of 1200 K and 21% O2 concentration ... 65
Figure 4.7 Natural Luminosity and OH* chemiluminescence images of diesel combustioin at ambient temperature of 1200 K and 15% O2 concentration ... 66
Figure 4.8 Natural Luminosity and OH* chemiluminescence images of diesel combustioin at ambient temperature of 1200 K and 10% O2 concentration ... 67
Figure 4.9 Natural Luminosity (left), OH* chemiluminescence (middle) and CH* chemiluminescence (right) images of diesel combustioin at ambient temperature of 1000 K and 21% O2 concentration ... 68
Figure 4.10 Natural Luminosity (left), OH* chemiluminescence (middle) and CH* chemiluminescence (right) images of diesel combustioin at ambient temperature of 1000 K and 15% O2 concentration ... 69
Figure 4.11 Natural Luminosity (left), OH* chemiluminescence (middle) and CH* chemiluminescence (right) images of diesel combustioin at ambient temperature of 1000 K and 10% O2 concentration ... 70
Figure 4.12 Natural Luminosity (left), OH* chemiluminescence (middle) and CH* chemiluminescence (right) images of diesel combustioin at ambient temperature of 800 K and 21% O2 concentration ... 71
Figure 4.13 Natural Luminosity (left), OH* chemiluminescence (middle) and CH* chemiluminescence (right) images of diesel combustioin at ambient temperature of 800 K and 15% O2 concentration ... 72
Figure 4.15 The intensity of OH* chemiluminescence of the diesel spray combustion under
different conditions. ... 74
Figure 4.16 The intensity of natural luminosity (NL) of the diesel spray combustion under different conditions. ... 74
Figure 4.17 Intensity of CH* chemiluminescence of diesel spray combustion. Ambient temperature: 1000 K and 800 K; ambient O2: 21%, 15% and 10%. ... 75
Figure 4.18 Ignition area of diesel spray combustion. Ambient temperature: 1000 K and 800 K; ambient O2: 21%, 15% and 10%. ... 75
Figure 5.1 The experimental setup for the time averaged OH* imaging... 98
Figure 5.2 Imaging process for the lift-off length calculation ... 98
Figure 5.3 An example to process image for the OH* intensity contour. ... 99
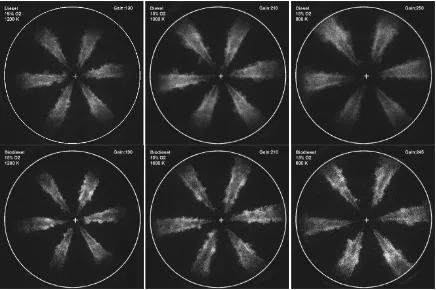
Figure 5.4 OH-chemiluminescence images of diesel and biodiesel at 21% O2 concentration. Temperature: 800K, 1000K, 1200K. Gain value for each test is labeled at right top corner. Time after start of injection (ASOI) when the imaging starts: diesel, 1200K: 0.7 ms; diesel, 1000K: 0.8 ms; diesel, 800K: 0.7 ms; biodiesel, 1200K: 0.8 ms; biodiesel, 1000K: 0.8 ms; biodiesel, 800K: 0.8 ms. ... 100
Figure 5.5 OH-chemiluminescence images of diesel and biodiesel at 15% O2 concentration. Temperature: 800K, 1000K, 1200K. Gain value for each test is labeled at right top corner. Time after start of injection (ASOI) when the imaging starts: diesel, 1200K: 0.7 ms; diesel, 1000K: 0.8 ms; diesel, 800K: 0.7 ms; biodiesel, 1200K: 0.8 ms; biodiesel, 1000K: 0.8 ms; biodiesel, 800K: 0.8 ms. ... 101
Figure 5.6 OH-chemiluminescence images of diesel and biodiesel at 9% O2 concentration. Temperature: 800K, 1000K, 1200K. Gain value for each test is labeled at right top corner. Time after start of injection (ASOI) when the imaging starts: diesel, 1200K: 0.75 ms; diesel, 1000K: 0.8 ms; diesel, 800K: 0.9 ms; biodiesel, 1200K: 0.8 ms; biodiesel 1000K: 0.85ms; biodiesel, 800K: 0.9 ms. ... 102
Figure 5.7 Lift-off length for diesel and biodiesel. Error bar stands for the standard deviation of the lift-off lengths measured for different jets. ... 103
Figure 5.8 Cross section averaged oxygen equivalence ratio of diesel and biodiesel under different oxygen concentrations. ... 103
Figure 5.10 The distribution of oxygen equivalence ratio difference between diesel and biodiesel at the ambient oxygen concentration of 15% (a) and 9% (b). ... 105
Figure 5.11 Effect of ambient temperature on apparent heat release rate (AHRR) of diesel. Ambient O2: 21%. ... 106
Figure 5.12 Effect of ambient temperature on apparent heat release rate (AHRR) of biodiesel. Ambient O2: 21%. ... 106
Figure 5.13 Effect of ambient temperature on pressure increase of diesel and biodiesel. Ambient O2: 21%. ... 107
Figure 5.14 NL images of biodiesel and diesel at different ambient temperatures in the initial stage. Ambient O2 concentration: 21%. ... 108
Figure 5.15 OH* images of biodiesel and diesel at different ambient temperatures in the initial stage. Ambient O2 concentration: 21%. ... 108
Figure 5.16 NL images of biodiesel and diesel at different ambient temperatures in the quasi-steady stage. Ambient O2 concentration: 21%. ... 108
Figure 5.17 OH* images of biodiesel and diesel at different ambient temperatures in the quasi-steady stage. Ambient O2 concentration: 21%. ... 109
Figure 5.18 NL images of biodiesel and diesel at different ambient temperatures in the ending stage. Ambient O2 concentration: 21%. ... 109
Figure 5.19 OH* images of biodiesel and diesel at different ambient temperatures in the ending stage. Ambient O2 concentration: 21%. ... 109
Figure 5.20 Natural luminosity temporal and spatial resolution of diesel and biodiesel combustion at the oxygen concentration of 21%. ... 110
Figure 5.21 OH* chemiluminescence temporal and spatial resolution of diesel and biodiesel combustion at the oxygen concentration of 21%. ... 111
Figure 5.22 Effect of ambient temperature spatially integrated natural luminosity (SINL) of diesel and biodiesel at the oxygen concentration of 21%. ... 112
Figure 5.23 Effect of ambient temperature concentration on OH* chemiluminescence intensity of diesel and biodiesel at the oxygen concentration of 21%. ... 112
Figure 5.25 Effect of ambient oxygen concentration on apparent heat release rate (AHRR) of biodiesel. Ambient temperature: 1000 K. ... 113
Figure 5.26 Effect of ambient oxygen concentration on pressure increase of diesel. Ambient temperature: 1000 K. ... 114
Figure 5.27 Effect of ambient oxygen concentration on pressure increase of diesel. Ambient temperature: 1000 K. ... 114
Figure 5.28 Natural luminosity temporal and spatial resolution of diesel and biodiesel combustion at the ambient temperature of 1000 K. ... 115
Figure 5.29 OH* chemiluminescence temporal and spatial resolution of diesel and biodiesel combustion at the ambient temperature of 1000 K. ... 116
Figure 5.30 Effect of ambient oxygen concentration on spatially integrated natural luminosity (SINL) of diesel at the ambient temperature of 1000 K. ... 117
Figure 5.31 Effect of ambient oxygen concentration on spatially integrated natural luminosity (SINL) of biodiesel at the ambient temperature of 1000 K. ... 117
Figure 5.32 Effect of ambient oxygen concentration on OH* chemiluminescence intensity of diesel at the ambient temperature of 1000 K. ... 118
Figure 5.33 Effect of ambient oxygen concentration on OH* chemiluminescence intensity of biodiesel at the ambient temperature of 1000 K. ... 118
Figure 6.1 The spectral blackbody radiance at different temperatures. 550 nm: green line; 650 nm: red line. ... 144
Figure 6.2 Blackbody radiator ... 144
Figure 6.3 Camera received signal in function of camera exposure time. Camera aperture: F/8; blackbody temperature: 1300K. ... 145
Figure 6.4 Camera received signal in function of camera aperture. Camera exposure time: ; blackbody temperature: 1323 K. ... 145
Figure 6.5 Camera effective signals in function of radiance of a tungsten halogen light source coupled with different neutral density filters. Blackbody temperature: 1100 K to 1300K; Aperture: 5.6 to 16; Exposure time varies. ... 146
Figure 6.6 An example raw image capture by the stereoscope coupled camera. ... 147
Figure 6.8 Calculated 2C temperature (left) and KL factor (right). Fuel: diesel; ambient oxygen concentration: 21%; ambient temperature: 1000 K. Labeled values of temperature and KL are the averaged value over the flame area. ... 147
Figure 6.9 Gray body radiance at 550 nm and 650 nm at different temperatures and KL factors. ... 148
Figure 6.10 2C temperatures of Figure 6.8 using the 95% confidence interval of the regression coefficients. ... 149
Figure 6.11 2C KL factors of Figure 6.8 using the 95% confidence interval of the regression coefficients. ... 149
Figure 6.12 2C temperature of diesel combustion in Case 2 at the condition of 21% O2 and 1000 K. The time after start of injection signal is labeled in the up-left corner. 150
Figure 6.13 2C temperature of biodiesel combustion in Case 16 at the condition of 21% O2 and 1000 K. The time after start of injection signal is labeled in the up-left corner. ... 150
Figure 6.14 KL factor of diesel combustion in Case 2 at the condition of 21% O2 and 1000 K. The time after start of injection signal is labeled in the up-left corner. ... 151
Figure 6.15 KL factor of biodiesel combustion in Case 16 at the condition of 21% O2 and 1000 K. The time after start of injection signal is labeled in the up-left corner. 151
Figure 6.16 Flame area of diesel and biodiesel combustion in Case 2 and 16. ... 152
Figure 6.17 2C temperature of diesel and biodiesel in function of time (Case 2 and 16). Error bar represents the standard deviation of different runs. ... 152
Figure 6.18 KL factor of diesel and biodiesel in function of time (Case 2 and 16). Error bar represents the standard deviation of different runs. ... 153
Figure 6.19 Total soot of diesel and biodiesel in function of time (Case 2 and 16). Error bar represents the standard deviation of different runs. ... 153
Figure 6.20 2C temperature of diesel and biodiesel combustion in Case 1, 2, 3, 15, 16, 17 at the time of 1.110 ms... 154
Figure 6.21 KL factor of diesel and biodiesel combustion in Case 1, 2, 3, 15, 16, 17 at the time of 1.110 ms. ... 154
Figure 6.23 KL factor of diesel and biodiesel combustion in Case 1, 2, 3, 15, 16, 17 at the time of 1.998 ms. ... 155
Figure 6.24 2C temperature of diesel and biodiesel combustion in Case 1, 2, 3, 15, 16, 17 at the time of 3.330 ms... 156
Figure 6.25 KL factor of diesel and biodiesel combustion in Case 1, 2, 3, 15, 16, 17 at the time of 3.330 ms. ... 156
Figure 6.26 2C temperature of diesel and biodiesel combustion in Case 1, 2, 3, 15, 16, 17 in function of time. ... 157
Figure 6.27 KL factor of diesel and biodiesel combustion in Case 1, 2, 3, 15, 16, 17 in function of time. ... 157
Figure 6.28 Total soot of diesel and biodiesel combustion in Case 1, 2, 3, 15, 16, 17 in function of time. ... 158
Figure 6.29 2C temperature of diesel and biodiesel combustion in Case 6, 7, 8, 20, 21, 22 in function of time. ... 158
Figure 6.30 Total soot of diesel and biodiesel combustion in Case 6, 7, 8, 20, 21, 22 in function of time. ... 159
Figure 6.31 2C temperature of diesel and biodiesel combustion in Case 11, 12, 13, 25, 26, 27 in function of time. ... 159
Figure 6.32 Total soot of diesel and biodiesel combustion in Case 11, 12, 13, 25, 26, 27 in function of time. ... 160
Figure 6.33 2C temperature of diesel combustion in Case 2, 5, 7, 10, 12 at the time of 1.110 ms. ... 161
Figure 6.34 KL factor of diesel combustion in Case 2, 5, 7, 10, 12 at the time of 1.110 ms. ... 161
Figure 6.35 2C temperature of biodiesel combustion in Case 16, 19, 21, 24, 26 at the time of 1.110 ms. ... 162
Figure 6.36 2C temperature of biodiesel combustion in Case 16, 19, 21, 24, 26 at the time of 1.110 ms. ... 162
Figure 6.38 KL factor of diesel combustion in Case 2, 5, 7, 10, 12 at the time of 1.998 ms.
... 163
Figure 6.39 2C temperature of biodiesel combustion in Case 16, 19, 21, 24, 26 at the time of 1.998 ms. ... 164
Figure 6.40 KL factor of biodiesel combustion in Case 16, 19, 21, 24, 26 at the time of 1.998 ms. ... 164
Figure 6.41 2C temperature of diesel combustion in Case 2, 5, 7, 10, 12 at the time of 3.330 ms. ... 165
Figure 6.42 KL factor of diesel combustion in Case 2, 5, 7, 10, 12 at the time of 3.330 ms. ... 165
Figure 6.43 2C temperature of biodiesel combustion in Case 16, 19, 21, 24, 26 at the time of 3.330 ms. ... 166
Figure 6.44 KL factor of biodiesel combustion in Case 16, 19, 21, 24, 26 at the time of 3.330 ms. ... 166
Figure 6.45 2C temperature of diesel combustion in function of time in Case 2, 5, 7, 10, 12 ... 167
Figure 6.46 2C temperature of biodiesel combustion in function of time in Case 16, 19, 21, 24, 26... 167
Figure 6.47 Pixel averaged KL factor of diesel combustion in function of time in Case 2, 5, 7, 10, 12... 168
Figure 6.48 Pixel averaged KL factor of biodiesel combustion in function of time in Case 16, 19, 21, 24, 26... 168
Figure 6.49 Total soot of diesel combustion in function of time in Case 2, 5, 7, 10, 12 ... 169
Figure 6.50 Total soot of biodiesel combustion in function of time in Case 16, 19, 21, 24, 26. ... 169
Figure 6.51 2C temperature of diesel combustion in Cases 9, 14... 170
Figure 6.52 KL factor temperature of diesel combustion in Cases 9, 14... 170
Figure 6.53 2C temperature of biodiesel combustion in Cases 23, 28. ... 171
Figure 6.55 2C temperature of diesel combustion in function of time in Cases 6, 9, 11, 14.172
Figure 6.56 KL factor of diesel combustion in function of time in Cases 6, 9, 11, 14. ... 172
Figure 6.57 2C temperature of diesel combustion in function of time in Cases 6, 9, 11, 14.173
Figure 6.58 2C temperature of biodiesel combustion in function of time in Cases 20, 23, 25, 28... 173
Figure 6.59 KL factor of biodiesel combustion in function of time in Cases 20, 23, 25, 28.. ... 174
Figure 6.60 Total soot of biodiesel combustion in function of time in Cases 20, 23, 25, 28. ... 174
1.
INTRODUCTION
1.1.
Motivation
As one of the alternative energy sources, biodiesel is considered as a feasible
candidate to substitute petroleum diesel fuel for its advantages in power delivery, regulated
emissions and closed carbon cycle. Since the engine performance is the priority concern for
both auto industry and end customers, this dissertation firstly reviews the effect of biodiesel
in brake effective power, brake specific fuel consumption, thermal efficiency. Moreover, the
engine emissions for biodiesel and diesel, including nitric oxides (NOx), particular matters
(PM), carbon monoxide (CO) and unburned hydrocarbons (UHC), are compared with
emphasis on the mechanisms. NOx slightly increases for many researches, but can be
improved with new injection strategies or improvement of biodiesel fuel properties. PM is
greatly reduced in overall mass concentration, while number concentration is yet to be
determined. CO and UHC are greatly reduced in most cases.
The shortage of petroleum fuel and the serious environment problems now present the
world the challenges to search alternative renewable fuels. Two critical factors are
considered during the exploration of new fuel: firstly, renewable and sustainable sources;
secondly, low emission of pollutant and no increase of green house gas.
For diesel engines, biodiesel stands out as a promising candidate to substitute diesel
for the advantages in following aspects: the feasibility of fuel production, transportation and
storage technology, the availability of the fuel source, the compatibility of the fuel to current
engine hardware, the performance of engine using new fuel, and, the most important, the
emission of engines.
However, the diesel spray combustion is rather complicated because it involves
multiple phase transition, fuel atomization and evaporation, auto-ignition, partial premixed
combustion and diffusion combustion. The intensive interaction between fluid and chemistry
usually a few milliseconds. The experimental study on the diesel spray combustion often
requires the accurate control of the experimental conditions and the state-of-the-art
diagnostic methods. It is of great interest to gain a more thorough understanding on the
diesel spray combustion, especially with the utilization of biofuels.
1.2.
Research objective and approaches
This study is primarily focused on the experimental study on the diesel and biodiesel
spray combustion. The document will be organized as follows:
Chapter 2 reviews the basic physical process of diesel spray combustion and the
current understanding of controlling parameters on the combustion characteristics. Biodiesel
combustion and its effect on the engine performance and emission are discussed. The
two-color method for soot concentration and soot temperature is introduced. The principles,
implementation and uncertainty of this method are presented.
Chapter 3 describes the setup of the constant volume chamber experiment system.
The chamber design is introduced with a discussion on the safety concern and the
corresponding measures. The gas feeding system and fuel delivery system are described as
well. It also discusses the protection mechanisms specially developed for the safe and
continuous operation of the chamber system. The optical diagnostic methods are briefly
presented.
Chapter 4 studies the low temperature diesel combustion. The heat release
characteristics are analyzed. The flame structure is investigated by studying the images of
natural luminosity, CH* and OH* chemiluminescence. The intensity of different signals is
compared as well.
Chapter 5 employs the same approach as Chapter 4 and applies it to biodiesel
combustion. A wide operation range is investigated to understand the effect of the ambient
temperature and ambient oxygen concentration on the spray combustion process. The
emphasis is to compare the different characteristics of biodiesel combustion. The spatial and
Chapter 6 firstly develops a two-color measurement for soot temperature and
concentration and demonstrates the validity. The method is then applied to diesel and
biodiesel combustion over interesting operation conditions. The temporal and spatial maps of
the two-color temperature and KL factor are discussed with respect to the fuel effect and
operational condition effect.
Chapter 7 summarizes the experimental studies and combines the understanding from
different diagnostics to gain an insight into the spray combustion. Major conclusions are
2.
LITERATURE REVIEW
2.1.
Diesel spray combustion
The most important parameters used to describe the spray combustion include: lift-off
length, equivalence ratio, jet velocity, ignition delay, soot volume fraction, OH and CH
distribution, among other parameters. Due to the complexity and high turbulence of the spray
combustion, most models are empirical.
2.1.1. Lift-off length
In a constant volume chamber, the lift-off length is determined via the following
equation [1]:
(2.1)
where is the measured lift-off length for an ambient gas temperature and density
during the image acquisition period of and determined by Equations (2-2, 2-3); and
are the selected ambient density and temperature, at which the fuel is injected.
(
)
(2.2)
(
) (2.3)
In Equation (2.3), , and are temperature, density and pressure of the
ambient gas at the time of the start of fuel injection. , and are the average temperature,
density and pressure of the ambient gas during the image acquisition period. In a constant
volume chamber, can be obtained from pressure transducer, and is then determined.
is the ratio of specific heat, and can be assumed constant to be 1.31 in the above equations.
2.1.2. Fuel air entrainment
The fuel air entrainment is characterized by the equivalence ratio along the axis of jet
The cross sectional average equivalence ratio, ̅, is determined by following equation
[2],
̅
√ ( ) (2.4)
In Equation (2-4), is the stoichiometric air-fuel ratio by mass for a given
fuel, x is the axial distance from the injector, and x+ is the characteristic length scale defined
by the following equation:
√ √ ⁄ (2.5)
In the above equation, d is the orifice diameter, Ca is the orifice area contraction
coefficient, is the ambient gas density, a is constant value of 0.75, ⁄ is the jet spreading
half-angle, and is a parameter accounting for the air entrainment reduction in reaction zone
downstream of the lift-off length, ⁄ , where is the adiabatic flame
temperature and is the ambient gas temperature. Upstream of the lift-off length, since
there is no reaction, .
The jet spreading half-angle is given by [2]:
⁄ [( )
√ ] (2.6)
2.1.3. Jet velocity
The jet velocity at the nozzle exit is determined using the pressure drop [3]:
√ (2.7)
In the above equation, the discharge coefficient is experimentally determined.
2.1.4. Ignition delay
A common expression for ignition delay in diesel combustion is the Arrhenius
expression [3]:
In this equation, A is the pre-exponential constant, E is the global activation energy, R
is the universal gas constant, represents the ambient density, and is the stoichiometric
mixture fraction. It is noticed that Equation (2.8) is a simple expression of a complex system.
The actual ignition delay varies with the physical process of injection, which is not taken into
account in Equation (2.8). For example, ignition delay decreases with the decrease of orifice
diameter.
2.1.5. Soot volume fraction
Soot is highly concerned during spray combustion, but its natural radiation emission
is broad in spectrum. Different researchers may use different bandwidth to quantify the soot
level. For example, 550 - 700 nm was used in Ref. [4], 360 – 440 nm in Ref. [5], among
many other choices from different researchers. Numerous efforts have been done to measure
the soot volume fraction, among which laser induced incandescence (LII) shows promising
progress.
The soot volume fraction, fv(z), at the cross section of a spray combustion can be given by
[6]:
∫⁄ (2.9)
(2.10)
In the above equations, KL(y=0) is the optical thickness at an axial location, is
the LII intensity, is the induced laser wavelength, is the spray edge radius,
is estimated as 0.26 for spray combustion. The derived soot volume fraction has
the unit of ppm.
2.2.
Effect of ambient oxygen on soot and NO
x2.2.1. Soot
The effect of ambient oxygen on soot emissions has not been clarified. It is expected
that less oxygen reduces the flame temperature, therefore decreases the soot formation. On
combustion. The mechanisms are complicated and coupled; therefore they have not been
validated.
The oxygen concentration in ambient air is often interpreted as the EGR level in
internal combustion engines. In the research of [6], ambient oxygen concentration was
controlled from 21% to 8%, simulating different EGR levels. The results showed that with
the decrease of oxygen concentration, the peak soot volume decreases. The total jet
cross-section soot increases initially with oxygen decreases, and then gradually reduces to zero as
the oxygen concentration decreases to 8%. This is in agreement with the engine pipe-out
particle matter measurement. The location of lift-off length, which was suggested by OH
chemiluminescence, increases with the decrease of oxygen. It is interesting that the
calculated equivalence ratios are same for the different oxygen levels, implying that ignition
requirement for the fuel is same for different oxygen levels.
In the same research [6], planar LII (PLII) imaging showed that the distance between
the lift-off and first-soot location increases with the decrease of oxygen concentration,
suggesting a longer residence time to accumulate soot formation. The Chemkin calculation
showed a reduction of soot formation due to the lower combustion temperature as the oxygen
concentration decreases. Therefore, there is a competition between residence time and lower
combustion temperature, which will determine the net effect of oxygen concentration in the
ambient air.
Temperature is critical to soot formation. Even in the less oxygen environment, if the
ambient temperature is high, the soot formation is greatly accelerated [6]. This makes the
cooling of EGR as the necessity to meet the particulate matters regulation.
2.2.2. Nitrogen oxides
It has been widely accepted that in internal combustion engine, the thermal
mechanism dominates the NOx formation [14]. There are three reactions, called extended
Zel’dovich mechanism, as follows
N + O2 = NO + O
(2.12)
N + OH = NO + H (2.13)
The large numbers in the reaction rate coefficient of above reactions (not shown here)
imply that the Zel’dovich mechanism features strong temperature dependence. It mainly
occurs at high temperature under slightly lean conditions within the burned products. For this
reason, less oxygen, which reduces the flame temperature, is expected to reduce NO
formation. The most impacting factor of ambient oxygen to the NOx emission should be
through the temperature, as the NO formation starts at the temperature above 2000K, which
is the temperature range of post combustion products.
In fact, there is dramatic difference between the ideal prediction of equilibrium NO
and actual NO formation in cylinder, indicating that the equilibrium of the above Equations
(2.11)-(2.13) has not been reached in the in-cylinder combustion [14]. The difficult start of
Equation (2.11) is resulted from the triple-bond of N2 molecule, making the generation of N
atom slow. The rate coefficient of Equation (2.11) drags the production of NO far behind the
equilibrium at the local temperature. After top dead center, when combustion proceeds, the
temperature drops quickly because of the expansion stroke. The equilibrium calculation
expects NO decomposed to nearly zero concentration, while in fact, the NO concentration is
rather frozen at this stage even it is emitted to the exhaust. This is because of the drastic
reduction of N, O, and H as the temperature reduces, which prevents the Equations
(2.11-2.13) proceed backward. This is also an implication that the engine-out NO measurement is
close to the actual NO formation in-cylinder.
2.2.3. A short summary
The effect of oxygen on the emission of soot and NOx has been studied extensively.
Ambient oxygen has a complicated effect on soot. Higher oxygen concentration level,
depending on whether the temperature increase effect or less residence time for soot
formation effect dominates, will overall increase or decrease soot emission. The ambient
temperature. Less ambient oxygen reduces flame temperature, thus reduces NOx emission. It
is noted that engine-out NOx is close to the in-cylinder NOx formation.
2.3.
Biodiesel combustion
2.3.1. Biodiesel property
Biodiesel is a mono-alkyl ester based oxygenated fuel made from natural, renewable
sources like new or used vegetable oil and animal fats [15]. Biodiesel, despite of the original
sources, is generally comparable to conventional diesel fuel, and can be blended in any
portion with petroleum diesel. The current research indicated that blended or pure biodiesel
can be used in current compression ignition (CI) engines without major modification of the
engines.
The properties of some biodiesel are listed in Table 1. It can be seen that the biodiesel
properties are quite similar to those of conventional diesel. In general, biodiesel is more
viscous than petroleum diesel. Since the fuel in commercial market is usually measured by
volume, here we compare the heating value by volume. The lower heating value (in mass) of
biodiesel is about 5% less than that of diesel. The cetane number of biodiesel is ~50, which is
good for current compression ignited engines. Biodiesels have a higher flash point except the
one from tallow source. The density of biodiesel is generally 5% more than petroleum diesel.
2.3.2. Engine performance 2.3.2.1. Brake effective power
In most studies, the engine is tuned to cover the whole range of load (concentrating
mainly on 25%, 50%, 75% and 100% of maximum torque) at various speeds to simulate the
representative engine conditions. Most of the research indicates a slight power and torque
loss with biodiesel, while this decrease is less than the heating value reduction of biodiesel
with respect to that of diesel [16].
It is inferred that only at full load condition, the power output delivered by biodiesel
is reduced with respect to that delivered by diesel fuel. Despite of 8% reduction in heating
potential reasons for the power recovery may include: 1) high viscosity of biodiesel reduces
the back flow across the piston clearance of the injection pump, thus allow more fuel to be
injected. Research indicates that both mass and volumetric flow rate increases 1.2~3.2% in
biodiesel case [17]. The extra injected fuel serves a compensation for the smaller heating
value of biodiesel; 2) the oxygenated biodiesel encourages the ignition and development of
flame in engine cylinders, which advances the ignition and combustion process. This brings
the combustion closer to TDC and thus increases the overall power output; 3) higher lubricity
of biodiesel facilitates the reduction in friction which in theory contributes to the increase of
brake power. However, few researches have claimed explicitly the power recovery within
this reason, and yet the measurement has been implemented.
Considering current engine is generally oversized and the accelerator is not fully
pressed during the most time of engine operation, the power loss with biodiesel (only at full
load cases) is acceptable, even unnoticeable. At the partial load conditions, the power loss is
partially or fully recovered by the advantages of biodiesel.
2.3.2.2. Brake specific fuel consumption (bsfc)
Brake specific fuel consumption (bsfc) is defined to be the ratio of mass fuel
consumption to the brake effective power, thus is a parameter to evaluate the fuel energy
density. The bsfc is expected to increase about 14% for biodiesel with respect to diesel due to
the lower heating value of biodiesel in mass base. Since the loss of the heating value derives
the oxygen content in biodiesel, it may serve a good indicator to expected fuel consumption.
A good relation has been found between oxygen content and bsfc for biodiesel from soybean
oil in blends and pure [18]. It is noticed that the increase in bsfc is only observed when
oxygen enrichment derives from the fuel, not from the intake air [19].
US EPA conducted a statistical research into the bsfc of heavy duty vehicle without
EGR and aftertreatment system in laboratory scale [11]. An empirical expression describing
bsfc of biodiesel in function of biodiesel content in the blend of bio- and regular diesel is
where the subscript D represents diesel and B the percentage value of biodiesel content in the
blend ( 0≤B≤100). By integrating the data from 39 papers, this equation provides a
confidence level of 95%. Though the relation is exponential expression, it is nearly linear in
the variable range (Figure 2.1). It is intriguing that the maximum value of bsfc (~9%) is less
than expected value (~14%) from the heating value analysis. This may imply a certain
improvement of thermal efficiency with biodiesel.
Though there are a few researches indicating less increase or even decrease of bsfc
for biodiesel fuel, a majority of researches has found that increase in biodiesel fuel
consumption is proportional to the biodiesel contents in the blends and to the heating value.
Moreover, there is no significant effect of origin of biodiesel on the bsfc.
2.3.2.3. Thermal Efficiency
Thermal efficiency is the ratio of output power to energy introduced into engine. The
actual thermal efficiency is defined as
η (t-act) b ((m f ) η c ) (2.15)
where b is the bra e power, m f is the fuel mass flow rate, the fuel lower heating value, η c combustion efficiency.
In theoretical analysis, dual cycle is normally used to simulate the actual diesel engine
operation. In Figure 3, under the same compression ratio, the efficiency of Otto cycle is the
highest, while the Diesel cycle has the lowest one. Though this figure does not apply to the
different engine operation since the pressure of diesel engine is much higher than gasoline
engine, it can be used to analyze the same engine with the same compression ratio. For the
dual cycle with biodiesel, since the combustion is brought to the TDC and, in Figure 3, it is
moving toward Otto cycle; therefore, η (t-act) for biodiesel is expected to increase.
However, the advance is so little that may not produce significant effect on the overall
thermal efficiency.
In fact, most researches indicate no dramatic difference in thermal efficiency with
efficiency is not changed significantly with biodiesel [18]. It showed that origin of biodiesel,
the length of the carbon chain, and the number of double bonds did not play a noticeable role
in affecting thermal efficiency.
2.3.3. Emission
The regulated emission includes nitric oxides, particulate matters, carbon monoxide
and unburned hydrocarbons. Figure 4 shows a research conducted by US EPA into the effect
of biodiesel on the heavy duty engine emissions [11]. This research collected data from the
engines without EGR and aftertreatment in laboratory scale. It shows a slight increase of
NOx and dramatic reduction of PM, CO and HC. Each pollutant is discussed below with the
comparison of different research and the mechanisms are addressed.
2.3.3.1. Nitric oxides
Most literatures indicate a slight increase of NOx emission within biodiesel, and
modeling work also supports this observation. The latter obtained reduced auto-ignition time
and higher extension of high temperature zones with biodiesel [9]. Since high temperature is
normally considered as the promotion to the NOx formation, the modeling results have been
used to explain the experimental observation of NOx increase with biodiesel.
On the other hand, there are some other researches showing differences in the trend.
There are researchers claiming that effect of biodiesel on NOx emission depends on the type
of engine and operation conditions. For example, fully loaded condition exhibits an increase
of 9.5%, while partially loaded (transient urban cycle) produces a reduction of 6.5% [10]. In
EPA report [11], for B20 blends, a number of research results also indicated a reduction of
NOx, though the percentage is small compared to the apparent reduction for other emissions.
The reasons for NOx increase with biodiesel have been proposed. The advance of
start of injection, caused by the properties of biodiesel (viscosity, density, compressibility,
sound velocity), is used to explain the advance of the combustion, thus leads to higher mean
effective pressure in cylinder and higher NOx emission. This is widely proved in
temperature is proposed to contribute the higher NOx emission. This higher flame
temperature may be caused by the characteristics of biodiesel as well as the less heat
dissipation due to the reduced soot in the flame.
There is a proven relation between NOx emission and molecular unsaturation [11]. It
was observed that, soybean-oil provided a 15% increase NOx emission compared to that with
diesel fuel, rapeseed provided a 12% increase, while animal fat only provided a 3%. It is then
concluded that more saturated biodiesel produce less NOx emission in older injection system.
However, when common rail system is used, this effect is less significant, even the older
injection system provides the same high injection pressure [12].
Other reasons are also proposed including: increased cetane number of biodiesel, and
higher oxygen availability of biodiesel. However, these two reasons are questionable. Higher
cetane number may cause not only the combustion advance, but also a decrease of premixed
combustion. The latter is considered to soften the pressure and temperature gradients, and
thus to lower NOx formation. The US EPA report [11] also concludes the negative relation
between NOx and cetane number for biodiesel fuel. As to the oxygen availability
explanation, it is argued that the internal oxygen content is not enough to compensate the
difference at the flame region, where diffusion flame occurs at around stoichiometric ratio
between fuel and air.
Besides the reasons mentioned above, there are other potential ones. The more details
of the injected fuel characteristics, especially the droplet size distribution, droplet size
distribution, spray penetration, heat dissipation, etc, which might place an influence on the
ignition delay, premixed/diffusion combustion ratio, and subsequently, affect NOx
formation. Recalling the prompt mechanism of NOx formation is the major factor in rich
flame, it is worthy of investigation into the important radicals in the biodiesel flame.
Meanwhile, the correlation between reduced soot formation and NOx formation needs to be
further researched.
From the discussion above, two measures are usually considered in reducing NOx
fuel property. The former one involves the delay of the start of injection, combination of
EGR, increase of injection pressure. To accommodate the versatility of biodiesel, a sensor is
proposed to detect the biodiesel content in the fuel so as to adjust the injection timing
controlled by ECU [17]. A simultaneous reduction in NOx and soot emission is achieved by
using multi-injection strategy with a longer dwell time between two injections [13]. The
latter measure involves the selection of more saturated biodiesel, hydrogenerating of
biodiesel, the addition of certain compounds like cetane enhancer or anti-oxidant, and so on.
These measures are mostly at the research stage and in need of further laboratory and on road
verification.
2.3.3.2. Particular matter
In general, the use of biodiesel or blends produces a reduction of particular matter
(PM), while this effect depends on the engine type, load, and operation conditions. Some
major factors are listed together with their effects in Table 2.2.
There are several explanations on the PM reduction for biodiesel, among which the
following three reasons may be more important than others.
Firstly, the oxygen content in biodiesel fuel enables a more complete combustion
especially in rich diffusion flame and promotes the oxidation of formed soot. As the oxygen
content in fuel increases, the larger fractions of fuel carbon are converted to CO in the rich
premixed region, rather than soot precursors. This decarboxylation mechanism has been
verified by an experiment using C-14 labeling technique, which confirmed that largest
amount of CO2 is formed in the case of esters through decarboxylation.
Secondly, the absence of aromatics in biodiesel fuels leads to less PM emission.
Aromatic hydrocarbons are normally considered as precursors of soot. Due to the nature of
production process of biodiesel, the aromatic component is much less compared to that in
conventional and even ultra-low sulfur diesels. Therefore, the soot formation is not favored
Thirdly, more active structure of soot formed from biodiesel promotes the oxidation
in the flame regions. Transmission electron microscopy (TEM) images show more
amorphous and disordered arrangement of grapheme segments for biodiesel soot compared
to diesel soot [20]. Moreover, the internal structures of primary particles tend to create
hollow cavities probably caused by internal oxygen of biodiesel molecules [8]. It is then
suggested that biodiesel soot is more reactive as opposed to diesel soot, thus it is easier to be
oxidized in the following flame regions.
Other factors like combustion advance, nil sulfur content, lower boiling point of
biodiesel are also proposed by different authors. However, these are less important compared
to the above three either because its minor effect in actual operation (eg. Combustion
advance), or less applications in industry (eg. ULSD is widely used that sulfur is in minor
consideration).
Particle size distribution (PSD) is an important parameter to describe the harmfulness
of particle and thus is specially focused. Currently it is difficult to precisely measure the
effect of biodiesel on PSD because it is very sensitive to the dilution prior to sampling and
engine operation conditions. However, the majority of researchers have reported the increase
in number of smaller particles (<40 nm), a reduction in number of larger particles (>50 nm)
and total particle numbers. The mean diameter of particles is then found to decrease from
~80 nm (diesel) to ~60 nm (biodiesel). Some researchers also observed no significant
increase or even decrease of smaller particle number. The effect of biodiesel on the PSD is
yet to be determined and needs further research.
2.3.3.3. Unburned hydrocarbons
Most researches have shown a sharp decrease in unburned hydrocarbons (UHC)
within the increase of biodiesel content in blend [16]. The maximum reduction is ~70% for
pure biodiesel compared to conventional diesel [11]. The engine operation modes and
biodiesel origins seem to have negligible effect on the UHC emission. The presence of
oxidative catalytic converter and the use of ULS diesel will soften the decrease the UHC
The potential reasons for the UHC reduction include: the oxygen content in biodiesel,
which leads to a more complete combustion; the higher cetane number of biodiesel, which
reduces the ignition delay and advances combustion timing, etc. The other issue is that the
measurement of UHC by conventional methods, flame ionization detectors (FIDs) may not
have enough sensitivity in detecting the lower level of UHC in the exhaust gas. The sampling
procedures also need to be considered since UHC may condensate and deposit on the inner
wall of sampling pipe line. Most researchers agree that biodiesel origin is not a factor
affecting UHC emission.
2.3.3.4. Carbon monoxide
Carbon monoxide (CO) reduction is observed in most experimental investigation
when using biodiesels. The maximum reduction is ~50% for biodiesel with respect to
conventional diesel [11].
Among the factors that were researched, load condition has been proven to have a
remarkable effect on CO emission. Most authors report CO emission does not change
significantly or even increases when using biodiesel at low-load conditions. Meanwhile,
biodiesel fuels might reduce CO when engines are not equipped with oxidation converter,
which needs further research to reach a conclusion.
As to the reasons of CO reduction for biodiesel, once again, it is believed the oxygen
content in biodiesel fuel has played an important role. This is confirmed by an experiment
that increases the oxygen concentration in combustion chamber by either oxygenated fuels or
oxygen enriched air. When using animal fat originated biodiesel, CO emission is found to be
less than that from vegetable oil based biodiesel [11]. This may imply that CO emission
decrease as the saturation level increases. Another factor being considered is acid level. It is
found that increased acid level of fuel produces increased level of CO emission [16]. This
might be caused by a higher hydroperoxide concentration as the acid value is higher, since
2.3.4. A short summary
The engine performance and emission when using biodiesel fuels are reviewed. Upon
the discussion, the following results have been achieved:
Brake effective power for biodiesel is reduced only at fully load conditions.
No significant difference has been observed for partial load conditions due to
the power recovery from extra injected fuel and advance of the combustion.
Brake specific fuel consumption (bsfc) increases for biodiesels due to
reduction in heating value. However, the increase of bsfc is less than reduction
in heating value, which may be caused by the power recovery mentioned
above. Thermal efficiency is not dramatically changed for biodiesel.
NOx emission is found to increase for biodiesels. The reason is partially
because the advance of combustion timing and/or injection (negligible in
common rail system). Adjustment of injection timing or improvement of
biodiesel fuel may reduce the NOx and soot simultaneously.
PM has been greatly reduced for biodiesel due to the decrease of formation
and increase of oxidation of soot. Oxygen content in fuel, absence of
aromatic hydrocarbons and more reactive of soot are the potential reasons to
cause this reduction for biodiesel. It is noticeable that the reduction in PM for
biodiesel could be eliminated or even reversed in cold start condition. The
number of smaller PM is found to increase in most research. The effect of
biodiesel on the particle size distribution is yet to be fully understood.
Unburned hydrocarbons and carbon monoxides usually decrease significantly
in most researches. A more complete combustion, due to oxygenated biodiesel
2.4.
Two color pyrometry
2.4.1. Principles
2.4.1.1. Two-color method
lanc ’s law describes the intensity of radiation from a blac body in the function of
wavelength and the temperature of the black body as follows [21]:
2
1
, ( ) 5 ( / )
1
b C T
C
E T
e
(2.16)
where C1 and C2 are the first and second lanc ’s constants.
The monochromatic emissivity of a non-black body is defined as
, ,
( ) ( )
( ) ( )
b b
I T E T
I T E T
ò (2.17)
where and are the monochromatic emissive power from the non-black body and black body at the same temperature and the same wavelength.
In the two-color method, an apparent temperature is introduced and defined as the
temperature of a block body which emits the same radiation intensity as a non-black body at
temperature T. is named brightness temperature. It therefore follows
, ( ) ( )
b a
I T I T
(2.18)
Substituting Eq. (2.18) into (2.17), the monochromatic emissivity can be expressed as
, , ( ) ( ) b a b I T I T
ò (2.19)
Combining Eq. (2.19) and (2.18), one can obtain that
2 2 ( / ) ( / ) 1 1 a C T C T e e ò (2.20)
In practice, Eq. (2.20) is approximated by the following empirical relation developed
( / ) 1 e KL
ò (2.21)
where K is an absorption coefficient and proportional to the number density of soot particles;
L is geometric thickness of the flame along the optical axis of the detection system. The
value of α depends on the optical and physical property of soot particles.
An alternative way to approximate emissivity is to apply Rayleigh theory,
( ) 1 V F L f e
ò (2.22)
where
2 2 2 2 2
36
( 2) 4
F
n k n k
nk
(2.23)And is the soot volume fraction, n and k are the real and imaginary parts of soot
refractive index, , which are dependent on wavelength.
Combining Eq. (2.20) and (2.21) to yield
2 2 ( / ) ( / ) 1 ln 1 1 a C T C T e KL e
(2.24)
If the measurement is simultaneously conducted on two different wavelengths, KL in
above equation can be eliminated and then we have
2 1
1
2 1 2 2
2 1 2
2
1 2 2
( / ) ( / ) ( / ) ( / ) 1 1 1 1 1 1 a a
C T C T
C T C T
e e e e
(2.25)
The reason to use Eq. (2.24) instead of Eq. (2.20) to determine temperature T is that
KL is only reflection of soot particles while monochromatic emissivity depends on used
wavelength.
If the apparent temperature and are known, the temperature of soot particle
![Table 2.2 Factors investigated in affecting PM emission with biodiesel [16]](https://thumb-us.123doks.com/thumbv2/123dok_us/1247183.1157376/48.612.85.535.137.343/table-factors-investigated-affecting-pm-emission-biodiesel.webp)