Proc IMechE Part H: J Engineering in Medicine 226(11) 868–876 !IMechE 2012 Reprints and permissions:
sagepub.co.uk/journalsPermissions.nav DOI: 10.1177/0954411912455004 pih.sagepub.com
Application of simple biomechanical
and biochemical tests to heart valve
leaflets: Implications for heart valve
characterization and tissue engineering
Hsiao-Ying S Huang
1, Brittany N Balhouse
2and Siyao Huang
1Abstract
A simple biomechanical test with real-time displacement and strain mapping is reported, which provides displacement vectors and principal strain directions during the mechanical characterization of heart valve tissues. The maps reported in the current study allow us to quickly identify the approximate strain imposed on a location in the samples. The biome-chanical results show that the aortic valves exhibit stronger anisotropic mebiome-chanical behavior than that of the pulmonary valves before 18% strain equibiaxial stretching. In contrast, the pulmonary valves exhibit stronger anisotropic mechanical behavior than aortic valves beyond 28% strain equibiaxial stretching. Simple biochemical tests are also conducted. Collagens are extracted at different time points (24, 48, 72, and 120 h) at different locations in the samples. The results show that extraction time plays an important role in determining collagen concentration, in which a minimum of 72 h of extraction is required to obtain saturated collagen concentration. This work provides an easy approach for quantifying biomechanical and biochemical properties of semilunar heart valve tissues, and potentially facilitates the development of tissue engineered heart valves.
Keywords
Heart valves, real-time maps, mechanical property, collagen, microstructure
Date received: 5 April 2012; accepted: 20 June 2012
Introduction
Heart valve leaflets are thin, collagenous tissues whose anisotropic biomechanical function depends intimately on the biochemical composition and structure.1In dis-ease states, the leaflets can become too stiff or too floppy. A common theme, however, in both stenotic and myxomatous disease is disturbance of the finely tuned structure–function relations governing heart valve homeostasis.2 Toward understanding the valves and how best to replace them, numerous studies have focused on characterizing their mechanical behavior,3–5 microstructural organization,6,7and molecular and cel-lular level compositions.8–10However, while their essen-tial anatomic peculiarities have been acknowledged for nearly a century,11heart valve leaflets continue to chal-lenge investigators, particularly in the context of tissue engineering.12
Tissue engineering approaches aim to generate living native-like prosthetics from combinations of cells and biodegradable polymer scaffolds.13 The motivation for
heart valve tissue engineering stems from the limita-tions of current replacement valves. In particular, while lifesaving, bioprosthetic valves and cryopreserved valve allografts are not permanent in young to middle-age patients, as they incur progressive calcific14and fatigue-related15 degeneration during implantation. By con-trast, mechanical valves, while effectively permanent, give rise to nonphysiological hemodynamics16 and are thrombogenic, requiring lifelong anticoagulation with associated bleeding risks. Perhaps paramount are the
1
Department of Mechanical and Aerospace Engineering, North Carolina State University, Raleigh, NC, USA
2
Department of Biomedical Engineering, North Carolina State University, Raleigh, NC, USA
Corresponding author:
Hsiao-Ying Shadow Huang, Department of Mechanical and Aerospace Engineering Department, North Carolina State University, R3158 Engineering Building 3, Campus Box 7910, 911 Oval Drive, Raleigh, NC 27695, USA.
tery of specialized biochemical assays and mechanical test equipment.
Hallmarks of heart valve leaflets are their nonlinear, anisotropic mechanical response and web-like collagen network. While their prototypical soft tissue stress– strain curves—comprising toe, transition, and linear regions—can be obtained by conventional uniaxial ten-sile testing,21 formulation of structure-based constitu-tive models amenable to simulating in situ deformation has traditionally relied on biaxial testing.22,23In partic-ular, biaxial tensile testing data retain the influence of axial coupling, allowing for more precise predictions under generalized loading conditions. Biaxial testing devices, however, are generally custom-built and are significantly more complex than their uniaxial counter-parts, including computer-coordinated control of two loading axes and optical mapping of tissue strains.24,25 For the heart valve tissue engineer, a relatively simple, commercially available biaxial tester could facilitate testing and accelerate development.
The BioTester 5000 (CellScale Biomaterials Testing, Waterloo, ON, Canada) was introduced in 2008 as a turnkey biaxial test system.26Designed for testing
pla-nar tissues and biomaterials under physiologic condi-tions, the BioTester has previously been applied to materials ranging from human sclera27 to annulus fibrosa.28In the current study, a BioTester was used to characterize the biaxial mechanical responses of porcine aortic valve (AV) and pulmonary valve (PV) leaflet tis-sues, providing a comparison with previously reported
tion time plays an important role in determining col-lagen concentration in native tissues. Therefore, the current study provides quantitative mechanical and biochemical data for semilunar valve tissues.
Material and methods
Mechanical characterization of heart valve tissue
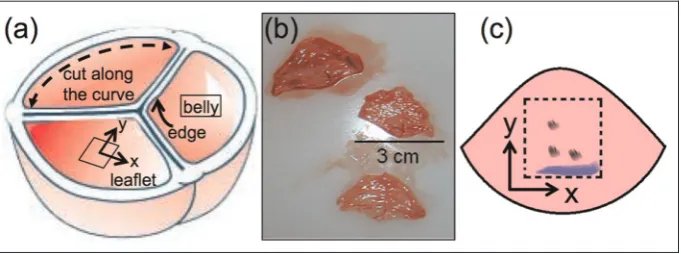
Briefly, five porcine hearts from large sows (greater than 300 lbs) are obtained from the Nahunta Pork Center (Pikeville, NC) immediately after slaughtering and are returned to the laboratory within 60 min of sacrifice for dissection. The AV and PV are dissected from each heart, and the leaflets are removed from their respective roots. The removal is completed by cutting axially along the aorta and pulmonary artery toward the heart until the valves are reached. Each leaflet is then stretched out and held taut while being cut against the wall of the artery represented by the dashed line in Figure 1(a). A total of 13 AV and 13 PV leaflet samples are prepared (Figure 1(b))
For the biaxial testing, each of the six AV and PV leaflet samples (;7 mm37 mm) is marked according to the Cartesian coordinate system: the x-axis sents the circumferential direction and the y-axis repre-sents the radial direction of the heart valve tissues. Three dots are marked with a surgical marker after the samples are cut to size: one of the dots acting as the origin and the other two made to define each axis
(Figure 1(c)). The samples are stored in Hank’s Balance Salt Solution (HBSS) for the relaxation.
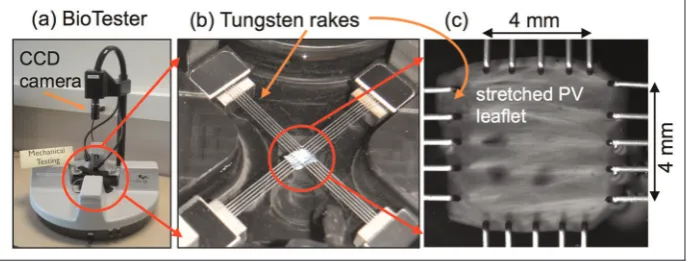
A biaxial tissue tester (BioTester 5000), equipped with two load cells (50061 mN) for each axis of load-ing, is used for measuring the force and displacement of the semilunar heart valve tissue leaflets (Figure 2). The measured values are used to further obtain stress–strain curves and to calculate the parameters of the material’s stiffness. Synchronized time lapse video for real-time monitoring and postprocess analysis is provided by the charged-couple device (CCD) camera, which acquires images with a pixel resolution of 12803960 at an acquisition rate of 15 Hz, with a lens focal length of 75 mm (Figure 2(a)). A temperature-controlled saline bath with data logging capability provides a physiologi-cal environment for testing soft tissue specimens.
Specimen mounting is considered as one of the major challenges of biaxial testing.26,29 For example,
artifacts such as suturing procedures usually cause dis-crepancy in results due to inconsistent boundary condi-tions. In contrast, BioRakes provide fast and accurate sample mounting: each BioRake consists of five tung-sten tines used to anchor one edge of the specimen26 (Figure 2(b)). Four rakes provide uniform attachment across the edges of the samples and evenly distribute load spanning 4 mm in length on each side of the sam-ple (Figure 2(c)). This unique feature not only assures the control of boundary conditions but also signifi-cantly reduces the variability between sample sizes. In other words, if the sample size prepared is larger than 4 mm2, the active loading area remains 4 mm34 mm.
After the sample is mounted, the sample is lowered into the HBSS bath, which is heated to 37"C to simulate an in vivo physiological environment. The heart valve leaf-let samples are tested up to 35% strain on both axes with a 15-s stretch and a 15-s recovery, with no hold time. The image tracking and analysis software (LabJoy; CellScale), an integrated image analysis mod-ule for BioTester, is used to capture corresponding dis-placement and strain maps in AV and PV samples during equibiaxial testing.
Microstructures of the collagen fibers and cell nuclei are preserved for microscopic investigation via histolo-gical preparation. Histolohistolo-gical photomicrographs of AV and PV leaflet samples are prepared as follows: The leaflets under 0% strain were fixed in 10% (v/v) buf-fered formalin, paraffin embedded, sectioned, and stained with Masson’s trichrome. The collagen fibers stained by Masson’s trichrome appear blue, whereas the cell nuclei appear dark brown to black. Each histo-logical slide cutting in the x–y plane (en face section) is quantified from the fibrosa layer. The histological slides were digitized as photomicrographs via a Leica DM LB optical microscope (Leica Microsystems, Wetzlar, Germany) at 4003 magnification using techniques adapted from published articles.9
Biochemical analysis of heart valve tissue
Collagen concentrations (collagen types I, III, and V) of the semilunar valve leaflets are determined via an assay kit (Sircol; Accurate Chemical & Scientific Corp., Westbury, NY) by using techniques adapted from pub-lished articles.30–33 In brief, 84 samples (;25 mm31 mm31 mm) obtained from seven valves are prepared. For each valve, three samples are cut from the belly region and three samples are cut from the free edges of the leaflets (Figure 1(a)). The samples are weighed using an analytical balance (VWR, West Chester, PA).
Collagen extraction. To allow the collagen to be extracted from the tissue, 100 mL of collagen extraction solution is prepared, composed of 97.14 mL of distilled water, 2.86 mL of 17.5 N acetic acid (Sigma–Aldrich, St. Louis, MO), and 100 mg of pepsin (Sigma–Aldrich). A temporal parametric study is performed to obtain max-imum collagen concentration from heart valve tissues. Collagen extraction solution of 1 mL is added to each tube, and samples are placed on a vortex mixer (VWR, West Chester, PA) for 24, 48, 72, and 120 h, respec-tively. The collagen concentration is quantified based
Figure 2. The BioTester is capable of applying physiologically plausible biaxial loading states to tissue samples. The tungsten rakes pierce through samples and provide evenly distributed loading. This unique feature assures the control of loading conditions and significantly reduces the variability associated with testing different sample sizes.
on the precalculated collagen standard curve described as follows.
Collagen standard curve. Four standards are prepared using 0.5 mg/mL collagen standard (Sircol; Accurate Chemical and Scientific Corp., Westbury, NY) with four different volumes: 100mL, 50mL, 25mL, and blank: 0mL. The mass of collagen is calculated based on the concentration and volumes, and results in 50, 25, 12.5, and 0mg, respectively. Four extraction solutions, 0, 50, 75, and 100mL, respectively, are then added to four microcentrifuge tubes to make up a total volume of 100mL for each tube.
Collagen content quantification. The collagen content is dyed with 1 mL of reagent (Sirius red dye, picric acid, and surfactants), dissolved in 1 mL of alkali reagent, and quantified via a spectrophotometer (Thermo Fisher Scientific, Waltham, MA). A collagen standard curve (y = 0.0246x, R2= 0.9963) is established via four absorbance values from the standards, where y is the absorbance value at 550 nm, x is the mass of collagen, and R is the correlation coefficient between x and y. The collagen masses of 84 samples are calculated by comparing absorbance values to that of the collagen standards. The collagen concentration of each sample is then calculated by normalizing to the wet weight of the individual collagen sample.
Statistical analysis
Data are presented as the means6standard deviations. The number of experimental samples is represented as
n. Student’st-tests are used to test differences in popu-lation means. Differences with p\0.05 are considered significant.
Results and discussion
Mechanical properties of heart valves
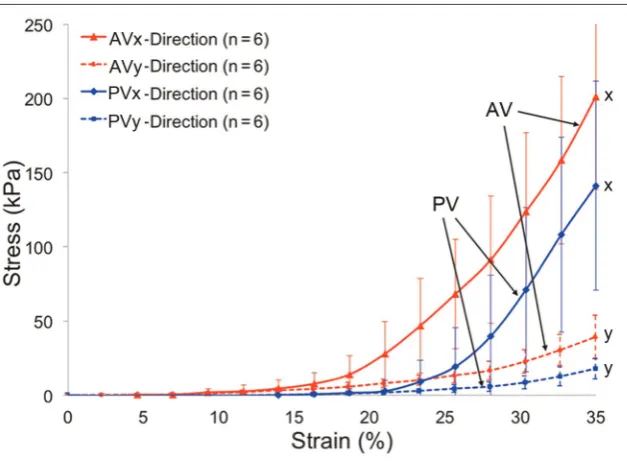
After averaging over measured stress versus strain for AV and PV leaflets samples under equibiaxial testing, the results are shown in Figure 3. The plot shows the correlation between the strain and the resulting stress in the circumfer-ential (x-axis) and radial (y-axis) directions for both AV and PV tissue samples. The stress–strain curves are calculated based on the displacements of 81 tracked points, as defined inside the red boxes (Figure 4). These red boxes are user defined and located 1.5 mm inward from the boundary. The aim is to reduce any potentially confounding effects on the stress–strain data associated with potential stress con-centrations and/or inhomogeneous strains manifesting in the peripheral region of the tissue specimen gripped by the rakes. In Figure 3, three zones are observed: zone 1 is between 0% and 18% strain stretching, zone 2 is between 18% and 28% strain stretching, and zone 3 is between 28% and 35% strain stretching. Under equibiaxial stretching, it is observed that high standard deviations exist when sam-ples are tested above 18% strain. It could be due to the sen-sitivity of load cells and where force data were collected and averaged inside the red boxes. Piecewise parameters of material stiffness of valvular tissues in three zones are listed in Tables 1 and 2, and values are expressed as means6
standard deviations for AV and PV samples. Stress–strain curves in zone 1 provide moduli of elasticity of AV and PV tissues and stress–strain curves in zones 2 and 3 provide
Figure 3. Stress–strain curves for AV and PV tissue samples at different orientations. A nonlinear anisotropic mechanical property is observed in both AV and PV tissue samples. Three zones are observed: zone 1 (0%–18% strain), zone 2 (18%–28% strain), and zone 3 (28%–35% strain).
tangent moduli of elasticity. The differences between the direction-dependent stress versus strain curves in AV and PV tissue samples are mainly due to collagen fiber arrangements.7,34–36Most of the collagen fibers in AV and PV align circumferentially, and therefore, stiffer mechanical properties in the x-direction are observed, whereas collagen fibers in the PV sample are more ran-domly distributed than the ones in the AV samples (Figure 5).
Mechanical behaviors and their relation to collagen
fiber microstructures
In zone 1 (0%–18% strain), it is observed that the stiff-ness in the x-direction is more than twice that in the y-direction for AV samples (E(1)
AVx/E (1)
AVy= 2.6), suggesting
that AV has a slightly anisotropic material property in zone 1 (Table 1 and Figure 3). In contrast, the stiffness is comparable in the x- and y-directions for PV samples (E(1)
PVx/E (1)
PVy= 0.969), suggesting that PV exhibits an
iso-tropic material property in zone 1. This could be due to randomly distributed collagen fibers in PV samples not being fully aligned along the circumferential direction before reaching 18% biaxial stretching, as shown in Figure 5. The result also shows that AV samples are more than 7 times stiffer than PV samples in the x-direction (E(1)AVx/E(1)PVx= 7.8), but in the y-direction, AV
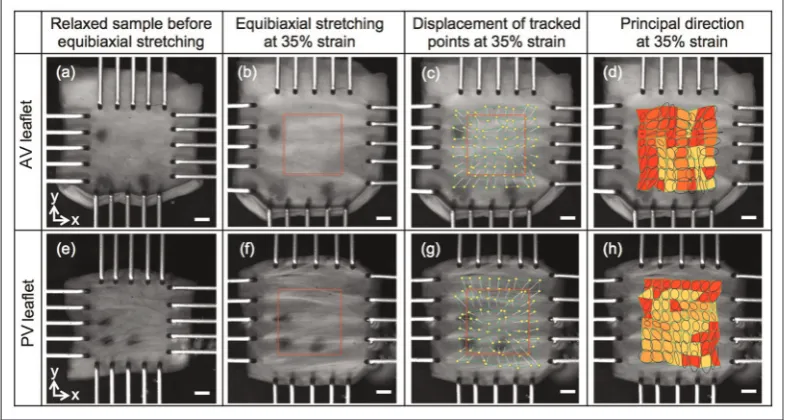
Figure 4. Corresponding macroscopic appearance of AV and PV samples under equibiaxial testing. Maps of displacement and principal strain are shown at 35% equibiaxial stretching. Collagen bundles are observed in PV samples. (Color online) Color key: Dark shade (red) = 25% strain, and light shade (yellow) = 15% strain. Scale bar: 1 mm.
AV: aortic valve; PV: pulmonary valve.
Figure 5. En face histological photomicrographs of AV and PV samples under 0% strain. Tissues are stained by Masson’s trichrome, in which collagen fibers are in blue and cell nuclei are in black. (a) Most of the collagen fibers in AV samples are along the x-direction. (b) Randomly distributed collagen fibers are observed in PV samples. Scale bar: 10mm,3400.
AV: aortic valve; PV: pulmonary valve.
Table 2. Tangent modulus of elasticity of valvular tissues in zones 2 and 3.
Etan(kPa) 18%–28% of
strain (zone 2)
28%–35% of strain (zone 3)
AV x-direction (Etan
AVx) 825.11629.19 1577.17653.69
AV y-direction (Etan
AVy) 116.4364.15 324.9369.84
PV x-direction (Etan
PVx) 408.23618.34 1457.19658.1
PV y-direction (Etan
PVy) 50.1662.01 172.4465.24
AV: aortic valve; PV: pulmonary valve.
Table 1. Modulus of elasticity of valvular tissues in zone 1.
E (kPa) 0%–18% of strain (zone 1)
AV x-direction (E(1)
AVx) 89.164.63
AV y-direction (E(1)
AVy) 33.9461.37
PV x-direction (E(1)
PVx) 11.3160.79
PV y-direction (E(1)
PVy) 11.6760.61
This finding is comparable to the one reported by Lewinsohn et al.3via uniaxial tensile testing and cor-relates well with the range in previous mechanical char-acterization studies via force–control biaxial testing.23,25,36 The similar x to y ratio for the mechani-cal property observed in zone 2 suggests that the distri-bution of collagen fibers along the circumferential direction versus that along the radial direction is com-parable in both AV and PV samples: the degree of ani-sotropy of fiber distribution is similar. AV samples are twice as stiff as PV samples in both the x- and y-directions (Etan (2)
AVx /E tan (2)
PVx = 2.0 and E tan (2) AVy /E
tan (2) PVy =
2.3), and it is suggested that collagen fibers exhibit simi-lar arrangements in the AV and PV samples between 18% and 28% strain (Table 2 and Figure 3). However, it is still not clear which intrinsic biological characteris-tic gives rise to the interesting microstructure features of collagen fibers that reflect back to the measured mechanical property in zone 2.
In zone 3 (28%–35% strain), it is observed that the stiffness in the x-direction is more than 4 times higher than that in the y-direction for AV samples (Etan (3)AVx / Etan (3)
AVy = 4.85), where the x to y ratio is lower than that
in zone 2 (Etan (2) AVx /E
tan (2)
AVy = 7) (Table 2 and Figure 3).
The decreased x to y ratio of this mechanical property in AV samples suggests that collagen fibers experience most realignment and straightening in zone 2, and therefore exhibit a linear elastic mode in zone 3. Different results are observed for PV samples and indi-cate that the stiffness in the x-direction is more than 8 times higher than that in the y-direction in zone 3 (Etan (3)PVx /Etan (3)PVy = 8.5), and it has a similar x to y ratio to that observed in zone 2 (Etan (2)PVx /Etan (2)PVy = 8.13) (Table 2 and Figure 3). This suggests that collagen fibers exhibit higher anisotropy in PV than that in AV in zone 3. Therefore, a higher degree of straightening is required for collagen fibers to be fully aligned between 28% and 35% strain stretching for PV samples, sug-gesting that collagen fibers are more randomly distribu-ted in the PV leaflets than in the AV leaflets. It is observed that the stiffness is similar in the x-direction for both AV and PV samples (Etan (3)
AVx /E tan (3)
PVx = 1.08),
but in the y-direction, the stiffness of AVs is almost twice that of PVs (Etan (3)AVy /Etan (3)PVy = 1.88).
Comparing to the result in zone 1, an almost 10-fold increase in the stiffness in the x-direction for AV
ferentially aligned collagen fibers. Moreover, col-lagen fibers in PV samples exhibit stronger realignment beyond 18% strain, and the materials exhibit anisotro-pically, rather than isotroanisotro-pically, as ones observed in zone 1.
Comparing the ratios in zone 2 (Etan (2)AVx /Etan (2)PVx = 2.0 and Etan (2)AVy /Etan (2)PVy = 2.0), the ratios between samples in zone 3 are slightly lower (Etan (3)AVx /Etan (3)PVx = 1.08 and Etan (3)
AVy /E tan (3)
PVy = 1.88). Moreover, the stiffness of AV
and PV samples in both the x- and y-directions are con-sistently two- and threefold higher than the ones in zone 2 (Etan (3)
AVx /E tan (2)
AVx = 2.0, E tan (3) AVy /E
tan (2)
AVy = 2.8, E tan (3) PVx /
Etan (2)
PVx = 3.6, and E tan (3) PVy /E
tan (2)
PVy = 3.4), suggesting that
collagen fiber alignment in both AV and PV tissues is saturated when samples are stretched above 28% strain (Table 1 and Figure 3).
It has been observed that the peak level of physiolo-gical strain experienced by the PV in vivo is approxi-mately 35%; in the current in vitro study, it was recognized in pilot experiments that PV samples began to tear when stretched above 35% strain, consistent with observations reported in other studies.37,38 In this study, it is intended to conduct a parametric study com-paring AV and PV mechanical properties. Therefore, tissue samples are biaxially stretched only up to 35% strain. For details on how AVs mechanically behave above 35% strain, the reader should refer to other studies.3
Real-time strain maps in heart valve tissues
respectively). Therefore, under equibiaxial testing, fiber bundles parallel to the circumferential direction in the PV samples are shown more clearly than the ones in the AV samples. Displacements of tracked points under equibiax-ial 35% strain are shown in Figure 4(c) and (g). The red boxes define the reference containing 81 points at 0% strain. The dots (color online: in yellow) indicate the loca-tions of these 81 points when samples are biaxially stretched at 35%. The tails (color online: in green) indicate the relative displacements of tracked points from ones at previous (; 32%) strain. The map of principal axes for deformed AV and PV samples at 35% equibiaxial stretch is shown in Figure 4(d) and (h). The principal axes are shown as black circles, and they are averaged across 16 points via the integrated image analysis module. The dar-ker shade (color online: in red) in the map indicates a higher strain value (25%), and the lighter shade (color online: in yellow) indicates a lower strain value (15%).
Collagen concentration
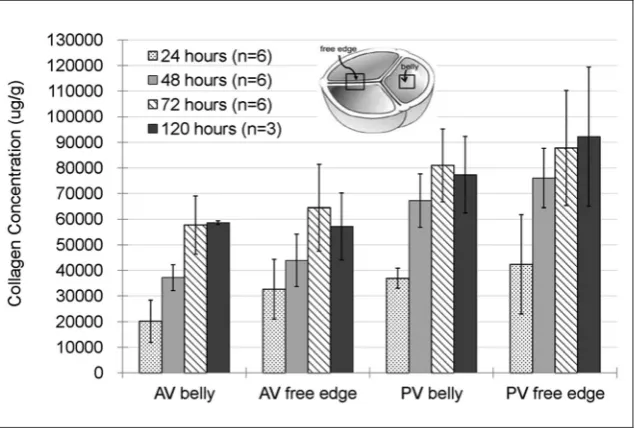
The collagen concentration is calculated by normalizing the wet weights of individual collagen samples at differ-ent time points (24, 48, 72, and 120 h), in which the averaged weight of AV leaflet samples in the belly region and the free edge are 0.0336 and 0.0186 g, respectively. The averaged weights of the PV leaflet samples in the belly region and the free edge are 0.0241 and 0.0161 g, respectively. It is observed that the extrac-tion time plays an important role in determining col-lagen concentration in native tissues, for which a minimum of 72 h of extraction is required to obtain a saturated collagen concentration (Figure 6); the col-lagen concentration in native heart tissues after 72 h is more than twice as much as those after 24-h extraction.
It is suggested that tissue engineered heart valve structs should be designed to have native collagen con-centration values comparable to native ones extracted for 72 h, as reported in the current study. Furthermore, the result shows that the collagen concentration is loca-tion dependent. It is observed that samples from free edges have higher collagen concentrations than those from belly regions, in both AV and PV samples. It was recently demonstrated that branching fiber bundles could be observed via polarized light microscopy along free edges of heart valve leaflets.6 Our result suggests that our higher measured collagen concentration at free edges can be attributed to these fiber bundles, which begin at the annulus and branch as they traverse toward the belly region of the leaflets. Finally, the result shows that native PV tissue samples have higher collagen con-centrations than those in the native AV tissue samples (Figure 6), suggesting that collagen concentration is valve type dependent. The lower concentration found in AV samples is attributed to the wet weight in the cur-rent study. Since AV samples have higher average wet weight, lower collagen concentration is obtained. Although AVs have higher mechanical strength than that of PVs, previous studies have shown that elasticity moduli are correlated with collagen cross-link concen-tration, rather than collagen concentration in the leaf-lets.38 Since collagen concentration extraction time is the focus of the current study, readers should refer to Balguid et al.38 for more details about cross-links in native heart valve tissues.
Conclusion
In the current study, a synergy approach is reported and aimed at understanding the interplay of heart valve
Figure 6. Collagen concentration at four different time points (24, 48, 72, and 120 h). The result indicates that the extraction time plays an important role in determining collagen concentration in native heart valve tissues. It is shown that collagen concentration depends strongly on the location and valve type.
microstructures of collagen fibers are panoramically examined and are correlated to the mechanical beha-vior of heart valve tissue leaflets. From the measured stress–strain curves, three zones are observed. In zone 1 (0%–18% strain), AV has a slightly anisotropic material property; however, PV exhibits an isotropic material property. In zone 2 (18%–28% strain), the distribution of collagen fibers along the circumferen-tial direction versus that along the radial direction is comparable in both AV and PV samples, suggesting that collagen fibers exhibit similar arrangements in the AV and PV samples. In zone 3 (28%–35% strain), collagen fibers exhibit higher anisotropy in PV than that in AV. Moreover, the stiffnesses of AV and PV samples in both the circumferential and radial direc-tions are consistently two- and threefold higher than ones in zone 2, suggesting that collagen fiber align-ment in both AV and PV tissues is saturated when samples are stretched above 28% strain. In addition, the collagen concentration in the native semilunar heart valves are also reported, and it is observed that the extraction time plays an important role in deter-mining collagen concentration in native tissues. The current study provides quantitative mechanical and biochemical data for semilunar heart valve tissues. The result of the study will culminate in synergistic activities between experimental and clinical efforts aimed at breakthroughs in the clinical treatment of heart valve diseases and the development of tissue engineered heart valves.
Funding
This research is partly supported by the Faculty Research and Professional Development at North Carolina State University.
References
1. Sacks MS, Merryman WD and Schmidt DE. On the bio-mechanics of heart valve function. J Biomech 2009; 42(12): 1804–1824.
2. Schoen FJ. Mechanisms of function and disease of natu-ral and replacement heart valves.Annu Rev Pathol2012; 7: 161–183.
3. Lewinsohn AD, Anssari-Benham A, Lee DA, et al. Ani-sotropic strain transfer through the aortic valve and its relevance to the cellular mechanical environment. Proc.
fiber architecture of the pulmonary heart valve cusp.Ann Thorac Surg2009; 87(4): 1240–1249.
8. Latif N, Sarathchandra R, Taylor RM, et al. Molecules mediating cell-ECM and cell-cell communication in human heart valves. Cell Biochem Biophys 2005; 43(2): 275–287.
9. Huang H-Y, Liao J and Sacks MS. In-situ deformation of the aortic valve interstitial cell nucleus under diastolic loading.J Biomech Eng2007; 129: 880–889.
10. Filip DA, Radu A and Simionescu M. Interstitial-cells of the heart-valves possess characteristics similar to smooth-muscle cells.Circ Res1986; 59(3): 310–320.
11. Gross L and Kugel MA. Topographical anatomy and histology of the valves in the human heart.Am J Pathol
1931; 7: 445–474.
12. Sacks MS, Schoen FJ and Mayer JE Jr. Bioengineering challenges for heart valve tissue engineering. Annu Rev Biomed Eng2009; 11: 289–313.
13. Langer R and Vacanti JP. Tissue engineering. Science
1993; 260(5110): 920–926.
14. Schoen FJ and Levy RJ. Calcification of tissue heart valve substitutes: progress toward understanding and prevention.Ann Thorac Surg2005; 79(3): 1072–1080. 15. Sacks MS. The biomechanical effects of fatigue on the
porcine bioprosthetic heart valve.J Long Term Eff Med Implants2001; 11(3–4): 231–247.
16. Dasi LP, Simon HA, Sucosky P, et al. Fluid mechanics of artificial heart valves.Clin Exp Pharmacol Physiol2009; 36(2): 225–237.
17. Perron J, Moran AM, Gauvreau K, et al. Valved homo-graft conduit repair of the right heart in early infancy.
Ann Thorac Surg1999; 68(2): 542–548.
18. Shinoka T, Breuer CK, Tanel RE, et al. Tissue engineer-ing heart valves: valve leaflet replacement study in a lamb model.Ann Thorac Surg1995; 60(6 Suppl): S513–S516. 19. Colazzo F, Sarathchandra P, Smolenski RT, et al.
Extra-cellular matrix production by adipose-derived stem cells: implications for heart valve tissue engineering. Biomater-ials2011; 32(1): 119–127.
20. Berry JL, Steen JA, Williams JK, et al. Bioreactors for development of tissue engineered heart valves. Ann Biomed Eng2010; 38(11): 3272–3279.
21. Sauren A, Hout MC, Steenhaven AA, et al. The mechan-ical properties of porcine aortic valve tissues.J Biomech
1983; 16: 327–337.
24. Grashow JS, Sacks MS, Liao J, et al. Planar biaxial creep and stress relaxation of the mitral valve anterior leaflet.
Ann Biomed Eng2006; 34(10): 1509–1518.
25. Sacks MS. Biaxial mechanical evaluation of planar biolo-gical materials.J Elast2000; 61: 199–246.
26. Eilaghi A, Flanagan JG, Brodland GW, et al. Strain uni-formity in biaxial specimens is highly sensitive to attach-ment details.J Biomech Eng2009; 131(9): 091003. 27. Eilaghi A, Flanagan JG, Tertinegg I, et al. Biaxial
mechanical testing of human sclera. J Biomech 2010; 43(9): 1696–1701.
28. Gregory DE, Veldhuis JH, Horst C, Brodland GW, Call-aghan JP, Novel lap test determines the mechanics of delamination between annular lamellae of the interver-tebral disc. Journal of Biomechanics 2011; 44:97–102. 29. Sun W, Sacks MS and Scott MJ. Effects of boundary
conditions on the estimation of the planar biaxial mechanical properties of soft tissues. J Biomech Eng
2005; 127(4): 709–715.
30. Brown AN, Kim BS, Alsberg E, et al. Combining chon-drocytes and smooth muscle cells to engineer hybrid soft tissue constructs.Tissue eng2000; 6(4): 297–305.
31. Engelmayr GC Jr., Rabkin E, Sutherland FW, et al. The independent role of cyclic flexure in the early in vitro development of an engineered heart valve tissue. Bioma-terials2005; 26(2): 175–187.
32. Engelmayr GC Jr., Papworth GD, Watkins SC, et al. Guidance of engineered tissue collagen orientation by large-scale scaffold microstructures.J Biomech2005; 39: 1819–1831.
33. Balguid A, Mol A, Van Vlimmeren MAA, et al. Hypoxia induces near-native mechanical properties in engineered heart valve tissue.Circulation2009; 119(2): 290–297. 34. Christie GW and Barratt-Boyes BG. Mechanical
proper-ties of porcine pulmonary valve leaflets: how do they dif-fer from aortic leaflets?Ann Thorac Surg1995; 60(0003– 4975): S195–S199.
35. Sacks MS, Smith DB and Hiester ED. The aortic valve microstructure: effects of transvalvular pressure. J Biomed Mater Res1998; 41(1): 131–141.
36. Billiar KL and Sacks MS. Biaxial mechanical properties of the natural and glutaraldehyde treated aortic valve cusp—part I: experimental results.J Biomech Eng2000; 122(1): 23–30.
37. Stradins P, Lacis R, Ozolanta I, et al. Comparison of bio-mechanical and structural properties between human aor-tic and pulmonary valve.Eur J Cardiothorac Surg2004; 26(3): 634–639.