Assembly Structural Analysis System
Norihiro Nakajima1, Akemi Nishida2, Hitoshi Matsubara3, Osamu Hazama4, Yoshio Suzuki2, Kazuhiro Sawa5 and Kazuhiko Iigaki6
1
Principal Scientist, Center for Computational Science and e-systems, Japan Atomic Energy Agency, Kashiwa, Japan ([email protected])
2 Senior Scientist, Center for Computational Science and e-systems, Japan Atomic Energy Agency,
Kashiwa, Japan
3 Assistant Professor, Dept. of Civil Engineering, University of the Ryukyus, Okinawa, Japan 4
Engineer, Science & Engineering Systems Division, ITOCHU Techno-Solutions Corp., Tokyo, Japan
5 Principal Scientist, High Temperature engineering Test Reactor, Japan Atomic Energy Agency, Kashiwa,
Japan
6Researcher, High Temperature engineering Test Reactor, Japan Atomic Energy Agency, Kashiwa, Japan
ABSTRACT
Nuclear facilities such as Nuclear power plants have dimensions 100m by 100m by 100m and their structures are an assembly made up of over 10 million components. It is not convenient to
experimentally analyze its behavior under strong loads of earthquakes, since the plant is extremely huge and complex. The proposed system performs numerical simulations to evaluate the behaviors of an assembly like a nuclear facility. This system projects the components of an assembly onto both/either a distributed and/or a parallel computing environment in order to conduct a simulation of the behavior of an assembly such as a nuclear facility. The paper discusses the concept and functions of the system and considers of the effectiveness of the proposed system through some numerical examples. In a result discussion, a numerical experiment was carried out with a cantilever model and its result was compared with theoretical data. A good corresponding among them was obtained as a structural analysis of an assembly by using a parallel computer. As a conclusion, a suggested methodology has shown to calculate a behavior of an assembly with an actual nuclear facility data, High Temperature engineering Test Reactor of Japan Atomic Energy Agency.
INTRODUCTION
Components are mechanically linked to one another in a highly complex manner, and therefore, the interactions of the components due to differences in material properties and their connection conditions considerably affect the behavior of an assembly. In order to properly understand the behavior of an assembly, it is necessary to quantitatively evaluate not just the components but the influence of the interactions among the components of the assembly. A design analysis of a nuclear power plant today usually uses a spring-mass model, which, for instance, replaces the equipments and piping systems with a single mass and connecting each mass with a spring. See, for example, Danisch and Labes (1976). Though a spring-mass model gives a good solution to analyze the macroscopic behavior of an assembly, such as a nuclear power plant, it does not give any consideration to analyze the influences of the interconnections among components in three-dimension. Since their interaction is modeled by a spring, it means that it is well modeled how they are interconnected each other. Generally, there are analytical solutions concerning a large-scale structural analysis based upon finite element method. See, for example, Yoshimura (1997)., Okuda (1997)., Garatani, Nakamura, Okuda, Yagawa, (1999)., and Okuda and Yagawa (2005). High performance computing technology leads a cutting-edge computer like K computer, which realizes over 640,000 parallel computing. See, for example, http://www.aics.riken.jp/en/, and http://jp.fujitsu.com/about/tech/k/. K computer becomes a good partner of these codes of large-scale structural analyses. FIESTA may be distinguished from those codes, since FIESTA treats a problem with the components by components approach. FIESTA does not emphasize its efficiency in computing performance in both/either a parallel and/or a distributed computing. FIESTA focuses to take into account of interaction among components of assembly.
Ultimately, the system is intended to reproduce an assembly, a nuclear facility in the real-world on computers, which is in the digital space. In order to conduct a simulation of a nuclear facility in an actual environment, there is an obvious need for the comprehensive processing of each phenomenon taking place within the plant, including, for example, the structures, fluids, heat, and vibrations. In this paper, however, it is focused on the structural analysis of an assembly, which is the first step in the development of a digital shaking table.
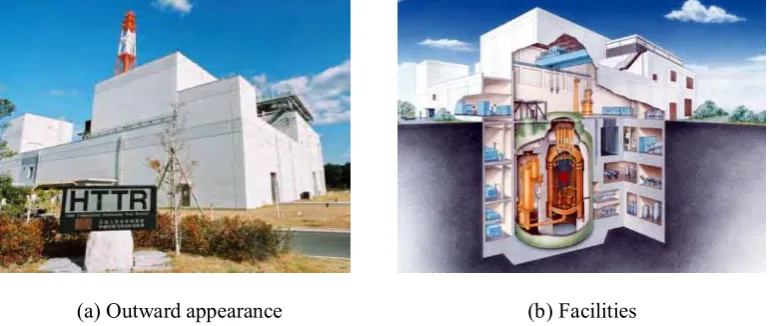
(a) Outward appearance (b) Facilities
Figure 1. An example of nuclear facility, High Temperature engineering Test Reactor (abbr. HTTR).
ASSEMBLY STRUCTURAL ANALYSIS SYSTEM
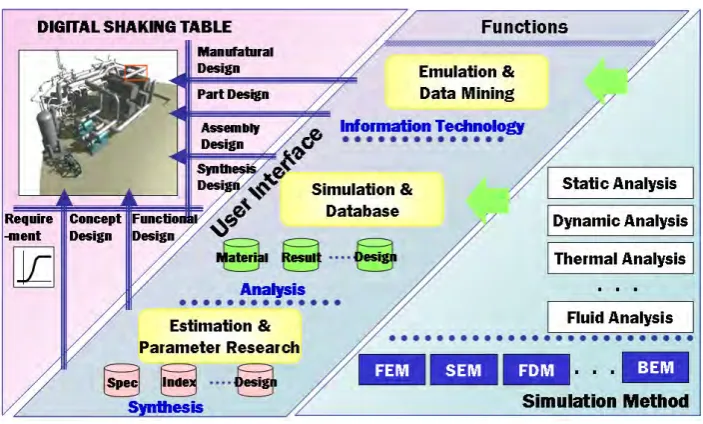
FIESTA as a main function of Assembly Structural Analysis System
element method, boundary element method, distinct element method, spectrum element method and so on. FIESTA is one of functions of ASA, but it is discussed as a main function of ASA in this paper.
Figure 2. Design by ASA : Assembled Structure Analysis System
The methodology in FIESTA, which is intended to obtain solutions for an assembly by linking computations of each component, requests very high performance computing. It is suitable for distributed computing and parallel computing since the nature of method is with the components by components approach. See Nakajima, et al., (2004) and Nishida, et al, (2006).
The components of an assembly and both/either a parallel and/or a distributed computing resemble each other in that both are distributed according to positions (placements, i.e., neighbor components versus neighbor node), geography (location in an assembly versus node in a parallel computer), functions and roles. Thus, components can be classified according to their positions and functions, and then they can be mapped onto nodes/processors of supercomputers that are distributed according to geography of nodes. Interactions among components can be represented by the mutual exchange of energy among the nodes through the network. Since each of the components is defined independently in FIESTA, it should be implementing a method for mutually exchanging energy among components. This problem is solved by employing an existing technique. For example, with the finite element method used to obtain the solutions, we can evaluate a boundary among components by applying an adhesive to the boundary and thus communicating the surface force of the adhered surface to the contacting components. See, for example, Helio, Barbosa, Thomas, Hughes, (1991). Also, it can utilize a method that introduces a spring into a boundary between components and communicate its displacement, as in the penalty method, which is often used in adaptive finite element method and contact analyses. Between components, however, there can be “ambiguous phenomena” that are difficult to represent by any physical theory, since complex physical phenomena such as friction, wearing, corrosion, erosion, slips, etc., as well as influences from human work, may be intertwined with one another and may affect the component boundaries. Thus, in FIESTA, it is crucial to select a method of high flexibility that can represent such “ambiguous phenomena.”
Implementation for components based analysis in distributed modeling
FIESTA employs the finite element method, which is widely used in many fields, with the penalty method, which is used for the connections among components. See, for example, Zienkiewicz and Taylor (2000). Figure 3 shows the data flow of FIESTA. Since FIESTA analyzes an assembly by gathering components, FIESTA, first, requests to create mesh data for a component, which was generated as it is in real space by a 3D geometric modeling system. In this manner, it causes geometrical discontinuity among nodal points among boundaries of components.
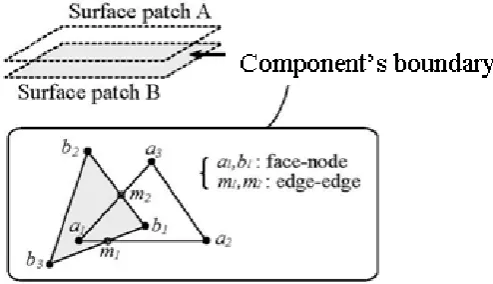
Now, assuming multiple meshes overlap each other as shown in Figure 4, the patterns of inconsistent meshes can be classified into the following two groups:
(1) Type NF: nodes(a1 and b1) on a component’s surface be on the surface of an another component’s (b1-b2-b3 and a1-a2-a3)
(2) Type EE: the line segments on a component surface (line segment a2 and line segment a1-a3) and those on another component surface (line segment b1-b3 and line segment b1-b2) cross each other. (The intersections are m1 and m2).
Next, the domain decomposition of each component mesh is carried out and the system distributes them among the available node. Then, it conducts a finite element analysis by using the information of the mesh and connections of each component. The connections linking one component to another are processed by the penalty method. Now, let us briefly explain this penalty method according to Figure 4. The elements used for this explanation are first-order tetrahedral elements whose displacement field is approximated by a first-order polynomial. The displacement at a connection on a mesh boundary can be represented by the equations below, which employ the shape function of a tetrahedral element. (Here, Node a1 for Type NF, Node m1 for Type EE is considered.)
(1)
(2)
In these two equations, ua1 and um1 denote the displacement vectors at Nodes a1 and m1,
respectively. N indicates the shape function of the element connecting a1 and m1. The lower indices of N
indicate that the corresponding symbol has been substituted by the coordinate value. The relative displacement of a connection node is obtained from Equations (1) and (2) as follows:
(3)
(4)
Figure 3. Data flow in FIESTA.
Figure 4. Components’ boundaries.
A NUMERICAL EXPERIMENT AND RESULTS
Evaluation of accuracy in the static analysis and a structural analysis for an assembly
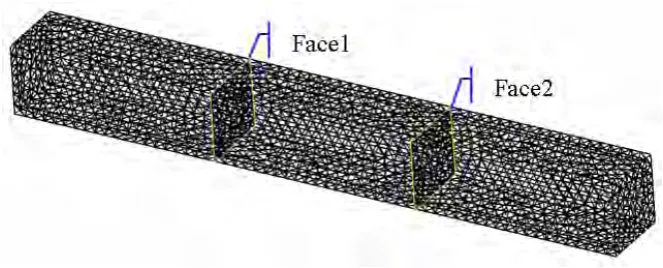
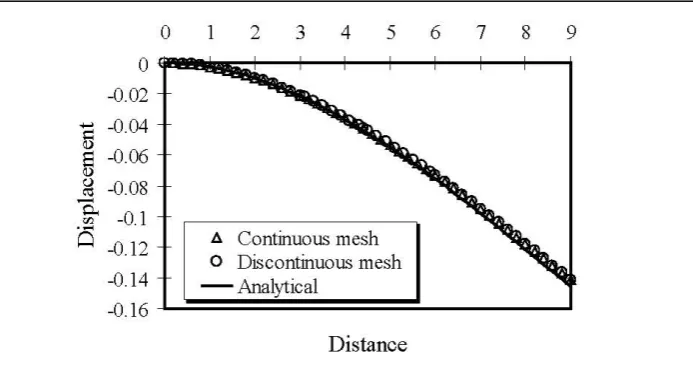
beam. As shown, no discontinuous behavior was found in the solutions obtained using the penalty method compared to the behavior in the theoretical solutions, even though the penalty method solutions do have discontinuous planes (Faces 1 and 2 in Figure 5). Also, compared with the continuous mesh model, it is reconfirmed that the tested model resulted in completely equivalent continuous behavior. Therefore, the penalty method implemented in FIESTA is effective way to apply for the structural analysis of an assembly.
Figure 5. A cantilever beam for components’ boundary deflection.
(a) Continuous meshed model of a cantilever beam.
(b) Discontinuous meshed model of a cantilever beam.
Figure 7. Numerical result in deflection of a cantilever beam.
Next, to confirm how well the penalty method can handle an assembly problem, it is tested its parallel performance using SGI Altix 3700. See, for example, http://www.sgi.com/, and http://www.sgi.co.jp/.
Table 1 shows the result of their performance. Compared with the case of 128 CPUs, the parallelization efficiency decreased by 1.6% for 256 CPUs, and by 24.6% for 512 CPUs. With the finite element method employed in FIESTA, as more CPUs are used, the more domain decompositions there are inside parts, it inevitably results in longer communication times at the boundaries. See, for example, Wang, Kim, Zhang, Nakajima, and Okuda, (2003). Therefore, when a single model of analysis is employed, the parallelization efficiency generally decreases in this manner. Meanwhile, the execution efficiency changes almost linearly. This suggests the possibility that our system can function well with an increased number of parts. This experiment may say that the parallelization implementation in FIESTA is effective enough for computations.
Table 1: Performance of FIESTA in parallelization.
Number of CPUs CPU time (sec)
Parallel efficiency (%)
Execution efficiency
(%)
1 128 5604.4 100 33.2
2 256 2923.8 98.4 61.5
3 512 2004.8 75.4 94.5
Simulation of a nuclear facility
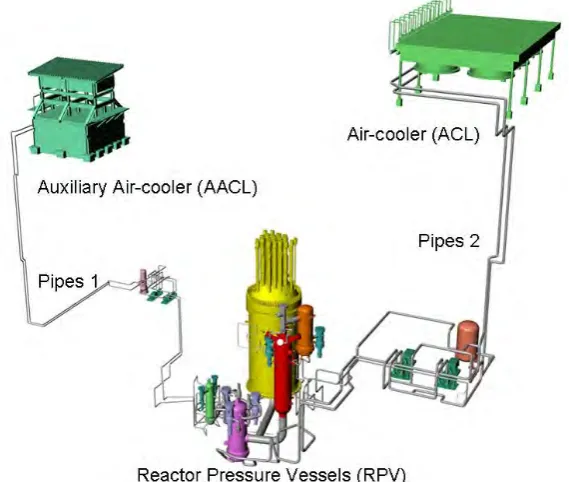
This section presents a numerical experiment of FIESTA applying to a vibration analysis for an assembly, HTTR. See Ogawa and Nishihara, (2004). The HTTR is an experimental reactor of a nuclear facility installed at the Japan Atomic Energy Agency. Figure 8 shows the analysis model, and Table 2 shows the numbers of nodes and elements of the finite element model of each component. The vibration conditions for this analysis replicated the El Centro earthquake that attacked California, U.S.A. in 1940. This analysis considered the HTTR components listed below as well as the pipes connecting them, but did not consider any internal structure of each major component such as reactor pressure Vessels:
(1) Reactor Pressure Vessels (RPV) (2) Air-cooler (ACL)
In this study, the data for each component of data (Geometric models, finite element models, material property, etc.) were managed on the web system, as shown in Figure 9. This web manager is capable of distributing the parts data to both/either a parallel and/or a distributing computing system. This web manager is a part of database in a FIESTA’s components’ data for both input and output. Figure 10 (a) shows the visualization results of the entire domain, and Figure 10 (b) shows the vibration in the RPV section. The colors indicate the degree of deformation. The larger the deformation, the greater the color change from blue to green. Although the result discussion is stayed in qualitative, it was verified from Figure 10 (b) how deformation spreads from the lower section of the nuclear reactor to its upper section over time. It has to admit that this analysis does not validate with physically correct solutions, since it ignores the internal structure of the components. However, the success of the numerical test using FIESTA indicates that now we have greater possibilities of conducting simulations covering the assembly, such as a nuclear facility. The visualization of Figure 9 is carried out in a large-scale visualization environment that supports post-processing in a parallel distributed environment (AVS/Express PST: AVS/Express Parallel Support Toolkit). See Suzuki, Sai, Matsumoto, and Hazama, (2003). JAEA has originally developed “Parallel Support Toolkit” to visualize a vast scaled simulation’s result by parallel computers.
Figure 8. A simulation model, HTTR(igh Temperature Engineering Test Reactor) for FIESTA.
Table 2: Numbers of finite element model in HTTR.
Components Number of Nodes Number of Elements
RPV 26,047,774 12,713,831
ACL 13,810,729 63,079,845
AACL 3,364,149 14,962,732
Pipes1 3,396,149 12,137,915
Pipes2 1,830,427 7,331,618
Figure 9. Visualization of parts on web-based data manager.
(a) All major components. (b) Simulation results.
Figure 10. Response analysis by FIESTA.
CONCLUSION
of Japan Atomic Energy Agency) was carried out, and was successfully executed to obtain numerical results for the assembly of the nuclear facility. This system employs the penalty method instead of implementing models of the interaction among components in this paper. The simulation might have shown behaviors of the connecting sections that are different from actual behaviors, since it was not taking into account of the inside components of each major facility of HTTR. In the future work, it is planned to introduce new connection models in FIESTA in order to clarify how an assembly behaves in a real environment. Ultimately, to reproduce a real-world in the digital space, it is planned to extend FIESTA to K computer system.
REFERENCES
Danisch, R. and Labes, M. (1976). “A seismic design of turbine houses for nuclear power plants, Nuclear Engineering and Design, 38, 495-501.
Darlaston, B. J. and Gardner, W. E. (1987). “Advances in PWR Structural Integrity Assessment and Materials Technology in THE UNITED KINGDOM,” Nuclear Engineering and Design, 102,
419-430.
Garatani, K., Nakamura, H., Okuda, H. and Yagawa, G., (1999.). “GeoFEM: High Performance Parallel FEM for Solid Earth,” High-Performance Computing and Networking, HPCN Europe 1999,
Lecture Notes in Computer Science, 1593, 133-140,
Helio, Barbosa, J. C., Thomas, Hughes, J. R., (1991). “The finite element method with Lagrange multipliers on the boundary: circumventing the Babuska-Brezzi condition,” Comput. Methods Appl. Mech. Engrg., 85, 109-128.
Shiozawa, S., Fujikawa, S., Iyoku, T., Kunitomi, K. and Tachibana, Y. (2004). “Overview of HTTR design features,” Nuclear Engineering and Design, 233, 11-21.
Suzuki, Y., Sai, K., Matsumoto, N. and Hazama, O., (2003). “Visualization System on Information Technology Based Laboratory, IEEE Computer Graphic and Applications, 23, 23-39.
Nakajima, N., et al., (2004). “Towards to realize a Quake –proof Information Control and
Management System for Nuclear Power Plant,” Proceedings of 23rd the Japan Society for Simulation Technology, Tokyo, 117-120
Nishida, A. et al., (2006). “Numerical Simulation System “Three-Dimensional Virtual Vibration Testbed” for Nuclear Power Plants by Using Assembled Structural Analysis,” Trans. Atomic Energy Society Japan, 6(3), 376-382
Ogawa, M. and Nishihara, T., (2004). “Present status of energy in Japan and HTTR project,” Nuclear Engineering and Dsesign, 23, 35-10.
Okuda, H., (1997). “Proceedings of 1st ADVENTURE / GeoFEM Joint Seminar,” ADV-97-1
Okuda, H. and Yagawa, G., (2005). “Large-Scale Parallel Finite Element Analysis for Solid Earth Problems by GeoFEM,” Surveys on Mathematics for Industry, 11, 159-196
Tani, M., Nakajima, N., Nishida, A., Suzuki, Y., Matsubara, H., Araya, F., Kushida, N., Hazama, O., Kondoh, M., and Kawasaki, K., (2007). "A methodology of structural analysis for nuclear power plant size of assembly", Proc. of M&C + SNA 2007(CD-ROM) , American Nuclear Society, 1-13
Timoshenko, S.P., and Goodier, J.N., (1987). Theory of Elasticity, McGraw-Hill,
Yoshimura, S., (1997). “Proceedings of 1st ADVENTURE / GeoFEM Joint Seminar,” ADV-97-1
Wang, K., Kim, S. B., Zhang, J., Nakajima, K. and Okuda, H., (2003). “Global and localized parallel preconditioning techniques for large scale solid Earth simulations,” Future Generation Computer Systems, 19, 443-456.
Zienkiewicz, O.C. and Taylor, R. L. (2000). The finite element method, 5th ed., Butterworth Heinemann http://www.aics.riken.jp/en/
http://www.sgi.co.jp/ http://www.sgi.com/