15
RIGOROUS APPROCAH IN InDA SOFTWARE SYSTEM
FOR DEFORMATION DETECTION - CASE STUDY ON
THE SMALL ENGINEERING STRUCTURE
Khairulnizam M Idris and HalimSetan
UTM-Photogrammetry and Laser Scanning Research Group
Department of Geomatic Engineering, Faculty of Geoinformation and Real Estate UniversitiTeknologi Malaysia
ABSTRACT
One of the main tasks in deformation monitoring is to investigate the movement or displacement that occurred to any structural object. The measuring techniques and the instruments used for such monitoring are categorized as geodetic and non-geodetic (i.e., geotechnical/structural) methods. A monitoring survey has been conducted in a laboratory to detect the deformation of a light weight concrete block which undergoes load testing. A number of target points on one surface of the concrete block have been monitored by triangulation survey using a total station. Five epochs of measurement have been obtained and each epoch was based on the load applied ranging from 0kN up to 358kN. Results from such testing indicate the practicality of the InDA Software System in deformation detection.
Keyword: Concrete block, network adjustment, deformation detection, displacement vector
1.0
INTRODUCTION
In general, the deformation measurement methods can be divided into two categories namely the geodetic and non-geodetic. The geodetic method of deformation monitoring of any structural object involves determining the coordinates difference of object points measured from a reference network. The non-geodetic method employs specialized instrumentation normally used by the geotechnical and structural engineers (Chrzanowskiet al., 1986; USACE, 2002; Szostak-Chrzanowski and Chrzanowski, 2008). The geodetic method is very useful in giving a global deformation picture of deformation. While the non-geodetic method is provide measurement data at point where locality is not a problem.
The main aim of geodetic deformations analysis includes (Chrzanowski and Szostak-Chrzanowski, 1995; Szostak-Chrzanowskiet al., 2005):
i. Geometrical analysis, which describe the geometrical status of deformable object, change in shape and dimensions (rigid body movement) of whole deformable object with respect to a stable reference frame.
ii. physical interpretation which describe the state of internal stresses and the relationship between the causative factors and deformations.
16
Nowadays, there are many rigorous approaches for deformation analysis via geodetic method. All these method has been proven for its applicability for example, congruency testing (Caspary and Borruta, 1987; Halim, 1995; 1997; Ranjit, 1999; Caspary, 2000) and Iterative Weighted Similarity Transformation (IWST) (Chen, 1983; Kuang, 1996; Szostak –Chrzanowski and Chrzanowski, 2008)
Recently, a deformation measurement has been conducted to a concrete block in conjunction with axial compression. The objective of the axial compression test is to find the strength of the concrete block in term of their load. In this axial compression test, strengthen of the concrete block measured using non-geodetic devices such as strain-gauge and linear displacement variable transform (LVDT). The result of non-geodetic is shows in term of strain –stress relationship (MokhtazulHaizad, 2003). The geodetic method was supported in this test is to calculate and visualize the displacement vector of the concrete block on each selected load. Visualization of the displacement vector is critical due to check the concrete block movement from the initial load until the block cracked.
This paper discusses the observation procedure in gathering the spatial information and the analysis of the concrete block with geometrical deformation. The study was supported by InDA software system (Khairulnizam&Halim, 2008; 2009) for data processing and analysis.
2.0 SOURCE OF DEFORMATION DATA – GEODETIC METHOD
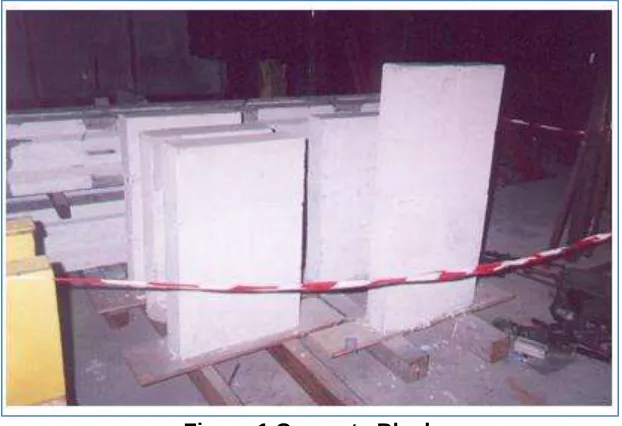
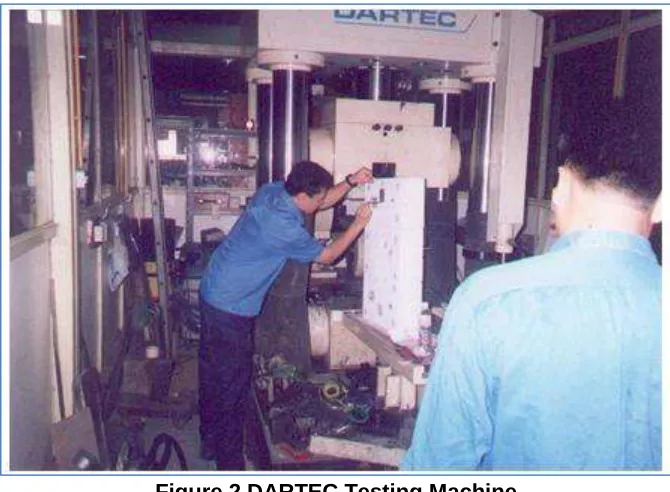
The concrete block (Figure 1) used in this study has undergone an axial compression testing to determine its axial strength (MokhtazulHaizad, 2003). The axial compression experiment was performed by employing DARTEC testing machine (Figure 2). An incremental series of loads in kiloNewton (kN) standard were utilized in the testing ranging from 0, 200, 258 300 and 375 kN respectively.
17
Figure 2 DARTEC Testing Machine
The geodetic method of deformation measurement was carried out from a small survey network established within the laboratory (Figure 3). A number of object points were identified and marked with retro-tape target and glued on one side of the concrete block (Figure 4). The survey method utilized a conventional 2D measurements consist of bearing and distance observed using Total Station. A total of five epoch of measurements were observed and each epoch was identified based on the load utilized during the testing (i.e., 0kN, 200kN up to 375kN).
18
Figure 4 Distribution of object points on the concrete block
3.0
MATHEMATICAL FORMULATION
To process the deformation of the concrete block from geodetic observables, suggested two-epoch analysis used in this study. In practice, two-two-epoch analysis consisting of independent least square estimation (LSE) of a single epoch and geometrical detection of deformation between epochs (Halim, 1997).
3.1
NETWORK LEAST SQUARE ESTIMATION
The measured data (e.g., directions and distances) are being related to the parameter (coordinates) by mathematical relationship called the functional model and expressed as (Mikhail, 1975; Cross, 1985; Caspary, 2000; Ghilani and Wolf, 2005):
[1]
where,
l is the vector of observations and
x is the vector of parameter to be estimated.
Equation [1] generally is non-linear and it needs to be linearized using Taylor’s theorem whereby the observation equation is written as:
̂ ̂ [2]
where,
v
ˆ
is the vector of residuals,A is the design matrix,
x
ˆ
is the vector of corrections to the approximate value andb is the misclosure vector.
The normal equation with a full rank can be written as:
̂ [3]
and solution for ̂:
̂ [4]
where,
19
In general, least square estimation suffers from rank deficiency due to configuration or datum defect (Halim, 1997). As a solution, datum defect are overcome by means of constraints. Normally, the common choices of datum for the monitoring network are minimum constraint, minimum trace and partial minimum trace. In this particular work, the method of minimum constraint was chosen as datum definition.
3.2
GEOMETRICAL DEFORMATION DETECTION
The deformation detection required in this work was carried out by employing the Iterative Weighted Similarity Transformation (IWST) (Chen, 1983). To estimate the trend of the displacement vector, IWST is based on S-transformation as below (Chen, 1983; Kuang, 1996; USACE, 2002):
[ ( ) ] [5]
where,
is the number of iterations
d is a displacement vector between estimated coordinate of all common points in the first epoch ̂ and second epoch ̂ ,
̂ ̂ is a S-transformation matrix [6]
is a weight matrix (with diagonal value of one for datum points and zero elsewhere).
[ 20 0 0
0 2 0 1 0 1 0 0 0 2 0 2 0 1 0 1
.
.
1
0
.
1
0
1
0
0
1
.
0
1
0
1
m m m my
x
y
x
y
x
x
y
x
y
x
y
]
is an inner constraint matrix [7]
S-transformation (similarity transformation) or Helmert transformation is a useful tool in transforming the displacement vector (equation [6]) and its cofactor matrix. Computation of transforming the cofactor matrix is show as below (Halim, 1995):
̂ ̂ [8]
The main step in robust method is a forming the weight matrix, . In the firt transformation
the weight matrix is taken as identity for all common points. Then in the
transformation the weight matrix is defined as (Chen, 1983; Kuang, 1996): {
| |} [9]
Equation [9] is only applied on the common datum point. For example, either the reference point for a reference network or a group of point in a stable block for a relative network. Then, for object or non-datum points the weight is set as zero . The iteration process continues until the absolute difference between the successive transformed displacements of all common points | | are smaller than a tolerance value.
4.0
InDA Software System
20
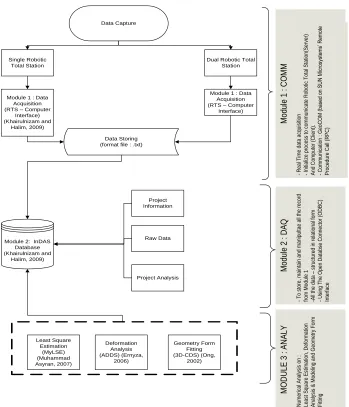
and on-site/off-line computation of geometrical form fitting and deformation analysis on the engineering or industrial structures. InDA software system consists three main modules, namely COMM, DAQ and ANALY as shown in Figure 5. The software system is written using Microsoft Visual C++ for COMM, DAQ and ANALYmodules, whilst Microsoft Visual Basic 6 for component embedded in ANALY module.
Data Capture
Single Robotic Total Station
Dual Robotic Total Station
Module 1 : Data Acquisition (RTS – Computer
Interface) (Khairulnizam and
Halim, 2009)
Module 1 : Data Acquisition (RTS – Computer
Interface)
Module 2: InDAS Database (Khairulnizam and
Halim, 2009)
Data Storing (format file : .txt)
Project Information Raw Data Project Analysis Least Square Estimation (MyLSE) (Muhammad Asyran, 2007) Deformation Analysis (ADDS) (Ernyza, 2006) Geometry Form Fitting (3D-CDS) (Ong, 2002) Module1 Module2 Module3 M o d u le 1 : C O M M - R e a l T im e d a ta a cq u is iti o n - In iti a liz e p ro ce ss t o c o m m u n ic a te R o b o tic T o ta l S ta tio n (S e rv e r) A n d C o m p u te r (C lie n t) . - C o m m u n ic a tio n : G e o C O M ( ba se d on S U N M ic ro sy st em s’ R em ot e P ro ce d u re C a ll (R P C ) M o d u le 2 : D A Q - T o s to re , m a in ta in a n d m a n ip u lta e a ll th e r e co rd fr o m M o d u le 1 -A ll th e d a ta – s tr u ct u re d in r e la tio n a l f o rm - U si n g T h e O p e n D a ta b se C o n n e ct o r (O D B C ) In te rf a ce M O D U L E 3 : A N A L Y N u m e ri ca l A n a ly si s o n : L e a st S q u a re E st im a tio n , D e fo rm a tio n A n a ly si s & M o d e lin g a n d G e o m e tr y F o rm F itt in g
Figure 5 Configuration of InDA software systems.
21
5.0
GEOMETRICAL INTERPRETATION OF CONCRETE BLOCK DEFORMATION
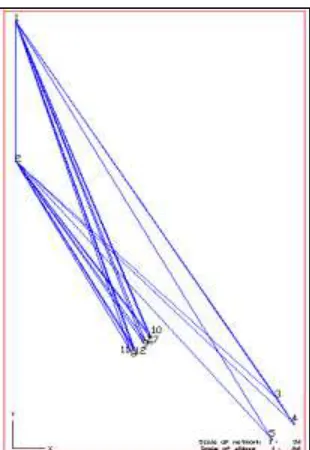
The observations campaign on the concrete block began with an epoch 1, where the concrete block are not subject to any charges or load and set as 0kN (kiloNewton). Then for next epochs, the concrete block were observed with regard to some phase of load is required as 200kN, 258kN, 300kN and 375kN. Rational in the selection phase of the load to be observed is to meet the objectives which the determination of concrete block in a vertical direction during the axial compression test is required by the engineer.Figure 6 Monitoring network of concrete block
Thus, the monitoring network consists of 13 points (5 reference points (1,2,3,4 and 5) and 7 object points (6,7,8,9,10,11 and 12)) and composed of five epoch of observations. The monitoring network of concrete block is shown in Figure 6. Each measurement epoch consists of 22 directions and 15 horizontal distances. The summary of the least squares adjustment details are given in Table 1.
Table 1 Least squares estimation output
0kN 200kN 258kN 300kN 375kN
Datum Definition
Datum Defect 2 2 2 2 2
No of Observation 37 37 37 37 37
No of Degree of Freedom
15 15 15 15 15
No of Iteration 2 3 3 3 3
Variance a Posteriori 0.4357 0.4577 0.3842 0.5513 0.4747
Global Test 0.238<1<1.04
4
0.250<1<.09 6
0.210<1<0.92 0
0.301<1<1.32 1
0.259<1<1.13 7
22
For additional, 375kN load imposed on the concrete blocks in visual attention that there are significant or substantial cracks on the object. Further, studies on the deformation of concrete blocks with the observations set at no load (0kN) as a reference epoch. Thus, other expenses compared to the reference epoch, such as forming joint 0kN vs. 200kN, 0kN vs. 258kN, 0kN vs. 300kN and 0kN vs. 375kN.
Significant level for deformation analysis was chosen as 0.05. The tolerance value was taken as 0.0001meter. The IWST method converged at the fourth iteration and verified points 6 to 12 as moved since load of 200kN. The result of IWST processing is scheduled in Table 2.
Table 2 IWST test result on each load combination
0kN & 200KN 0kN & 258kN 0kN & 300kN 0kN & 375kN
Pooled
Variance Factor
0.4467 0.41 0.4935 0.4552
Variance Ratio Test
1.050<2.405 1.1.34<.405 1.265<2.405 1.089<2.405
Stable Points 1,2,3,4,5 1,2,3,4,5 1,2,3,4,5 1,2,3,4,5 Moved Points 6,7,8,9,10,11,12 6,7,8,9,10,11,12 6,7,8,9,10,11,12 6,7,8,9,10,11,12
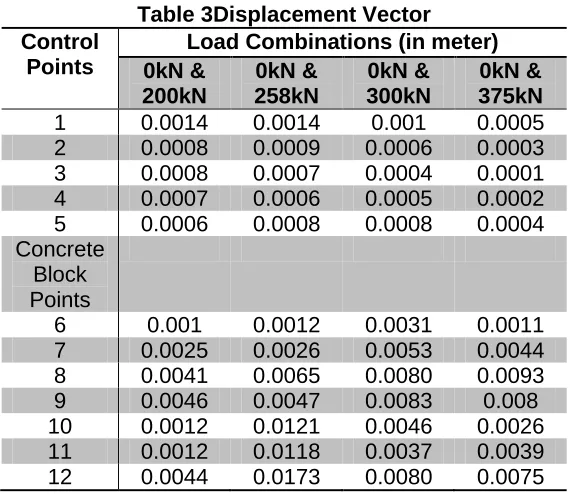
The result of displacement vector as shown in Table 3 reflect the occurrence of a significant movement in the concrete blocks from the load 0kN vs. 258kN, about 1cm at points 10, 11 and 12. Then, the displacement vector decreases and consistence, between 3mm to 9mm when load of 0kN vs. 300kN and 0kN vs. 375kN.Figure 7 shows the failure or cracking of the surface of concrete block at load 0kN vs. 258kN and Figure 8 shows the displacement vector for each load combinations.
Table 3Displacement Vector Control
Points
Load Combinations (in meter) 0kN &
200kN
0kN & 258kN
0kN & 300kN
0kN & 375kN
1 0.0014 0.0014 0.001 0.0005 2 0.0008 0.0009 0.0006 0.0003 3 0.0008 0.0007 0.0004 0.0001 4 0.0007 0.0006 0.0005 0.0002 5 0.0006 0.0008 0.0008 0.0004 Concrete
Block Points
23
Figure 7 Cracking of the concrete block (at load 0kN vs. 258kN)
24
6.0
CONCLUSION
The software system is a fully automated in data acquisition. For data processing and analysis, user still able to process and calculated the final result at field or “on-site solution”. The ability of surveyors to provide other profession such as civil engineer, a graphical presentation of displacement vector of the monitoring object is very meaningful. For example, results of this particular monitoring works (Figure 9) were given to civil engineering colleagues. Such results will then enable them to visualize the movement trend of the lightweight concrete block which undergone the axial compression testing.
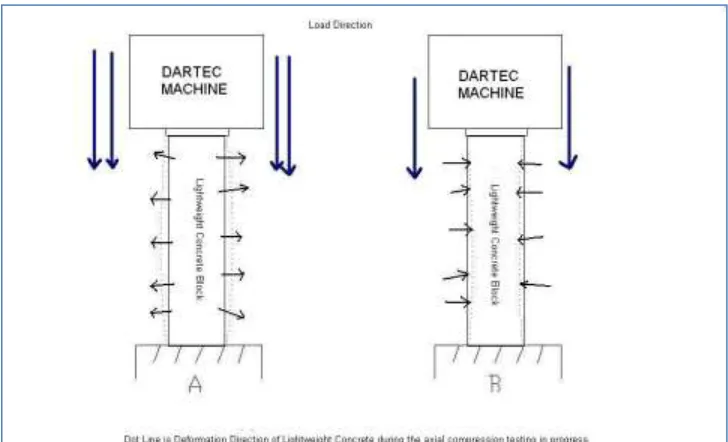
Theoretically, due to axial compression the lightweight concrete will expand in the way shown graphically in Figure 10 (picture A). On the other hand, if the movement of the concrete block occurs as in picture B it implies that either the geodetic monitoring results was wrong, or there could be wrong designing of the concrete block or mislaid the concrete block on the DARTEC machine are questionable. Therefore, the results obtained in this work are agreed to what is expected.
Figure 9: Displacement vector of object points on the concrete block (0kN vs. 375kN)
Figure 10: Direction of concrete block during the test
ACKNOWLEDGEMENT
25
REFERENCES
Caspary. W. F. (2000). Concept of Network and Deformation Analysis.Monograph 11, School of Surveying. The University New South Wales. Monograph 11.
Caspary, W. F. and Borruta, H. (1987). Robust Estimation in Deformation Models. Survey Review. 29(223). 29-45.
Chen, Y. Q. (1983). Analysis of Deformation Surveys – A Generalized Method. Technical Report No. 94. Department of Surveying Engineering, University New Brunswick.
Chrzanowski, A., Chen, Y.Q. & Secord, J.M (1986). Geometrical Analysis of Deformation Surveys. Proceedings Deformation Measurement Workshop. Oct. 31 – Nov. 1, Ed. by Yehuda
Bock. Massachusetts Institute of Technology, Boston. 170 – 206.
Chrzanowski, A. &Szostak-Chrzanowski, A. (1995). Identification of Dam Deformation Mechanism.Proceedings of International Conference of the Malaysian Water Association on Dam Engineering, 1-2 August. Kuala Lumpur. 179-187.
Cross, P. A. (1985). Working Paper No. 6 Advanced Least Squares Applied to Position-Fixing. Department of Land Surveying, North East London Polytechnic. 205 pages
Ernyza Endot (2007). Pembangunan Perisian Analisis Deformasi Multidimensi Dengan Menggunakan Kaedah Iterative Weighted Similarity Transformation. MSc Thesis. Universiti Teknologi Malaysia, Skudai. 126 pages.
Ghilani, C. D. and Wolf, P. R. (2006). Adjustment Computation Spatial Data Analysis. John Wiley & Sons, New Jersey. 612 pages.
Halim Setan (1995). Functional and Stochastic Models for Geometrical Detection of Deformation In Engineering: A Practical Approach. PhD Thesis.City University, London. 261 pages.
Halim Setan (1997). A Flexible Analysis Procedure for Geometrical Detection of Spatial Deformation.Photogrammetric Record. 15(90). 841-861.
Khairulnizam M Idris and HalimSetan (2008). Precise Dimensional Measurement of a Helicopter Model using Geodetic and Non-Contact Measurement Technique [CD-ROM]. Proceedings of International Symposium and Exhibition on Geoinformation. 13-15 Oct. Putra World Trade Center. Kuala Lumpur.
Khairulnizam M Idris and Halim Setan (2009). Communication and Database Modules for Automatic Data Acquisition. Geoinformation Science Journal. 9(1). 1-10.
Kuang, S. (1996). Geodetic Network Analysis and Optimal Design: Concepts and Applications. Ann Arbor Press Inc, Michigan. 368 pages.
26
Mokhtazul Haizad Mokhtaram (2003). Kekuatan Blok Konkrit Ringan Berudara Yang Mengandungi Klinker Kelapa Sawit Hancur. MSc Thesis. Universiti Teknologi Malaysia, Skudai,
Muhammad AsyranCheAmat (2008). ImplementasiPengoptimuman Komputer dalam Pembangunan Perisian Analisis Pelarasan Kuasa Dua Terkecil. MSc Thesis, Universiti Teknologi Malaysia, Skudai. 201 pages.
Ong Bong Sheng (2002). Pembangunan Perisian Bagi Penentuan Koordinat dan Rekabentu k Geometri Untuk Ukur Industri. MSc Thesis. Universiti Teknologi Malaysia, Skudai. 237 pages.
Ranjit Singh (1999). Pelarasan dan Analisis Jaringan Pengawasan Untuk Pengesanan Deformasi Secara Geometri. MSc Thesis. Universiti Teknologi Malaysia, Skudai. 261 pages.
Szostak-Chrzanowski, A. and Chrzanowski, A. (2008). Interdisciplinary Approach to Monitoring, Analysis and Modeling of Deformations. Journal of Polish Agricultural Universities. 11(2). 1/7-7/7.
Szostak-Chrzanowski, A., Chrzanowski, A. and Massiera, M. (2005).Use of Deformation Monitoring Result in Solving Geomechanical Problems – Case Studies. Engineering Geology.
79(2005). 3-12.
USACE (2002). Engineering and Design Structural Deformation Surveying.US Army Corps of Engineer, Washington. 292 pages.
AUTHORS
27