ABSTRACT
WAGHELA, RAJMOHAN. Characterization of Aerodynamic Sails Designed For Guiding High-Altitude Balloons. (Under the direction of Dr. Ashok Gopalarathnam.)
Scientific high-altitude ballooning has been an important platform for astrophysicists and earth scientists for observations and measurements. High-altitude balloons have evolved over
time to increase payload and mission endurance. A further boost in capabilities can be achieved
with the ability to guide high-altitude balloons. An aerodynamic sail is a wing-tail aerodynamic structures that is attached to the balloon with a long tether. The atmospheric wind gradients
create a relative wind with respect to the sail which can be used to generate aerodynamic
forces to guide a high-altitude balloon in the desired direction. The focus of this study was to characterize the aerodynamic sail. A scale analysis of the acceleration of the balloon showed that
Coriolis, tangential, and centripetal accelerations may be ignored for instantaneous analyses.
Further, the balloon-sail system was decoupled owing to the large difference in their masses. This simplification allowed for closed-form expressions for maximum sail guidance force and
static pitch stability. The maximum sail guidance force depended on the mass of the sail and
a ratio of spanwise locations of center of mass and center of lift. The static stability criterion relates the location of center of mass, neutral point, and tether location with an inequality.
Next, a fully non-linear equilibrium solution for the sail was developed to determine the key
variables for the design of aerodynamic sails. This solution assumed a mass-less tether and a linear variation of wind with altitude. Using this solution, parametric analyses were conducted.
The metric of performance was the velocity of the balloon due to the sail perpendicular to
the winds surrounding the balloon. The analysis showed that induced drag adversely affects performance by increasing the angle of attack required to achieve a given performance. The
location of tether attachment changes the trim configuration by altering the elevator deflection
required to trim. The resulting change in drag can have a marginal effect on the performance at high coefficients of lift. The mass of the sail and wing area are directly related. The analysis
showed that a sail design is not only sensitive to the mass-to-area ratio but to the extent of the
those parameters as well. Both larger mass and larger area are required to improve performance but with only diminishing returns. Finally, the spanwise location of center of mass can have a
©Copyright 2015 by Rajmohan Waghela
Characterization of Aerodynamic Sails Designed For Guiding High-Altitude Balloons
by
Rajmohan Waghela
A thesis submitted to the Graduate Faculty of North Carolina State University
in partial fulfillment of the requirements for the Degree of
Master of Science
Aerospace Engineering
Raleigh, North Carolina
2015
APPROVED BY:
Dr. Andre Mazzoleni Dr. Matthew Bryant
DEDICATION
ACKNOWLEDGEMENTS
To my good fortune, I have constantly received support and encouragement from friends, family, and faculty.
Foremost, I would like to thank Dr. Ashok Gopalarathnam who has been supportive from the moment I applied to North Carolina State University and has supported me throughout
the program. With Dr. Gopalarathnam’s blessings, I was awarded teaching assistantship from
my first semester in the master’s program and was able to continue for the duration of the program.
I am also grateful to Dr. Mazzoleni and Dr. Bryant for serving as my advisory committee
members.
A special word of thanks to the director of undergraduate laboratories, Dr. James David
Kribs, for entertaining my “shenanigans” with the wind tunnel labs. A special word of thanks to
all my lab mates - Aditya Saini, Pranav Hosangadi, Yoshikazu Hirato (Yoshi), Dr. Ryan Paul, and Shreyas Narsipur. All of whom have positively contributed to my success. A special word
of thanks to all my students in the wind tunnels labs for humoring my proclivities. A special
word of thanks to meteorologist, Marc Collins, for providing valuable advice on modeling of the atmosphere, which probably saved me hours of work and many sleepless nights. A special word
of thanks to Sabita, Akhilesh, and Anushree Nair who have made me feel at home in Raleigh
TABLE OF CONTENTS
LIST OF TABLES . . . vi
LIST OF FIGURES . . . vii
Chapter 1 Introduction . . . 1
1.1 Background . . . 1
1.2 Research Objectives . . . 6
1.3 Thesis Outline . . . 6
Chapter 2 Acceleration Scale Analysis . . . 7
2.1 Simplifying The Expression For Acceleration . . . 7
2.2 Calculating Acceleration Expression . . . 8
2.3 Approximating Orders of Magnitude . . . 10
2.4 Comparing Acceleration Terms . . . 14
2.5 Summary . . . 15
Chapter 3 Sail Characterization. . . 16
3.1 Sail Performance Analysis . . . 16
3.2 Sail Stability Analysis . . . 19
3.3 Summary . . . 23
Chapter 4 Balloon-Sail Equilibrium Solution . . . 25
4.1 Frames Of Reference . . . 26
4.2 Standard Atmospheric Model . . . 27
4.3 Balloon Force And Moment Equations . . . 28
4.4 Sail Force And Moment Equations . . . 32
4.5 Equilibrium Conditions . . . 36
4.6 Constraint Equations . . . 37
4.7 Unknowns Variables, System Parameters and Inputs . . . 42
4.8 Solution Methodology . . . 47
4.9 Limitations of Equilibrium Solution . . . 49
4.10 Summary . . . 49
Chapter 5 Balloon-Sail System Parametric Analyses . . . 51
5.1 Reference System Parameters . . . 51
5.2 Metric Of Performance . . . 53
5.3 Aerodynamic Drag . . . 54
5.4 Tether Location . . . 60
5.5 Mass and Wing Area . . . 61
5.6 Spanwise Center Of Mass Position . . . 69
5.7 Summary . . . 71
LIST OF TABLES
Table 2.1 Approximate Orders of Magnitude . . . 14
Table 4.1 Table Of Unknown Variables . . . 43
Table 4.2 Table Of System Parameters . . . 45
Table 4.3 Table Of System Parameters . . . 47
LIST OF FIGURES
Figure 1.1 Evolution Of Balloon Design[1] . . . 3
Figure 1.2 NASA’s≈200,000m3 ULDB Over Antarctica [2] . . . . 4
Figure 1.3 Balloon With Aerodynamic Sail (Not To Scale) [3] . . . 5
Figure 2.1 Inertial(O) Frame and Balloon-Body(B) Frame . . . 8
Figure 2.2 Balloon Acceleration Due Force . . . 11
Figure 2.3 Balloon Acceleration Due To Relative Wind . . . 13
Figure 3.1 Equilibrium Sail Free-Body Diagram . . . 17
Figure 3.2 Examples of Positive (Top), Neutral (Middle), and Negative (Bottom) Static Stability . . . 20
Figure 3.3 Equilibrium Sail Free-Body Diagram . . . 21
Figure 4.1 U.S. Standard Atmosphere 1976 [4] . . . 29
Figure 4.2 Change Coefficient of Drag due to Reynolds Number [5] . . . 31
Figure 4.3 Sail Relative Wind Angle . . . 39
Figure 4.4 Sample Zonal Wind Profiles [6] . . . 41
Figure 4.5 Solution Methodology . . . 48
Figure 5.1 Sail Geometric Definition . . . 52
Figure 5.2 Effect of Aspect Ratio on Lift Curve Slope . . . 55
Figure 5.3 Effect of Aspect Ratio on Drag Coefficient . . . 55
Figure 5.4 Effect of Aspect Ratio on Equilibrium Altitude . . . 56
Figure 5.5 Effect of Aspect Ratio on Elevator Deflection . . . 57
Figure 5.6 Effect of Aspect Ratio on Dynamic Pressure . . . 57
Figure 5.7 Effect of Aspect Ratio on |Txo| . . . 58
Figure 5.8 Effect of Aspect Ratio on |Tzo| . . . 58
Figure 5.9 Balloon Relative Wind Velocity Along ˆio . . . 59
Figure 5.10 Balloon Relative Wind Velocity Along ˆko . . . 60
Figure 5.11 Elevator Deflection Required To Trim With Different Tether Locations . . . 61
Figure 5.12 Balloon Relative Wind Velocity Along ˆio For Different Tether Locations . . . 62
Figure 5.13 Balloon Relative Wind Velocity Along ˆko For Different Tether Locations . . . 62
Figure 5.14 Ratio Of Spanwise Location Of Center Of Mass With Spanwise Center of Lift For Different Tether Locations . . . 63
Figure 5.15 Helios Prototype [7] . . . 64
Figure 5.16 Equilibrium Altitude of Corner Sail Configurations . . . 65
Figure 5.17 Equilibrium Dynamic Pressure of Corner Sail Configurations . . . 65
Figure 5.18 Equilibrium Rotation Angle,θx, of Corner Sail Configurations . . . 66
Figure 5.19 Guidance Force Tzo of Corner Sail Configurations . . . 66
Figure 5.21 Guidance Force Component Tzo For Various Mass and Wing Area When
Wind Velocity Difference Between 35,000 and 20,000 km Altitude is 20 m/s and CLmax is 1.0 . . . 68
Figure 5.22 Balloon Relative Wind Velocity Component VBLN−Relzo For Various Mass
and Wing Area When Wind Velocity Difference Between 35,000 and 20,000 km Altitude is 20 m/s and CLmax is 1.0 . . . 68
Figure 5.23 Rotation Angle θx For A 10-kg Sail With Different Spanwise Positions Of
Center Of Mass . . . 69 Figure 5.24 Rotation Angle θx For A 50-kg Sail With Different Spanwise Positions Of
Center Of Mass . . . 70 Figure 5.25 Balloon Relative Wind Velocity Along ˆko Due To A 10-kg Sail For Different
Spanwise Center Of Mass Locations . . . 70 Figure 5.26 Balloon Relative Wind Velocity Along ˆko Due To A 50-kg Sail For Different
Chapter 1
Introduction
1.1
Background
In 1783, human flight with hot-air balloon was mastered by Joseph-Michel Montgolfier and Jaques- ´Etienne Montgolfier in France [1, 8]. Ever since, balloons have been used for recreational
purposes and by scientists for in-situ measurements of atmospheric temperatures and pressures.
With the progress of balloon technology, increasingly sophisticated measurements and sci-entific discoveries were facilitated. In 1912, Victor Hess conducted experiments to understand
the radiation changes with altitude. These experiments lead to the discovery of cosmic rays for
which Hess was later awarded the Nobel prize in 1936 [9].
More recently, balloon borne observations have led to breakthroughs in astrophysics. In
1997, the BOOMERanG (Balloon Observation Of Millimetric Extragalatic Radiation ANd
Geo-physics) experiment measured the cosmic microwave background radiation of a small part of the sky using a high-altitude balloon flown over Antarctica. This experiment laid the foundation
for later experimental work conducted with satellites and eventually led to the 2006 Balzan Prize for Astronomy and Physics [2]. More recently, observations regarding high-energy cosmic
ray electrons and a negative search for annihilation signatures of dark matter in the anti-proton
channel have been conducted using high-altitude balloon based platforms [9]. High-altitude balloons are suitable for research areas such as cosmic microwave background, hard x-ray
as-tronomy, gamma-ray astrophysics, and cosmic ray investigations. High-altitude balloons can
allow sensors to be above 99.5 percent of Earth’s atmosphere, which is essentially as good as being in space[1].
High-altitude balloons can be used for atmospheric or earth science measurements as well.
These balloon can provide in-situ and higher fidelity data compared to satellites or other means. In Earth-science measurements, such as earth radiation measurements conducted with satellites,
and assumptions inherent in remote-sensing algorithms. High-altitude balloons also provide an
excellent vehicle for measuring magnetic field of the Earth’s crust. Understanding of the local magnetic field led to the theory of plate tectonics and would provide further understanding of
the physics of geomagnetic field changes. Aircraft lack the range to cover vast parts of the globe
whereas the magnetic field is often too weak for satellites to resolve. Measuring local magnetic field with ships is usually expensive and is a time-consuming process. In addition, high-altitude
balloons can also be used for measuring the atmospheric chemistry in the upper stratosphere
and lower troposphere [10].
The majority of the high-altitude balloon research is lead by NASA. In the 2001 Science
News Metrics, 8.3 percent of the world’s discoveries and technologies were attributed to NASA
and 83 percent of these discoveries were space related. Of the latter, 25 percent were attributed to the Hubble Space Telescope, 19 percent to Chandra mission, 9 percent to Mars Global
Surveyor, 9 percent to balloons, 6 percent to Near Earth Asteroid Rendezvous missions, 5
percent to astro-biology, 5 percent to the International Solar Terrestrial Program, and 16 percent to other categories. This metric demonstrates the importance and significance of balloon-based
observations on new discoveries and technologies [11].
High-altitude balloons have significant advantage over satellites. The cost of a satellite, including the launch cost, can be easily over $200 million. The estimated cost of a balloon
flight is between $500,000 and few million depending on the cost of the science payload [10]. The BOOMERanG experiment is an excellent example of how high-altitude balloons facilitated
initial observations, which were then completed by a dedicated satellite. The balloon’s payload
can be recovered and used for repeat flights several times. Under the current NASA program, the payloads are recovered, refurbished, and re-flown several times, with successive flights providing
higher quality measurements [9].
Often, different students and young researchers are involved in different flights. High-altitude balloons provide excellent opportunities for a large number of young scientists, engineers, and
technicians to gain valuable hands-on experience with cutting-edge space research and
technol-ogy development. The low cost of the balloon missions offers realistic opportunities to involve researchers from across the world.
The evolution of high-altitude balloon has allowed improvements in observational
Figure 1.1: Evolution Of Balloon Design[1]
In the 1950, Otto C. Winzen patented the modern-day, naturally-shaped balloons (pictured in Fig. 1.1). These polyethylene balloons had integral load tapes that enabled heavier payloads
and larger envelopes. These balloons could reach almost 30 km altitude. Since the 1950s, balloon
design has essentially remained unchanged but with gradual improvements the range of possible missions has vastly increased. The conventional zero-pressure polyethylene balloons used by
NASA for Long-Duration Balloon (LDB) can fly for 10-20 days over the Antarctic and Arctic
regions. These flights can carry suspended payloads of about 2500 kg with scientific instruments in excess of 1000 kg to altitudes approaching 40 km. The LDB balloons have limited endurance,
as maintaining altitude requires expending ballast and buoyant gases to counter the changes
in temperature during the diurnal cycle. The extended operating time is achieved in the polar regions during the respective summers as the solar radiation is relatively constant [12].
In a parallel effort to extend the balloon mission duration, NASA has been developing
super-pressure balloons termed Ultra-Long-Duration balloon (ULDB). Super-pressure balloons are essentially constant-volume systems which require that the strength of the balloon skin be
sufficient to withstand the increase in pressure created by solar radiation heating of the gas
Figure 1.2: NASA’s≈200,000m3 ULDB Over Antarctica [2]
not required for nominal operation. These balloon are designed to operate for 60-100 days and
even operate at more moderate latitudes. Unfortunately, NASA has suffered repeated test flight
failures with the largest balloons envisioned under this program. However, relatively smaller balloons have been deployed successfully. In December 2008, NASA successfully launched a
ULDB with an approximate volume of 200,000 m3. Figure 1.2 shows a picture of ULDB over Antarctica at an altitude of 33 km.
As ballooning technology improves to facilitate increases in payload and endurance, there
is a desire to be able to control the trajectory of the balloon. In 2008, a super-pressure balloon
similar to the one pictured in Fig. 1.2 was being test flown over Antarctica. The balloon remained aloft for 54 days and circumnavigated Antarctica 3 times before the flight had to be terminated
as the flight path was tending to go off the continent [3].
Both passive and active methods for controlling the trajectory have been suggested. The
active methods employ a propeller powered by either fuel in chemical form or by batteries. These
options can potentially provide greater control over the balloon trajectory and can even provide limited ability to station-keep. However, due to the large mass footprint of the system and severe
limitation on flight endurance, active systems are not desirable. The passive technologies usually
employ an aerodynamic surface, similar to a sail, attached with a tether several kilometers long such that it can gently nudge the balloon towards a desirable direction [3, 13, 10]. Figure 1.3
shows a depiction of a balloon with a aerodynamic sail. Such sails are also being proposed for
extra-terrestrial exploration of Mars and Venus [14].
gradi-Figure 1.3: Balloon With Aerodynamic Sail (Not To Scale) [3]
ents. Winds relative to the earth’s surface at higher altitude are faster compared to those at lower altitude. This trend is corroborated with numerous US National Center for Atmospheric
Research (NCAR) reports including NCAR TN-336 [6]. A consequence of this wind-velocity
gradient is that there is a relative wind on the aerodynamic sail, which can then be used to produce aerodynamic lift.
Under contract from NASA’s Small Business Innovation Research program, the Global
Aerospace Corporation has conducted initial proof-of-concept research studies, modeling, and experimental testing of a scaled model. Researchers have outlined the structural details of
balloon-sail systems. This research provides valuable insight into its weight budget, geometry, and operational mechanics. Such a qualitative treatment is useful to understanding the intricate
physics behind its motion. However, there is still paucity in quantitative analysis which would
represent the realistic dynamics of such tethered systems. The purpose of this work is to expand on the dynamics of a tethered sail to bridge the gap between the physical system and its actual
1.2
Research Objectives
This research effort is geared towards improving the understanding of the dynamics of the
aerodynamic sail used to guide high-altitude balloons. Concomitantly, improved understanding of what a given sail can achieve in steady-state conditions is desirable for design and future
analysis of the balloon-sail system.
Initially, the focus of this research was on identifying the dominant inertial effects i.e., the inertial accelerations that directly affect the system behavior. Such an analysis would lay a
foundation for further study by providing a cogent argument for directing the effects that need
to be modeled.
The behavior of such a system can be gained through analytical solutions or numerical
modeling. In addition, closed-form expressions are sought that characterize the performance and stability of a sail. Then, a high-fidelity full-numerical solution methodology is sought to
conduct a parametric study to assess and identify key parameters for the design of more efficient
sails.
1.3
Thesis Outline
In Chapter 2, a scale analysis is conducted by systematically evaluating inertial-acceleration
terms and identifying the dominant terms. This chapter provides the simplifications that lay the foundation for further analyses. In Chapter 3, the sail characteristics are isolated with the
assumption of small perturbations. This chapter provides analytical expressions that provide
insight in the guidance ability of the sail and an expression for static stability of the sail. Next, in Chapter 4 a non-linear equilibrium solution for the balloon-sail system is developed. This
solution involves sophisticated aerodynamic modeling of the sail with vortex-lattice methods for aerodynamic forces and stability derivatives. A sample solution is shown in this chapter to
highlight the intricacies of the system. Chapter 5 uses the equilibrium solution and presents the
Chapter 2
Acceleration Scale Analysis
The purpose of this analysis is to identify the acceleration terms that are significant and the terms that may be ignored in order to simplify further analysis and modeling. As the balloon is
the largest mass in the system, acceleration scale analysis is focused on the balloon. The results
of this analysis can then be extended to the sail.
In the most general form, the acceleration of the balloon center of mass may be expressed
as:
O~a
cm/o =B~aCM/o
| {z }
relative
+ 2O~ωB×BV~cm/o
| {z }
Coriolis
+O~αB×~rcm/o
| {z }
tangential
+O~ωB×O~ωB×~rcm/o
| {z }
centripetal
(2.1)
In Eq. 2.1, there are four different types of accelerations - relative, Coriolis, tangential, and
centripetal. Each acceleration has a unique effect on the system behavior. If this analysis shows that the Coriolis, tangential, and centripetal terms are negligible, i.e.:
O~a
cm/o≈B~acm/o (2.2)
then, further analysis can be substantially simplified.
2.1
Simplifying The Expression For Acceleration
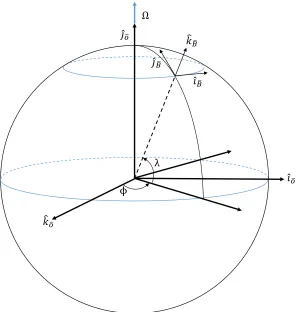
A convenient set of frames is established to calculate the expression for acceleration. Fig. 2.1
shows an inertial frame of reference placed at the center of the earth and a second frame at the center of mass of the balloon. The frame located at the center of mass of the balloon rotates
Ω
ϕ λ
𝑘 𝑜
𝑖 𝑜
𝑗 𝑜 𝑘 𝐵
𝑖
𝐵
𝑗
𝐵
Figure 2.1: Inertial(O) Frame and Balloon-Body(B) Frame
It is preferable to express the acceleration terms in a certain manner such that the magnitude
of each of the terms can be most easily assessed. As the B-frame is located at the center of mass of the balloon. The acceleration can be expressed as:
O~a
cm/o=B~acm/o
| {z }
Term 1
+ 2O~ωB×BV~cm/o+Oα~B×~rcm/o+O~ωB×
O~ωB×~r cm/o
| {z }
Term 2
(2.3)
If term 1 is significantly larger compared to term 2 identified in Eq. 2.3, then term 2 can be ignored for further analysis.
2.2
Calculating Acceleration Expression
The relation between the inertial frame and the balloon-body frame can be achieved by using
No-tice from Fig. 2.1 thatλis a negative rotation.The Euler angle transformation can be described as:
O[c]B =
cos(φ) 0 sin(φ)
0 1 0
−sin(φ) 0 cos(φ)
1 0 0
0 cos(λ) sin(λ) 0 −sin(λ) cos(λ)
(2.4)
The transformation in Eq. 2.4 is useful for calculation of angular velocity, which is required for calculating the acceleration terms identified in the previous section. The angular velocity vector
components can be defined as:
n
O~ωBo B= ωx ωy ωz (2.5)
Using Eq. 2.4, the angular velocity components can be easily calculated using the definition of
angular velocity. The angular velocity of the balloon is:
ωx=
n
0 0 1
o
B[c]O O[c˙]B
0 1 0
=−λ˙ (2.6)
ωy =
n
1 0 0
o
B[c]O O[c˙]B
0 0 1
= cos(λ) ˙φ (2.7)
ωz =
n
0 1 0
o
B[c]O O[c˙]B
1 0 0
= sin(λ) ˙φ (2.8)
In the angular velocity terms, ˙λis analogous to motion along a longitude. Similarly, the ˙φterms are analogous to motion along the latitudes. ˙φincludes contributions due to the rotation of the earth and due to the velocity relative to the earth. Onlyλhas an effect on the angular velocity; the angular velocity is independent of φ, as may be expected.
The position vector for the balloon can be described as:
Using the position vector in Eq. 2.9, the relative velocity of the balloon can be defined as:
n
BV~ cm/o o B = 0 0 ˙ RBLN (2.10)
Using the relative velocity vector in Eq. 2.10, term 1 of Eq. 2.3 can be easily calculated with
simple differentiation: n B~a cm/o o B= 0 0 ¨ RBLN (2.11)
In the B-frame, term 1 of Eq. 2.3 is simply the acceleration of the balloon altitude.
The angular velocity can now be used to compute term 2 of the acceleration as identified in
Eq. 2.3:
n
2O~ωB×BV~cm/o+O~αB×~rcm/o+O~ωB×
O~ωB×~r cm/o o B =
2 ˙RBLNcos(λ) ˙φ+RBLN
¨
φcos(λ)−2 ˙φλsin˙ (λ) 2 ˙RBLNλ˙ +RBLN
¨
λ+ ˙φ2cos(λ)sin(λ) −RBLN
˙
φ2cos(λ)2+ ˙λ2
(2.12)
Term 2 in Eq. 2.12 contains accelerations due to motion along the horizon i.e., no change in
altitude. Each component is scaled with altitude of the balloon.
2.3
Approximating Orders of Magnitude
The magnitudes ofRBLN,R˙BLN,R¨BLN,φ,˙ φ,¨ λ,˙ and ¨λneed to be identified for a comparison of
terms 1 and 2 of Eq. 2.3. Some parameters can be identified from the balloon-sail parameters, whereas other parameters require additional analysis.
Magnitude of RBLN
RBLN is simply the altitude of the balloon. As the system has to be designed such that the
balloon maintains an altitude of 35,000 km, the magnitude of RBLN can simply be assumed
to be the sum of above-mean-sea-level (MSL) altitude and the radius of the earth, which is
Magnitude of R˙BLN
The most likely cause of the balloon to change altitude is the due to a change in the weight
of the gondola due release of a dropsonde or due to change in the weight of the sail that is
supported by the balloon. Such a change would occur if the sail is configured to produce a large guiding force. As the velocity of the balloon is damped by drag, the magnitude of the balloon
altitude change would of the order of magnitude is−1 or O(−1).
Magnitude of R¨BLN
The acceleration along the altitude would be caused by the same factors listed for ˙RBLN. In
such a situation, a force imbalance would cause the balloon to accelerate to transition to a
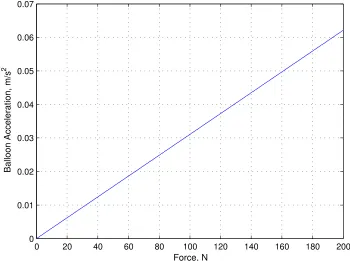
equilibrium condition. Fig. 2.2 shows the magnitude of the acceleration that would be achieved instantaneously if a net force acted on the balloon. Due to the large mass of the balloon and the
added mass effect, the acceleration is relatively small. Typically, the acceleration can be said
to have an acceleration between 0.02 and 0.04m/s2. The order of magnitude of acceleration is
−2 orO(−2). Additionally, such an acceleration occurs only very briefly.
0 20 40 60 80 100 120 140 160 180 200 0
0.01 0.02 0.03 0.04 0.05 0.06 0.07
Force, N
Balloon Acceleration, m/s
2
Magnitude of φ˙
The magnitude of ˙φ has two components. The rotation of earth and the velocity relative to earth contribute to ˙φ. The component due to the velocity relative to earth is dependent on the latitudinal position of the balloon. The latitudinal dependency must be accounted for since the balloon-sail system is expected to operate near the poles.
The two components can be expressed as:
˙
φ= u
RBLNcos(λ)
+ Ω (2.13)
The velocity u is dependent on the zonal winds. Zonal and meridional winds are mete-orological terms for winds parallel to latitudes and longitudes, respectively. The axis system
established in Fig.2.1 is such that velocityuis zonal winds. NCAR TN 336 [6] provides monthly averages of zonal winds at various pressure altitudes at latitudes from -85◦ to 85◦. Using this wind information, the approximate maximum zonal wind velocity can be identified. This
tech-nical report shows that the maximum zonal winds can be as high as 50 to 70 m/s, especially in
the higher latitudes. As a result, the most winds can contribute is approximately ≈1.0×10⁻⁵ rad/s.
The contribution due to the rotation of the earth, Ω, is fixed at 7.27×10⁻⁵ rad/s.
As ˙φ is the sum of the two components. 1.0×10⁻⁵ rad/s + 7.27×10⁻⁵ rad/s is 8.27×10⁻⁵ rad/s. Therefore, the order of magnitude of ˙φis −5 orO(−5).
Magnitude of λ˙
Unlike ˙φ, ˙λhas only one component. Motion along the longitudes can occur only due to winds relative to the spinning earth. Meridional winds are perturbation to the mean and are more
difficult to characterize. However, for the purposes of this analysis, the worst-case scenario
can be borrowed from zonal winds data, i.e., wind velocity of 50 to 70 m/s can be used for approximation. The axis system established in Fig. 2.1 is such that velocity v is meridional winds. Meridional winds can be related to ˙λas:
˙
λ= v
RBLN
(2.14)
Magnitude of φ¨
˙
φ has two component but ¨φ only has a single component. The rotation of earth is fixed and does not contribute to the ¨φ. The balloon can accelerate with respect to the spinning earth due to gusts or other atmospheric disturbances. Figure 2.3 shows the acceleration of the balloon due to relative wind. The acceleration is caused by drag force acting on the balloon. Drag force
is not a function of velocity with respect to spinning earth but the velocity of air with respect
to the balloon.
0 1 2 3 4 5 6 7 8 9 10
0 0.05 0.1 0.15 0.2 0.25 0.3 0.35
Relative Wind, m/s
Balloon Acceleration, m/s
2
Figure 2.3: Balloon Acceleration Due To Relative Wind
The drag force quadruples if the relative wind speed is doubled. However, relatively large gusts cause an acceleration with an order of magnitude of−1 orO(−1). Assuming the gusts and
disturbances do not cause a change in altitude, the order of magnitude can be approximated to
Magnitude of λ¨
The order of magnitude of ¨λcan be approximated similarly to ¨φ. Based on Fig. 2.3, the mag-nitude of acceleration can be approximated to an order of magmag-nitude of −1 orO(−1). Again,
assuming that gusts and disturbances do not cause a change in altitude, the order of magnitude can be approximated to be−9 or O(−9).
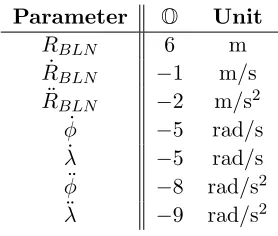
Table 2.1: Approximate Orders of Magnitude
Parameter O Unit
RBLN 6 m
˙
RBLN −1 m/s
¨
RBLN −2 m/s2
˙
φ −5 rad/s
˙
λ −5 rad/s
¨
φ −8 rad/s2 ¨
λ −9 rad/s2
In summary, the orders of magnitude are listed in Table 2.1. These approximations can now
be applied to the equations developed in Section 2.2.
2.4
Comparing Acceleration Terms
The two acceleration terms identified in Eq. 2.3 can now be compared. Term 1 only contains ¨
RBLN as shown in Eq. 2.11. From Table 2.1, ¨RBLN has an approximate order of magnitude of −2 orO(−2).
Term 2 is more complex as seen in Eq 2.12. Each component can be evaluated individually. The ˆiB component is 2 ˙RBLNcos(λ) ˙φ+RBLN
¨
φcos(λ)−2 ˙φλsin˙ (λ).The net order of mag-nitude is−3 orO(−3). The ˆjB component is 2 ˙RBLNλ˙+RBLN
¨
λ+ ˙φ2cos(λ)sin(λ). The net order of magnitude is −3 orO(−3). The ˆkB component is −RBLN
˙
φ2cos(λ)2+ ˙λ2. The net order of magnitude is −4 orO(−4).
Two components of term 2 have O(−3) and one component has O(−4). A simple 2-norm
would not be representative comparison as the orders of magnitude represent the worst-case
conditions. In addition, a norm would not be representative as those conditions cannot con-currently occur. However, since each component of term 2 is at least one order of magnitude
smaller, an argument can be constructed that for instantaneous analysis pertaining to
for extended periods of time would require that term 2 of Eq. 2.3 be included.
2.5
Summary
A scale analysis of acceleration terms is conducted in this section. Acceleration can comprise
of various terms, often some being significantly larger than other, which add to the complexity
of further analysis. If the acceleration expression can be simplified, further analysis can also be simplified.
In Chapter 2.1, a set of frames was established such that the general acceleration expression was simplified and broken down into two terms - term 1 and term 2. A relative comparison
of the two provides an insight to which terms dominate the acceleration expression. In
Chap-ter 2.2, Chap-terms 1 and 2 were explicitly calculated. Once these expressions were derived, the key variables were identified and the order of magnitudes of these variables can be approximated.
In Chapter 2.3, the orders of magnitude of the variables identified in the previous section are
evaluated for a worst-case scenario using system parameters and wind information available in literature. Finally, in Chapter 2.4, the orders of magnitude of terms 1 and 2 were compared.
All components of term 2 are at least one order of magnitude smaller compared to term 1. As
a result, term 2 may be ignored for instantaneous analyses dealing with equilibrium, stability, and performance. Analyses for extended period of time would require that the full expression
Chapter 3
Sail Characterization
The balloon-sail system has complex interactions between the balloon and the sail. A fully non-linear set of equations describing these interactions would be too complex to provide an
intuitive understanding of the behavior of either.
The balloon is two orders of magnitude more massive compared to the sail and, in addition, the acceleration of the balloon is further languished by the added mass effect. In [13], Nock et.
al approximate balloon and gondola mass to be almost 4100 kg whereas the sail is expected
to be around 90 kg, but for extra-terrestrial observations estimates are as low as 12.5 kg [15]. The added-mass effect for the balloon essentially increases the mass of the balloon by 50% [16]
as the air around the balloon has to be displaced to allow acceleration of the balloon. At this
point, a reasonable assumption would be that small perturbation to the sail due to atmospheric disturbances do not have any effect on the balloon. This assumption would enable a simplified
analysis of the sail.
The coordinate frames used in this chapter are defined in detail in Chapter 4.1. These coordinate frames are adopted from aircraft literature for compatibility with vortex-lattice
methods.
This chapter presents two analyses for an isolated sail from first principles. The first concerns the aerodynamic design and performance of the sail in terms of guidance force that a sail could
theoretically provide. The second analysis concerns the static stability condition for the sail.
3.1
Sail Performance Analysis
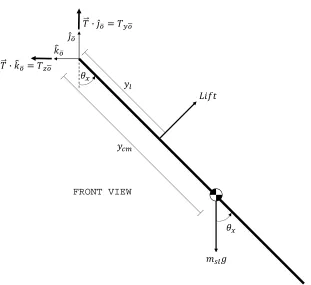
In equilibrium, i.e., when the sum of forces and moments is zero, the forces and moments on
the sail can be easily represented on a free-body diagram as shown in Fig. 3.1. The figure shows the sail from a front-view. The relative wind goes into the page. There are three primary forces
̂
·
FRONT VIEW · ̂
Figure 3.1: Equilibrium Sail Free-Body Diagram
Tension is split into two components along the ˆjo and ˆko. There is a third component of
tension which comes out of the page but is not considered here as this is only a two-dimensional
analysis. The aerodynamic force can be considered perpendicular to the sail as traditionally lift force is defined perpendicular to the flow rather than perpendicular to the aerodynamic
panel producing the force. Lift is always accompanied by drag. However, similar to the third
component of tension, drag may be ignored for this two-dimensional analysis. Now, Newton’s second law of motion can be applied to sum the forces:
X
Fzo=−Lcos(θx) +Tzo= 0 (3.1)
X
Similarly, the sum of moments is:
X
Mxo =ylL−mSLgycmsin(θx) = 0 (3.3)
Note that the moments in Eq. 3.3 are summed about the tether location. It can be easily shown
that the sum of moment about any arbitrary point must equal zero for equilibrium. Simplifying
Eqs. 3.1-3.3 and solving for tension force components, the following expressions can be easily derived:
Tzo=L
s
1−
L mSLg
2
yl
ycm
2
(3.4)
Tyo=mSLg−
L2 mSLg
yl
ycm
(3.5)
The tension force component along the ˆjo direction, Tyo, is approximately 1 the force that
helps guide the balloon in the desired direction. This force has a strong dependency on the
ratio of the distances yl and ycm. The sail performance improves as the distanceyl decreases
and distance ycm increases.
A simple maximization ofTzo with respect to lift can be used to calculate the lift force that
would translate into the highest possible guiding force, Tzo:
L)T
zoMAX = 1 √ 2 ycm yl
mSLg (3.6)
Substituting Eq. 3.6 in Eq. 3.4 provides an expression for the maximum guiding force a sail
can generate:
TzoM AX =
1 2 ycm yl
mSLg (3.7)
The maximum guiding force that a sail can generate is dependent on the ratio of the distance
to the center of mass from the tether point and the distance to the lift force centroid from the
tether point, and the mass of the sail. A well designed sail would minimize the amount of mass required by maximizing the aforementioned ratio.
Finally, some of the assumption of this analysis require further discussion. Lift force depends
on three parameters - coefficient of lift, dynamic pressure, and a reference area:
L=CLqS (3.8)
1
The reference area, S, is projected area of the sail wing and is fixed. Dynamic pressure,
q, is a function of relative wind velocity, and ambient air density. The coefficient of lift can be set with user input or an on-board controller by deflecting the elevator section on the tail
surface of the sail. The coefficient of lift can only have a narrow band of values. The maximum
value of the coefficient of lift can depend on the airfoil section and the Reynolds number of the wing section. Reference [13] provides a typical value of the Reynolds number of the sail
at approximately 70,000. At such Reynolds number, the maximum coefficient of lift may be
limited to at most 1 or 1.2. As a consequence, the lift required to provide the guidance force as shown by Eq. 3.6 may never be achieved. The sail would undergo aerodynamic stall if the
required coefficient of lift exceeds the maximum coefficient of lift.
When the sail is producing significant amount of lift, tension on the tether pulls the balloon. Eventually, the balloon stops accelerating and maintains a constant velocity with respect to the
wind. The sail also moves along with the balloon. As a result, there is an additional component
of wind that causes an additional rotation of the sail. Figure 4.3 shows the aforementioned rotation.
The net result of the relative wind rotation is that the guiding force, Tzo, is in effect lower
compared to the derivation shown above.
3.2
Sail Stability Analysis
A definition for static stability can be adopted from aircraft literature. Static stability can be defined as the initial tendency of the sail, following a perturbation from a steady-state
condition, to develop aerodynamic forces or moments that are in a direction to return the sail
to the steady-state condition [17].
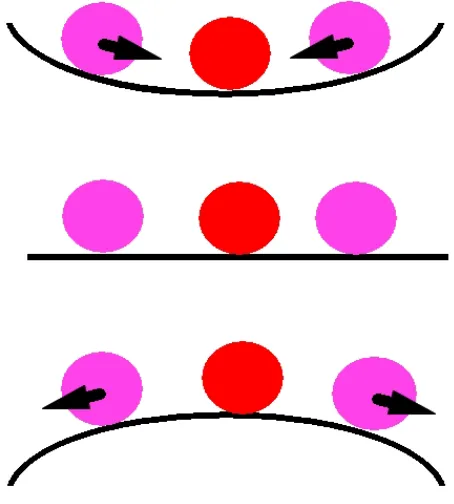
The most accessible explanation of the concept of stability can be illustrated with a marble
in a bowl as shown in Fig. 3.2. If in each case, the marble is initially at rest or in equilibrium,
then direction of the resulting force that develops after the marble is perturbed from equilibrium determines the static stability of the system. In the first instance, if the marble is perturbed
then the resulting forces tend to return it to equilibrium or exhibits positive static stability. In
the second instance, if the marble is perturbed then no restoring forces arise. The marble has neutral static stability. Lastly, if the marble is perturbed then the resulting force causes the
ball to further diverge from the original equilibrium or exhibit negative static stable.
The primary focus of this section is on pitch stability. A perturbation in the pitch of the sail would change the angle of attack and result in different value of the lift force. As lift force
is one of the most significant force in the system, pitch stability is essential for sail design. A static stability analysis requires expressions for applied forces and moments that act on
Figure 3.2: Examples of Positive (Top), Neutral (Middle), and Negative (Bottom) Static Sta-bility
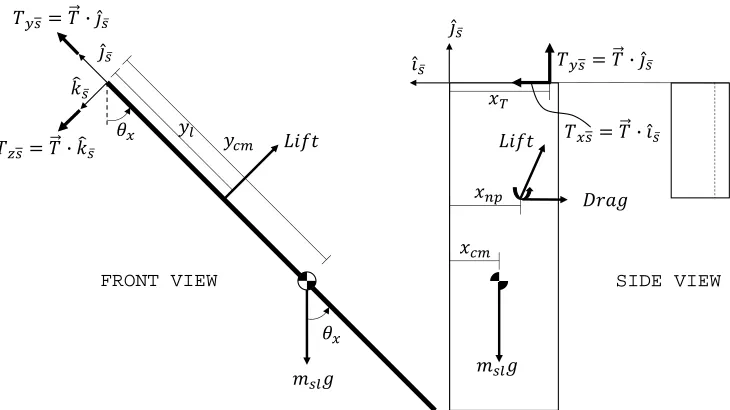
Fig. 3.3 has tension forces due to the tether oriented to simplify the expressions. The force and
moment expression are as shown in Eq. 3.9-3.12:
X
Fxs=Txs−Drag= 0 (3.9)
X
Fys=Tys−mslgcos(θx) = 0 (3.10)
X
Fzs=Tzs−Lif t+mslgsin(θx) = 0 (3.11)
X
MT =ylL−mslgsin(θx)ycm= 0 (3.12)
If Eq. 3.12 is used to solve for sin(θx) and substituted in Eq. 3.11, then the tension force
component can be written in terms of the lift force and the parametersyl and ycm:
Tzs =L
1− yl
ycm
(3.13)
̂̅
̅
· ̅
FRONT VIEW
̂̅ ̂̅
SIDE VIEW · ̂̅
· ̂̅
· ̂ ̅
Figure 3.3: Equilibrium Sail Free-Body Diagram
is placed at the intersection of the spanwise center of pressure and the chordwise position of the
neutral point. Each location has a unique significance. The center of pressure is a location about
which the lift force does not produce a moment. Placing the lift vector at the spanwise location of center of pressure ensures that no rolling moment is generated due to the lift. Neutral point
is a chordwise location where the pitching moment is not zero but is invariant with angle of
attack. In general, the aerodynamic influences can be described with a lift vector and a constant pitching moment.
The moments for this analysis must be balanced about the center of mass. Otherwise,
complex correction factors are introduced that will lead to more complex final result. Based on Fig. 3.3, the moment balance can be expressed as:
X ~
Mcm=M~aero+M~L+M~T (3.14)
arm need to be evaluated in the coordinate frame shown in Fig. 3.3. As mentioned earlier, lift
is always accompanied with drag. However, drag is usually much smaller compared lift. As a simplification, the moment due to drag is ignored. Not only drag is 1/6th or 1/3rd of lift but
the moment arm of drag for the pitching moment is extremely small compared to moment arm
of lift for the pitching moment. The moment due to lift can be written as:
n ~ ML o S = n ~
rnp/cm×~L
o S=
xcm−xnp
ycm−yl
0 × 0 0 −L =
L(yl−ycm)
L(xcm−xnp)
0 (3.15)
Similarly, the moment due to tether tension can be written as:
n ~ MT o S = n
~rT /cm×T~o
S=
xcm−xT
ycm 0 × TxS TyS TzS =
TzSycm
TzS(xT −xcm)
TyS(xcm−xT)−ycmTxS
(3.16)
Based on Eq. 3.15 and Eq.3.16, the pitch axis moment expression is:
MyS =M0+L(xcm−xnp) +TzS(xT −xcm) (3.17)
MyS =M0+L(xcm−xnp) +L
1− yl
ycm
(xT −xcm) (3.18)
Note in Eq. 3.18,TzS has be substituted with Eq 3.13. Now this expression can be converted to aerodynamic coefficient form by substituting in Eq. 3.8 for lift force and Eq. 3.19 for moments:
M =CmqSc (3.19)
The resulting equation can be simplified to calculate pitching moment:
Cm =Cm0+CL
(xcm−xnp)
c +CL
1− yl
ycm
(xT −xcm)
c (3.20)
The pitching moment expression in Eq. 3.20 can have one additional term for the elevator
deflection. However, this term can be lumped with Cm0 in the interest of simplicity.
The definition for static stability at the beginning of this section translates into the math-ematical condition:
Cmα <0 (3.21)
If this constraint is applied to Eq. 3.20, a stability condition can derived. First, Eq. 3.20 is
the subject of the expression:
Cmα =
∂Cm
∂α = CLα
c
xT −xnp+
yl
ycm
(xcm−xT)
<0 (3.22)
xcm<
yl
ycm
(xnp−xT) +xT (3.23)
Eq. 3.23 provides a stability condition reminiscent of static stability condition for aircraft,
xcm < xnp. The tether introduces more complexity. Eq. 3.23 can be deconstructed in three
important cases:
1. xnp > xT: In this case, the neutral point is behind the tether location. As a result, the
quantity xT −xnp is positive. The center of mass can be marginally aft of the tether
location without the onset of instability.
2. xnp =xT: In this case, the neutral point is aligned with the tether location. The inequality
in Eq. 3.23 simplies to xcm < xnp. The center of mass is required to be forward of the
tether location/neutral point. The sail parameter yl/ycm will have no bearing on the
stability.
3. xnp < xT: In this case, the tether location is behind the neutral point. As a result, the
quantityxT −xnp is negative. The center of mass would be required to be forward of the
tether location.
The expression in this analysis were developed in the stability frame. Stability frame
simpli-fies aerodynamic influences but impose the assumption of small angles. The quantitiesxcm, xnp
and xT are most easily expressed in the sail body frame. The parameters yl and ycm are
un-affected by this coordinate transformation. The difference between the stability frame and the
sail body frame is a single negative rotation by the angle of attack. As long as the angle of
attack is small, this analysis will provide reasonable predictions.
3.3
Summary
A simplified analysis of the sail was conducted in this section. This analysis assumed that small perturbations to the sail due to atmospheric disturbances have negligible effect on the balloon
and that sail dynamics can be studied in isolation.
In Chapter 3.1 the ability of the sail to generate a guiding force was investigated. The component of the tension force responsible for guiding the balloon depends on the mass of the
sail, and the ratio of two distances -yl andycm.yl is the distance from the tethered end of the
to the spanwise center-of-mass location. The ratio ycm/yl must be maximized to improve the
performance of the sail. In Section 3.2, the pitch stability of the sail was investigated. Using a unique arrangement of aerodynamic forces and moments, an expression for the pitching moment
about the center of mass of the sail can be derived. Using this expression along with stability
condition requiringCmα <0, a condition for the position of center of mass can be derived. The
Chapter 4
Balloon-Sail Equilibrium Solution
In this chapter, the equations required for the equilibrium solution for the balloon-sail system are derived. The derivation uses basic principles of physics and borrows other models such as
the standard atmospheric model and vortex-lattice aerodynamic models to fully capture the
behavior of the system. Also, linear variation of winds is assumed with altitude.
The equilibrium model is useful for performance analysis of the system. Parameters such
as guiding force, drift velocity, etc. are useful for determining the effectiveness of the system
and provide important feedback to improve the overall design. In addition, for conducting eigenvalue-based stability analysis, a set of equations of motion linearized about an equilibrium
is required.
A major simplification to this analysis is the assumption of mass-less tether. The tether mass is small compared to the balloon, but is of the same order of magnitude as the sail. The
tether dynamics are an important aspect of the system dynamics but are too complex for this
analysis.
This section first presents various frames used to derive the equilibrium solution and the
transformation matrices that provide a relationship between these frames. As the atmosphere
pays a vital role in the system, the standard atmospheric model is briefly discussed for its implications. Next, the force and moment equations are developed for the balloon and the sail
using free-body diagrams. The equilibrium conditions are discussed next to reflect the
intrica-cies of the system. Using these equilibrium conditions and system constraints, the constraint equations are developed to form a coherent set of equations. Finally, the solution methodology
4.1
Frames Of Reference
Newton’s laws of motion are valid in an inertial frame of reference but expressing forces,
mo-ments, velocities, and distances is often simpler in non-inertial frames. In some instances ad-ditional frames of references can help better understand the phenomenon being studied. As
a guiding principle, the frames are oriented such that aerodynamic forces and moments from
aircraft conventions can be most easily incorporated. In this analysis, a total of 5 frames are used, namely:
1. Inertial Frame:o=nˆio,ˆjo,ˆko
o
Based on the scale analysis presented in Chapter 2, this analysis can exclude the rotation of the earth. The inertial frame is oriented such that unit vector ˆjo points upwards (i.e.
the direction of altitude), and vector ˆiois oriented along the winds at the balloon altitude.
The direction of wind at sail altitude is defined relative to the wind at balloon altitude. The vector ˆko is defined as per the right-hand rule.
2. Balloon-Body Frame:B =nˆiB,ˆjB,kˆBo
The balloon-body frame is located at the center of mass of the balloon-gondola system and this system is treated as a point mass to simplify the analysis. Chapter 4.3 discusses
the simplification further. As the balloon-gondola system is treated as a point mass, there
is no rotation of the balloon-body frame with respect to the inertial frame.
3. Sail-Wind Frame: W =
n
ˆi
W,ˆjW,ˆkW
o
The sail-wind frame is required for two reasons. The winds at balloon altitude and the
winds at sail altitude, in general, are not aligned. A consequence of the sail guiding the
balloon is a change in relative wind direction for the sail. The sail-wind frame provides a convenient coordinate system for capturing this effect. In addition, sail parameters are
defined with respect to the relative wind or sail-wind frame.
The sail-wind frame is a simple rotation with respect to the balloon-body frame about
the vector ˆjB with the angle ψ. The Euler angle transformation is:
B[c]W =
cos(ψ) 0 sin(ψ)
0 1 0
−sin(ψ) 0 cos(ψ)
4. Sail-Body Frame:F =nˆiF,ˆjF,kˆFo
The sail-body frame moves and rotates with the sail. The sail-body frame is useful for expressing the physical dimensions of the sail for moment arms, etc. The body-frame of the
sail also helps in determining the rotations that the sail undergoes to achieve equilibrium.
The sail-body frame rotates with respect to the sail-wind frame. In general, all three rota-tions are possible -θx, θy and θz. The Euler angle transformation using the conventional
3-2-1 rotation sequence is:
W[c]F =
cos(θz) −sin(θz) 0
sin(θz) cos(θz) 0
0 0 1
cos(θy) 0 sin(θy)
0 1 0
−sin(θy) 0 cos(θy)
1 0 0
0 cos(θy) −sin(θy)
0 sin(θy) cos(θy)
=
cos(θy) cos(θz) sin(θy) cos(θz) sin(θx)−cos(θx) sin(θz) sin(θx) sin(θz)+sin(θy) cos(θx) cos(θz)
cos(θy) sin(θz) cos(θx) cos(θz)+sin(θy) sin(θx) sin(θz) sin(θy) cos(θx) sin(θz)−cos(θz) sin(θx) −sin(θy) cos(θy) sin(θx) cos(θy) cos(θx
(4.2)
5. Sail-Stability Frame: S=nˆiS,ˆjS,ˆkSo
The aerodynamic forces and moments can be most easily expressed in the sail-stability
frame. Aerodynamic forces are defined with respect to relative wind velocity and the
sail-stability axis aligns with the relative wind.
The sail-stability frame is a simple negative rotation about the sail-body axis ˆjF vector by the angle of attack, α. The Euler angle transformation is:
B[c]S =
cos(α) 0 −sin(α)
0 1 0
sin(α) 0 cos(α)
(4.3)
Using these various frames the problem of equilibrium solution can be simplified into smaller
and more manageable tasks.
4.2
Standard Atmospheric Model
The atmosphere plays a vital role in modeling the balloon-sail system. The ambient density along with the displacement of the balloon determines the equilibrium altitude. As for the
atmospheric density. The standard atmosphere provides a tool to coherently model atmospheric
parameters.
The U.S. Standard Atmosphere 1976 model [18] is based on the averaged temperature
pro-files for the atmosphere. Fig. 4.1 shows the variation of temperature as a function of altitude. As
seen in Fig. 4.1, there are isothermal and gradient regions. In isothermal regions, the temper-ature does not change and in gradient regions, the tempertemper-ature changes linearly with altitude.
For each region, expressions for density can be evaluated using the equation of state and the
hydro-static equation under the ideal gas assumption.
The sail is typically placed at 20 km of geometric altitude. Based on Fig. 4.1, the sail can
be modeled in the gradient region. When the sail is producing lift, there is a change in position
of the sail which places it well within the gradient region. Similarly, the balloon is placed at 35 km of geometric altitude and based on Fig. 4.1 the balloon also belongs to another gradient
region.
The first step to determining the density at a desired altitude in gradient region is cal-culating the temperature. As the temperature varies linearly, the expression for interpolating
temperature is quite simple:
T =T1+a(h−h1) (4.4)
The temperature lapse rate, a, along with base altitude, h1, and temperature, T1, for a region
are defined as part of the atmospheric model. Using this temperature, the expression for density at an altitude within a gradient region can be easily derived to be:
ρ ρ1
=
T T1
−[aRg0+1]
(4.5)
Similarly, the base density,ρ1, is defined as part of the atmospheric model.
If the altitude change is too large, a standard atmospheric model computer function can
be developed to model the density changes experienced by the balloon and the sail. Such a function can easily cover the entire model.
4.3
Balloon Force And Moment Equations
The balloon experiences four major forces: gravitational, buoyancy, aerodynamic drag, and
tension from the tether:
X
~
FBLN =F~g+F~b+F~drag+T~ (4.6)
The gravitational, buoyancy, and aerodynamic drag forces act at approximately the center of
the balloon. Tension force due to the tether has a moment arm of approximately one balloon
that a balloon experiences and the precise orientation of the balloon. As a result, modeling
the balloon as point mass simplifies the non-linear system of equations required to solve for equilibrium solution.
Each force acting on the balloon requires some discussion for developing a suitable
expres-sion:
Gravitational Force
At an altitude of 35 km, the acceleration due to gravity is notably different compared to 9.81
m/s2 used for sea-level analysis. Instead of using a fixed value evaluated at 35 km, the general expression is used to enable flexibility with the range of altitudes:
gBLN =G
Me
(Re+hBLN)2
(4.7)
The gravitational force on the balloon-gondola can be expressed as:
~
Fg =mBLNgBLN =mBLNG
Me
(Re+hBLN)2
ˆ
jo (4.8)
Buoyancy Force
Archimedes of Syracuse discovered that “any object, wholly or partially immersed in a fluid,
is buoyed up by a force equal to the weight of the fluid displaced by the object” [19]. Using
this principle, the buoyancy force can be approximated using the volume of the balloon, the ambient density, and the gravitational acceleration:
~
Fb=ρBLNgBLNVBLNˆjo (4.9)
The density, ρBLN, at the balloon altitude can be calculated from the standard atmosphere
model and the gravitational acceleration, gBLN can be calculated from Newton’s law of
gravi-tation as discussed earlier. The volume of the balloon can be more challenging to calculate. In general, diurnal changes in temperature cause a change in the volume of the gasses inside
the balloon. These effects are magnified due to the greenhouse effect inside the balloon. However,
balloons used for long-term high-altitude mission are superpressure balloons. In Ref. [9], Jones has proposed the use of such balloons developed under the NASA’s Ultra Long Duration Balloon
(ULDB) program. These balloons have an inelastic skin that helps keep the volume of the
balloon relatively constant. The volume of the balloon can be simply estimated with balloon specifications. The variables of ambient temperature and balloon history are eliminated from
Aerodynamic Drag
A balloon is a bluff body and creates symmetric curvature of streamlines; i.e., does not produce
any lift. As a result, the balloon can only produce aerodynamic drag when exposed to relative
wind. If the balloon did not have a sail connected, the balloon would eventually reach the wind velocity due to the aerodynamic drag; the drag force would ensure that the balloon will travel
with the local wind. Since the balloon has a sail attached, there is an external force acting on
the balloon and the only mechanism for balancing this external force is drag, i.e., due to the sail, the balloon does not travel with the wind but maintains a steady relative velocity with
respect to the wind. The aerodynamic force is directly related to the relative wind velocity
vector.
The general expression for drag is:
~
Fd=−CD(Re)
1
2ρ∞kV~BLN−Rel k
2
πR2BLN ~
VBLN−Rel kV~BLN−Rel k
(4.10)
The coefficient of drag is a function of Reynolds number. Fig. 4.2 [5] shows the variation ofCD
with Reynolds number. Fig. 4.2 shows that drag coefficient is approximately constant between
Reynolds numbers of 103 to 105. At an altitude of 35 km, a 50-m diameter balloon has the Reynolds number expressionRe= 5.54×10⁴ V
∞. Small relative wind velocities to significantly
large relative wind velocities, (1−3m/s), lead to a Reynolds number where the coefficient of drag is approximately constant. As a result, a constant drag coefficient of 0.47 can be used for modeling the aerodynamic drag on the balloon. The drag on the gondola is assumed to be
negligible.
The simplified expression for drag force is:
~ Fd=−
1
2πCDρ∞R
2
BLNV~BLN−RelkV~BLN−Relk (4.11)
Note that drag vector can have all three components. The negative sign for aerodynamic drag force is required based on the definition of relative wind velocity.
Tension Due To Tether
The tension acting on the balloon is an unknown force. In general, the tension depends on the
sail configuration and the winds around the sail. For the balloon sum of forces, tension can be represented as set of unknowns in the required frame of reference.
Summation of forces on the balloon provide 3 equations towards the larger system of
equa-tions required to solve for the equilibrium of the balloon and sail system.
4.4
Sail Force And Moment Equations
Unlike the balloon, the orientation of the sail is has a direct impact on the forces being produced and the equilibrium solution. The forces and moments equations for the sail are required to solve
for equilibrium. The sail experiences three major forces: gravitational, tension due to tether,
and aerodynamic:
X
~
FSL =F~g−T~+F~aero (4.12)
If the moments are summed about the center of mass (assumed to be co-incident with center of gravity), the sail experiences moments due to aerodynamic influences, and due to the tension
force due to the tether:
X
~
Mcm=M~aero+M~T
X
~
Mcm=M~aero+~rT /cm× −T~
(4.13)
Each force and moment acting on the balloon requires some discussion for developing a suit-able expression. The most convenient frame of reference to describe all the forces and moments
Gravitational Force
The expression for gravitational force acting on the sail is similar to the expression for
gravita-tional force acting on the balloon:
n ~ Fg o o = 0
−mSLgSL
0 (4.14)
The gravitational force must be expressed in the sail-body frame. The correct expression
can be achieved by using the rotation matrices defined in Chapter 4.1:
n
~ Fg
o
F =
F [c]W W [c]onF~ g
o
o
= GMemSL (Re+hSL)2
−cos(θy) sin(θz)
−[cos(θx) cos(θz) + sin(θx) sin(θz) sin(θz)]
cos(θz) sin(θx)−sin(θy) cos(θx) sin(θz)
(4.15)
The expression in Eq. 4.15, as may be expected, is independent of the direction angle ψ.
Tension Due To Tether
The tension due to the tether connects the balloon and the sail. For the balloon, this force can
be expressed as:
n ~ To o= Txo Tyo Tzo (4.16)
For expressing the these components in sail force and moment balance, a coordinate transfor-mation is required. In the interest of brevity, the following dummy variables can be assumed:
n
~ T
o
F =
F[c]W W[c]O
Txo Tyo Tzo = TxF TyF TzF (4.17)
Aerodynamic Forces
The aerodynamic forces are best expressed in the stability frame,S. In the stability frame, the aerodynamic forces are simply lift, L, Drag,D, and sideforce,Ay [17]:
n
~ Faero
o
F = F [c]S
−D Ay −L =
−Dcos(α) +Lsin(α)
Ay
−Dsin(α)−Lcos(α)
(4.18)
Note that lift and drag are negative by convention. A positive angle of attack causes a
neg-ative lift force. Each component of the aerodynamic force can be further broken down into contributing elements in a Taylor series expansion form:
Lift, L
has three coefficient contributions that are scaled by the dynamic pressure and a reference
area:
L=qSLS CL0 +CLαα+CLδeδe
(4.19)
A contribution due to aerodynamic slide-slip would normally be included but as the sail
does not have a an aerodynamic surface perpendicular to the main wing section, this
contribution is negligible.
Drag, D
has contributions due to skin-friction, lift, and the elevator used to trim the sail in a
desired configuration:
D=qSLS CD0 +kCL2 +CDδeδe
(4.20)
where the coefficient of lift expression can simply be borrowed from Eq. 4.19:
CL=CL0+CLαα+CLδeδe (4.21)
Side Force, Ay
The aerodynamic side force also has three contributions:
Ay =qSLS Cy0 +Cyββ+Cyδeδe
(4.22)
The side force would be much smaller compared to lift or drag.
The aerodynamic coefficients for forces, in general, are functions of Reynolds number, Mach
Aerodynamic Moments
The aerodynamic moments are also best expressed in the stability frame, S. In the stability frame, the aerodynamic moments are simply rolling, l, pitching, m, and yawing moments,n:
n
~ Maero
o
F = F[c]S
l m n =
lcos(α)−nsin(α)
m
lsin(α) +ncos(α)
(4.23)
Aerodynamic moments are sensitive to the location of evaluation. In this instance, all
aerody-namic moments are evaluated at the center of mass to avoid correction factors. Each component
of the aerodynamic moment can be further broken down into contributing elements in a Tayor series expansion form:
Rolling Moment, l
The rolling moment has three contributions that are scaled by dynamic pressure, reference area, and reference span:
l=qSLSb Cl0+Clββ+Clδeδe
(4.24)
In the case of the sail, all three component change significantly with angle of attack. As
Chapter 3.1 showed that the distance between the center of lift and center of mass must
be large for an efficient design, the rolling moment is significant in magnitude.
Pitching Moment, m
The pitching moment is crucial for configuring the sail to produce the desired amount of
lift. The pitching moment has three significant contributions:
m=qSLSc Cm0 +Cmαα+Cmδeδe
(4.25)
δe is adjusted to achieve equilibrium in the desired angle of attack condition.
Yawing Moment, n The yawing moment has three contributions:
n=qSLSb Cn0 +Cnββ+Cnδeδe
(4.26)
The coefficient contributing to yawing moment change significantly with angle of attack.
The aerodynamic coefficients for moments, in general, are functions of Reynolds numbers,
Moment Due to Tether Attachment
The moments due to tether attachment can be evaluated using cross products. Eq. 4.17 provides
an expression for tension in the sail-body frame. The moment arm can be simplified without
loss of generality as:
~
rT /cm F =
xT F yT F
0 (4.27)
As a result, the expression for moment due to tether attachment is:
n ~ MT o F = n ~
rt/cm× −T~
o
F =−
TzFyT F
−TzFxT F TyFxT F −TxFyT F
(4.28)
In general, a tether can exert a moment on the sail at the attachment location. This moment
is generated by twisting of the tether about its axis [20]. However, since the tether in this problem
is extremely long, this moment can be assumed to be negligible.
Summation of forces and moments on the sail provide six equations towards the larger
system of equations required to solve for the equilibrium of the balloon and sail system. Eq.
4.17 provides an additional three equations required express the tension force in the correct frame of reference.
4.5
Equilibrium Conditions
In the conventional sense, equilibrium requires that sum of forces and moments is zero. In the
strictest sense of this requirement, a particle or body being analyzed can be in equilibrium
while in motion with constant translational and angular velocities. These conditions have to be modified for the balloon-sail system to achieve an equilibrium solution. Additional conditions
are imposed on both the balloon and the sail.
In equilibrium, the balloon translates with the wind. However, the velocity along the di-rection of altitude must be identically zero for equilibrium. If the balloon is changing altitude,
the forces of gravity and buoyancy create a net force on the balloon. However, the balloon can
sustain a relative wind in the direction of altitude - the equilibrium altitude would be different if the relative wind was absent. Mathematically, this condition is:
VBLN yO= 0 or
VBW yO =−VBLN−RelyO
![Figure 1.1:Evolution Of Balloon Design[1]](https://thumb-us.123doks.com/thumbv2/123dok_us/1267388.1159297/13.612.106.530.86.332/figure-evolution-of-balloon-design.webp)
![Figure 1.2:NASA’s ≈ 200, 000m3 ULDB Over Antarctica [2]](https://thumb-us.123doks.com/thumbv2/123dok_us/1267388.1159297/14.612.226.405.70.278/figure-nasa-s-m-uldb-antarctica.webp)
![Figure 1.3:Balloon With Aerodynamic Sail (Not To Scale) [3]](https://thumb-us.123doks.com/thumbv2/123dok_us/1267388.1159297/15.612.260.377.72.374/figure-balloon-aerodynamic-sail-scale.webp)