Perception on Their Problem Solving Ability
Nor Fadila Amin1, Adibah Abdul Latif2, Wilfredo Herrera Libunao3, Sarimah Ismail4, Mahyuddin Arsat5, Nornazira Suhairom6
Abstract
The main purpose of this study is to measure changes of students' perception on their problem solving ability over time by using Rasch Measurement Model. Pre-experimental with one group pretest-posttest design was conducted to investigate how web-based learning system of design education, known as PROUD, affected students' perceptions on their problem solving ability. Thirty second year students pursuing their bachelor degree in technical and vocational education participated in the study. Respondents utilized PROUD for 14 weeks in the process of learning design. Problem Solving Inventory was used as a research instrument and appeared valid and reliable to measure the changes. A pretest was administered at the beginning of the course and a posttest after the learning completed. Changes in the students' perceptions on their problem solving ability were gauged using the rack and stack analysis. A paired sample t-test was also included in the data analysis. Result of the pretest and posttest were -0.147 ± 1.554 logits and -0.749 ± 0.980 logits, respectively. These findings indicate that the perceptions of the students on their ability to solve problem have increased significantly after using the PROUD (paired sample t-test, p = 0.032). These have proven that the use of PROUD changes the students' perception on their own problem solving ability throughout the learning process of design.
1,2,3,4,5Senior Lecturer, 6Tutor, Faculty of Education, Universiti Teknologi Malaysia, 81310 Johor
Introduction
Teaching and learning process of design is a phenomenon that often receives great attention of many researchers in the field of design education (Ozturk, 2010; Choi, 2009; Siang & Duffy, 2004). Design education covers a very large area where it combines theoretical and practical aspects, art and science, teamworking, creative problem solving process, materials and multimedia contents.
Horváth (2006) in his studies have discussed the changes that need to be done to enhance teaching and learning of design education. He discovered students are only equipped with the competencies that help them to pass in examination alone and not to solve design problem systematically and innovatively. However in recent years, many studies have been carried out on the design problem solving ability and the various aspects of design competencies (Van Doorn, Moes & Fain, 2008; Overbeeke et al., 2004; Bakarman, 2005).
Competency is defined as the comprehensive capability to perform something in an effective and successful ways. It consists of a set purposeful set of behaviours that enables achieving design goals (Horvarth, 2006; Lewis & Bonollo, 2002). Competency enables problem solving in known and unpredicted situations. There are various views concerning competency that formed design capability.
The rapid advancement of information and technology has had a significant impact on design education. The flexible web environment has been proven to be one of an effective way of delivering teaching and learning of design education. In design education, optimal learning can effectively happen in the simulation of real world and problem-based learning activities. Learning activities occur in a safe environment where errors are expected and failure will expand students’ learning experiences. Such learning environment can enhance students’ critical thinking, creativity, problem solving skills and outstanding performance. PROUD is a web-based learning system which has been developed to cater the needs of teaching and learning of design education in higher learning institutions. The flexible and multi-dimensional pedagogies underlying the system will promote and accelerate meaningful its learning process. To date, only a few research has been done to improve students' ability in solving design problems. This study is significant for design education students because an educational intervention program such as PROUD will assist and encourage students to be more active in their learning. Students will take more responsibility for their own learning and this apparently will benefit their personal development.
Materials and Methods
A very few research has been conducted emphasizing the Rasch measurement model and its benefits in interpreting change in measure over time. The primary purpose of this study is to use the method of racking and stacking students' perception on their problem solving ability data within the Rasch measurement model to measure their changes over time after using PROUD in learning design education.
ability to studying design education. Thirty second year students pursuing their bachelor in education degree program participated in this study. Data were gathered from administering Problem Solving Inventory - Technology (PSI-TECH) test to the respondents before and after the completion of a one semester design education course. PSI-TECH is a modification of the original instrument Problem Solving Inventory (PSI) developed to assess the individual's perception of their attitude and behaviour in problem solving (Heppner and Baker, 1997; Heppner, 1988). Wu, Custer & Dyrenfurth, (1996) have made a modification on the instruction part of PSI to shift the focus of the respondent from the aspects of personal problem solving to technological problem solving. According to Scott, Koch & Stover (2009), PSI-TECH is an instrument that can help researcher understands the approach to problem solving among students of design.
Rasch measurement model, also known as the Rasch model is a model in Item Response Theory families (IRT) was developed as a result of considerations of the abilities of each individual or respondent who answered the questionnaire, test or instrument and the item difficulty of each test or item (Rasch, 1980). According to Linacre (2011); Bond & Fox (2007), Rasch model can be used to ensure the instrument measuring ability. In examining the extent to which the data fit to the model, items that contributed to the misfit can be easily identified and the instrument can be modified accordingly. In this study, the Rasch model with racking and stacking method was applied to determine the changes in students' perceptions of the ability to solve problems after using PROUD.
time by racking the data. By stacking the data, the Rasch model can be used to examine changes in person (changes in student performance) over time. The Winstep Rasch measurement software was used to perform Rasch analysis of the respondents' pre PSI-TECH and post PSI-TECH test data. Both data were "racked" and "stacked" before continuous measures were produced for the categorical responses of PSI-TECH tests. Racking and stacking allows the treatment on both pretest and posttest data (Wright, 2003). Then, Rasch analysis of the items was performed as if they were a 58 items instrument and item locations (measure) for each item were produced. Subsequently, stacking the data was conducted by appending vertically two separate sets of respondents as if they were 60 respondents involved in the study. Through the Rasch analysis, person locations for each respondent were calculated. Finally, changes in students' percepions on their problem solving ability were determined by subtracting the post PSI-TECH measures from pre PSI-TECH measures. A paired sample t-test was applied for statistical inferences a difference in change between the tests.
Results and Discussions
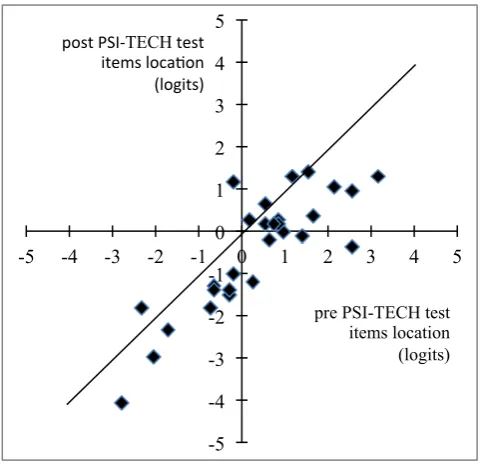
learning addressed by the items. For example, pre PSI-TECH test for item 6 (After I have tried to solve a problem with a certain course of actions, I take time and compare the actual outcomes to what I thought should have happened) was at 1.29 and at 1.17 in the post PSI-TECH test. The negative change in location (-0.12) signified that students as a group started to less agree about trying to scrutinize the solutions and perceived they are less able to solve problem in learning after the intervention. Figure 1 shows the scatterplot of post PSI-TECH test location against pre PSI-TECH test location for all items. The line y = x indicated no change in item difficulty. Points below the line represent items for which the change in location was negative. Items with small changes in location are located close to the line.
Fig. 1. Pre PSI-TECH test and post PSI-TECH test locations for all items, with the line y=x.
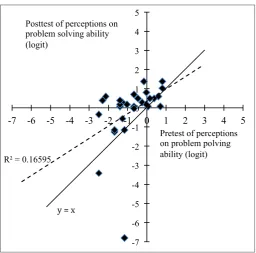
A primary interest with the stacked data was pre PSI-TECH test and post PSI-TECH test locations of each student. Negative changes in locations signify high level of perceptions of problem solving ability in learning after the intervention. Most of the students, 80%, perceived that their problem solving ability in learning increase at the end of the semester. All points below the line y = x show that post TECH locations were greater than pre
PSI--5 -4 -3 -2 -1 0 1 2 3 4 5
-5 -4 -3 -2 -1 0 1 2 3 4 5 post PSI-‐TECH test
items loca0on (logits)
TECH locations. The scatterplot in Figure 2 points that are close to the line y = x indicate marginal increase in perceptions of the ability, whereas points distant and below the line y = x depict greater level of increment. By analyzing the gap between the least square regression line the line y = x, increment level of perceptions for students with low pre PSI-TECH test locations likely to be higher than increment for students with higher pre PSI-TECH locations. Students who started the lesson with low level of perceptions to solve problem in learning may benefit more from the intervention than their peers who started with higher level of perceptions.
Fig. 2. Pre PSI-TECH test and post PSI-TECH test person locations, with the least square regression line for the data (dotted) and the line y = x.
At the beginning of the semester, students' level of perceptions of their problem solving ability were -0.147 ± 1.554 logits and the level increased after the intervention at -0.749 ± 0.980 logits. As shown in Table 1, changes in students' perceptions were significant after the intervention (paired t-test, p = 0.032). Rasch analysis of racking stacking indicated students'
R² = 0.16595
-7 -6 -5 -4 -3 -2 -1 0 1 2 3 4 5
-7 -6 -5 -4 -3 -2 -1 0 1 2 3 4 5 Posttest of perceptions on
problem solving ability (logit)
Pretest of perceptions on problem polving ability (logit)
perception of the problem solving ability had significantly increased at the end of the semester.
Table 1 T-test result for pre and post mean logits response for PSI-TECH
PSI-TECH Test N Meann Std. Dev t df sig
Pre 30 -0.147 1.554 2.256 29 .032*
Post 30 -0.749 0.980
*p < .05
Conclusion
The results from stacked data indicated students' perceptions on their ability of problem solving changed significantly after the using of PROUD in the process of learning design education. This finding provides meaningful interpretation to evaluate the impact of web-based learning system for design education, PROUD, on the ability of problem solving among student. The outcomes from the racked data denoted the majority of items showed an increase in item difficulty in post PSI-TECH test. Items which are unexpectedly decreasing in difficulty in the posttest should be further studied to discover potential factors that contribute to the occurrence. On the other hand, the results from the stacked data depicted the majority of students more agreed that they are more confident towards their problem solving ability at the end of the semester. This study verified that the implementation of PROUD in learning design education had encouraged the development of students' problem solving ability. The methods of racking and stacking manifested an effective way to scrutinize data collected at multiple points of time. Researchers involved in any technical and vocational course development can use these findings to develop more technology-based instructional materials to stimulate the development of problem solving ability.
This study was supported by a Fundamental Research Grant Scheme, Universiti Teknologi Malaysia. The authors would like to acknowledge staffs and students at Faculty of Education and Research Management Centre, Universiti Teknologi Malaysia for all the supports and professional assistance during the process of completion of the study.
References
Bakarman, A. A. (2005). Attitude, Skill and Knowledge : (ASK) A New Model for Design Education. In Proceedings of the Second CDEN Design Conference on Design Education, Innovation and Practice. 18 - 20 Julai. Alberta, Canada. Retrieved on 22nd January 2007, from http://www.hdl.handle.net/123456789/6687
Bond, T. G. and Fox, C. M. (2007). Applying the Rasch Model : Fundamental Measurement in the Human Sciences. (2nd ed.). New Jersey : Lawrence Erlbaum Associates.
Choi, Sooshin (2009). Open and Adaptable Design Education for Design Innovation. Retrieved on 18th February 2010, from http://www.icsid.org/ education/ education/articles1061.htm
Cross, N. (2007). Designerly Ways of Knowing. Basel, Switzerland : Birkhauser.
Eggleston, J. (1996). Teaching Design and Technology. (2nd ed.). Buckingham, UK : Open University Press.
Eggleston, J. (1994). What is Design and Technology Education. Dalam F. Banks (ed.). Teaching Technology. (pp. 20 – 41). London : Routledge.
Harris, M. dan Wilson, V. (2003b). Designing the Best : A Review of Effective Teaching and Learning of Design and Technology. International Journal of Technology and Design Education. 13, 223 – 241.
Heppner, P. P. and Baker, C. E. (1997). Applications of Problem Solving Inventory. Measurement dan Evaluation in Counseling dan Development. 29 (4), 229 – 242.
Heppner, P. P. (1988). The Problem Solving Inventory (PSI) – Research Manual. Palo Alto, California : Consulting Psychologist Press, Inc.
Horváth, I. (2006). Design competence development in an academic virtual enterprise. In
ASME 2006 International Design Engineering Technical Conferences and Computers
and Information in Engineering Conference (pp. 383-392). American Society of
Mechanical Engineers.
Lewis, W. and Bonollo, E. (2002). An Analysis of Professional Skills in Design : Implication for Education and Research. Design Studies. 23(4), 385 - 406. DOI : 10.1016/j. physletb.2003.10.071
Linacre, J.M. (2011). Winsteps® Rasch Measurement Computer Program User's Guide. Beaverton, Oregon : Winsteps.com
Niku, B. S. (2009). Creative Design of Production and System. Hoboken, New Jersey : John Wiley & Sons.
Overbeeke, K., Appleby, R., Janssen Reinen, I. and Vinke, D. (2004). Nine Competencies, Six Units : Industrial Design Education at TU/E. In Proceedings of International Engineering and Product Design Education Conference. 2 - 3 September. Delft, Netherland, 1 - 8.
Rasch, G. (1980). Probailistic Models for Some Intelligence and Attainment Tests. Chicago : The University of Chicago Press.
Renwick, P. (2004). Teaching and Evaluating the Problem Solving Process. Dalam P. Wong, P. Renwick, J. Tan dan Yau Che Ming (eds.). Starting to Teach Design and Technology : A Helpful Guide for Beginners Teachers. (pp. 3 – 12). Singapore : Prentice Hall. Scott, S. K., Koch, D. S. and Stover, A. (2009). Problem Solving Approach and Success in a
Design Project. In Proceeding of 63rd Annual Midyear Conference of the Engineering Design Graphics Division of ASEE. 4 – Januari. Berkeley, California. Dicapai pada 23 Februari 2010 daripada http://edgd.asee.org/conferences/ proceedings/63rdMid/papers/scott_koch_stover_tuesday.pdf
Siang, K. S.and Duffy, A. H. B.(2004). Evolving a Model of Learning in Design. Research in Engineering Design. Volume 15, Number 1, 40 – 61.
Van Doorn, E., Moes, N. and Fain, N. (2008). Attitude Development in Designers' Education. In Proceedings of the TMCE 2008. 21 - 25th April. Izmir, Turkey. Retrieved on 13th April 2010, from http://www.ellemieke vandoom.nl/bestanden/Attitude_development _in_ designers_education.pdf
Wright, B. D. (2003). Rack and Stack : Time 1 vs. Time 2 or Pre-Test vs. Post-Test, Rasch Measurement Transactions, 17 (1), 905 - 906. Retrieved on 14th March 2012 from http://www.rasch.org/rmt/rmt171a.htm