Maxine Seaborn Thompson).
second generation Caribbean Black Americans show no significant effects of religiousness items on depression, first generation Caribbeans benefit from religious organizational involvement. In contrast, their mental health is threatened by increasing emotional and tangible religious support. I discuss these findings as they relate to the historical legacy of racism in the Caribbean and the U.S., measurement issues surrounding depression, and the resources available to immigrants. In Chapter 4 I find limited support for the argument that discrimination will promote political involvement. Perceptions of discrimination against oneself are not significantly associated with increases in political participation. Surprisingly, individual-level discrimination and perceptions of group discrimination are not associated with Black advancement organization membership either. Perceiving no change in racial discrimination over the past 20 years, however, increases political participation (i.e., the probability that one will vote, participate in political campaigns, or contact political officials). Perceptions of group discrimination appear to be particularly
by
Rachel Nicole Head
A dissertation submitted to the Graduate Faculty of North Carolina State University
in partial fulfillment of the requirements for the degree of
Doctor of Philosophy
Sociology
Raleigh, North Carolina 2013
APPROVED BY:
_______________________________ ______________________________
Dr. Maxine Seaborn Thompson Dr. Rick DellaFave
Committee Chair
________________________________ ________________________________
DEDICATION
BIOGRAPHY
ACKNOWLEDGMENTS
There are many people I would like to thank for their contribution to this work and my academic success. When I first began my college journey, I scarcely dreamed of earning a doctorate. It was Dr. Russell McCutcheon, however, who inspired me to think critically about social issues and to see myself as someone who could contribute to intellectual discourse. The late nights I spent reading the works he suggested by authors such as Michel Foucault and Roland Barthes shaped my thinking immeasurably and I will always see Dr. McCutcheon’s guidance as instrumental in molding my thinking about the social world. I would also like to thank Dr. James Markusic for being a mentor and advocate as I went through the graduate application process.
Thank you to Dr. Harold Grasmick, who served as my mentor during my time at the University of Oklahoma. His guidance (both professionally and personally) was instrumental in helping me to make the transition from being a student to a scholar and colleague. I would also like to thank my fellow graduate student at the time, Miyuki Fukushima, whose feedback and support also made the graduate school process that much more fulfilling.
I have had the opportunity to work with several wonderful scholars at NC State. Dr. Maxine Thompson has been my advocate, mentor, and friend. She believed in me and
inspiration to me since I first came to NC State. His intellect is exceeded only by his kindness and I am truly grateful to have learned from and worked with him.
I have also benefitted immeasurably from the graduate student community at NC State. I would especially like to thank Joslyn Brenton, Carissa Froyum Roise, Andrea Hunt, Christine Mair, R.V. Rikard, and Lisa Tichavsky. Carissa’s encouragement and guidance helped me survive those first years of graduate school. I am indebted to her for both her intellectual insights and emotional support. As my officemate during those early years, Andrea and I commiserated with one another about the challenges of graduate school and celebrated our successes. As our lives (and families) have grown and changed, she has continued to be a good friend and source of support. I would also like to thank R.V. Rikard for his friendship and for navigating the world of publishing with me.
TABLE OF CONTENTS
LIST OF TABLES ... viii
LIST OF FIGURES ... ix
CHAPTER 1 ... 1
Perceived Discrimination, Coping, and Well-Being ... 4
A Note on the Politics of Classification ... 6
Data ... 7
Measuring Perceived Discrimination ... 10
The Analysis Ahead ... 11
CHAPTER 2 ... 17
Predictors of Perceived Racial Discrimination among the U.S. Black Population: Exploring Ethnic Variations ... 17
Structural Assimilation and Perceived Discrimination ... 22
Segmented Assimilation: The Role of Cultural Assimilation ... 24
Structural Assimilation, Cultural Assimilation, and Perceived Discrimination ... 26
The Present Study ... 27
Measures ... 29
Analytic Strategies ... 34
Results ... 36
Conclusion ... 41
CHAPTER 3 ... 56
Racism-Related Anger, Religiousness, and Depression: Ethnic and Immigrant Variations among Black Americans ... 56
Perceived Discrimination and Depression: The Role of Racism-Related Anger ... 58
Racism, Anger, and Social Support ... 62
Racism, Anger, Religiousness, and Depression ... 65
The Present Study ... 68
Measures ... 69
Analytic Strategies ... 72
Results ... 73
Conclusion ... 77
CHAPTER 4 ... 94
The Politics of Racism: Racial Discrimination, Health, and Political Involvement among African Americans and Caribbean Black Americans ... 94
Perceived Discrimination, Political Involvement, and Health ... 95
Caribbean Black Americans and Political Involvement in the U.S. ... 101
The Present Study ... 103
Measures ... 105
Analytic Strategy ... 109
Results ... 110
Conclusion ... 115
CHAPTER 5 ... 130
Perceiving Racism, Perceiving Opportunity ... 132
Racism-related Anger, Religiousness, and Mental Health: Balm in Gilead or Snake Oil? .... 135
The Politics of Racism ... 139
Policy Implications ... 142
Conclusion—The Paradox of Inclusivity ... 145
REFERENCES ... 148
APPENDICES ... 165
Appendix A ... 166
Appendix B ... 172
LIST OF TABLES
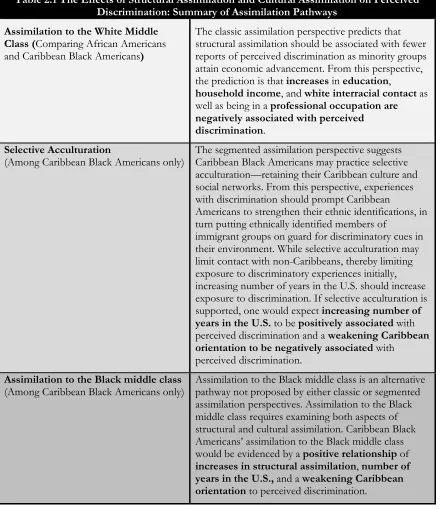
Table 1.1: Sociodemographic Unweighted Distribution of the NSAL-SAQ by Ethnicity ... 24 Table 1.2: Unweighted Sample Characteristics for Black Caribbean Americans, NSAL-SAQ .. 25 Table 1.3: Weighted Descriptive Statistics for Major Discrimination Items ... 26 Table 1.4: Weighted Descriptive Statistics for Day-to-Day Discrimination Items ... 27 Table 2.1: The Effects of Structural Assimilation and Cultural Assimilation on Perceived
Discrimination: Summary of Assimilation Pathways ... 57 Table 2.2: Weighted Means, Standard Errors, and Difference Significance Tests ... 58 Table 2.3: Perceived Lifetime Major Discrimination and Day-to-Day Discrimination: Results for Structural Assimilation Items ... 59 Table 2.4: Perceived Lifetime Major Discrimination and Day-to-Day Discrimination: Results for Cultural Assimilation Items among Caribbean Black Americans ... 62 Table 2.5: Predicted Probability of Reporting Any Major Discrimination and Frequent
Day-to-Day Discrimination for Caribbean Black Males by Structural Assimilation and
Cultural Assimilation ... 63 Table 3.1: Weighted Means, Standard Errors, and Difference Significance Tests ... 95 Table 3.2: Logistic Regression of Major Depressive Disorder in the Past 12 Months on
Discrimination, Anger, Religiosity Items, and Interactions ... 96 Table 4.1: Weighted Means, Standard Errors, and Difference Significance Tests ... 129 Table 4.2: Logistic Regression Models for Political Participation, Black Adv. Organization
LIST OF FIGURES
Figure 2.1: Effects of Structural Assimilation, Weak Caribbean Orientation, and Number of
Years in the U.S. on the Probability of Reporting Major Lifetime Discrimination ... 64
Figure 2.2: Effects of Structural Assimilation, Weak Caribbean Orientation, and Number of Years in the U.S. on the Probability of Reporting Frequent Day-to-Day Discrimination ... 65
Figure 3.1: Conceptual Model of Perceived Day-to-Day Discrimination, Anger, Religious Social Support, & Major Depressive Disorder ... 94
Figure 3.2: Interaction between Anger and Day-to-Day Discrimination ... 99
Figure 3.3: Main Effects of Religious Organizational Participation and Religious Tangible Support ... 100
Figure 3.4: Interaction between Anger and Religious Emotional Support ... 101
Figure 3.5: Interaction between Anger and Religious Tangible Support ... 102
Figure 4.1: Conceptual Models of Racism, Political Involvement, & Health ... 131
Figure 4.2: Predicted Probability of Political Participation ... 134
Figure 4.3: Predicted Probability of Black Advancement Organization Membership ... 135
CHAPTER 1
Why do black immigrants do so much better than blacks who are born in America? It is an unpopular question, but one that demands an answer. (“Black Like Me,” The Economist, May 11, 1996)
In the early 2000s, a debate was reignited around the role of culture in the problems facing low-income African American communities. The culture of Black communities was put on trial as the Boston Globe, New York Times, and The Economist ran features and editorials examining the “cultural patterns” of Black communities. Many of these pieces highlighted the economic and social disparities between African Americans and Black immigrants. For example, first generation Black immigrants have higher employment rates (Dodoo 1997; Farley and Allen 1987; Model 1995; Thomas 2012) than native Black Americans. Twenty-five percent of Black immigrants over 25 years of age have a bachelor’s degree, compared with 16 percent of African Americans (Census 2004). Black immigrants are also disproportionately represented at elite universities (Rimer and Arenson 2004).
While some scholars contend that Caribbean Black Americans’ successes suggest the declining significance of structural racism (Patterson 2006), these favorable outcomes—like the more favorable outcomes of all immigrants groups compared to their native racial
counterparts—are largely the result of Black immigrants being a highly motivated, self-selected group (Model 2008). As Ta-Nehisi Coates (2009) of The Atlantic claims, “comparing any immigrant group to virtually any native-born group is like comparing the most ambitious members of one team with the entirety of another team.” Furthermore, this “black success story” is limited to immigrants from the English-speaking former British colonies, with Caribbean immigrants from the non-English-speaking Caribbean trailing behind African Americans (Kalmijn 1996).
If the story of Black Caribbean immigrants in the U.S. tells us anything, it is the enduring legacy of racism in America. The relatively large number of Africans compared to Europeans in the Caribbean has led to a complex tripartite racial model in the Caribbean that ranks individuals based not only on skin color but on access to power and prestige as well (Vickerman 2001; Waters 1999). The result is that many Caribbean Black Americans do not view race as salient to their identities (Vickerman 1999). As Vickerman notes, for Caribbean Black immigrants, “race carries far more serious consequences in [the United States] than it does in their home societies” and this growing realization is often met with disillusionment in the promises of the American dream (1999: 93).
has developed (Bonilla-Silva 2001). Characterized by race-neutral language, covert and often invisible means of achieving and maintaining white advantages, incorporation of “safe minorities” to signify racial inclusivity, and the continued use of racial practices (e.g.,
segregation), the “new racism” is often difficult to detect (Bonilla-Silva 2001: 90). Because the new racism is difficult to detect, it is also difficult to measure. Constructing scales for perceived discrimination and methodological approaches, such as matched pair testing, are a few ways in which researchers attempt to measure and assess the influence of the new racism on life chances. Thus, understanding the extent to which individuals perceive themselves as victims of prejudicial or discriminatory treatment because of group membership and view that treatment as unfair is one of the few avenues for understanding the influence of discrimination on life chances.
However, it is important to distinguish between being exposed to racism and perceiving one’s self to be the target of racism as “discrimination can occur without being perceived by the person being discriminated against, and, conversely, it can be perceived in cases where it did not occur” (Phinney, Madden and Santos 1998: 938). In this sense, perceived discrimination is a cognitive appraisal of the extent to which an event or encounter is harmful (Major, Quinton and McCoy 2002). While studies have examined attributions to discrimination among African Americans (Branscombe, Schmitt and Harvey 1999), across minority groups (Greene, Way and Pahl 2006), and comparing Whites and African Americans (Ruggiero and Major 1998), no study has examined differences in perceived discrimination among Black Americans based on
ethnicity.
trump ethnicity in shaping perceptions of discrimination? I also examine what factors contribute to perceptions of discrimination among the two groups. In addition to addressing what factors shape perceptions of discrimination, I assess what resources are helpful in addressing the discrimination-health relationship in Chapters 3 and 4. The resources for dealing with perceived discrimination may be different for African Americans and Caribbean Black Americans— especially Caribbean immigrants. There is evidence to suggest that Caribbean Black American immigrants are less likely to make discriminatory attributions and, when they do attribute negative outcomes to discrimination, they are less inclined to utilize confrontational coping strategies. For immigrants, cognitively reframing racist encounters may be one way of coping with discrimination. This may reflect differential access to social support as well as lack of familiarity or access to political redress (Lalonde, Majumder and Parris 1995).
Perceived Discrimination, Coping, and Well-Being
Racial discrimination is a harmful reality for many racial and ethnic minorities. In addition to influencing the economic well-being of racial minorities, perceived racial
with distress, Kessler and colleagues contend, “given its high prevalence, wide distribution, and strong associations with mental health, perceived discrimination needs to be treated much more seriously than in the past in future studies of stress and mental health” (Kessler, Mickelson and Williams 1999: 208). While overt racist acts can clearly have deleterious health effects, the continuing accumulation of racial slights and injustices are an important factor in the health of racial minorities as well.
The stress process offers a useful framework for understanding the impact of perceived discrimination on health (Pearlin 1989). As a stressor, perceived discrimination effects health indirectly through the anxiety and tension it may create for the individual. This anxiety and tension can eventually manifest itself in increased stress reactivity, hypertension, and poorer mental health. Targets of discrimination, however, may mobilize resources in response to discrimination that ameliorate negative affect and/or help the person to address the
discriminatory situation (Thoits 1995). The type of coping strategy used is dependent upon the nature of the discriminatory event. For example, Greene (1995) contends that different coping strategies may be utilized in dealing with covert versus overt discrimination. Feagin (1991) interviewed African Americans about their experiences with racial discrimination and found that both active coping (i.e., verbal confrontation) and passive coping (i.e., withdrawal) were
common strategies. He also found that African Americans often take a “long-look approach” to naming discrimination—carefully assessing whether the act was discriminatory and the
appropriate response. This can sometimes lead to missed opportunities for active coping. Studies examining the link between coping with discrimination and well-being among African
(Krieger 1990; Williams et al. 1997). For example, Krieger found that African American women who passively accepted discrimination were 4.4 times more likely to report hypertension than women who tried to do something about the discrimination and sought social support from others (Krieger 1990).
A Note on the Politics of Classification
I anticipate differences in the perceptions of and coping with discrimination for African Americans and Caribbean Black Americans. First, the extent to which Caribbean Black
immigrants are integrated into U.S. society should affect not only their perceptions of
discrimination, but the resources they have for dealing with it. In his classic study of European immigrants at the turn of the 20th Century, Gordon (1964) posited five stages of successful
assimilation to the American mainstream—cultural assimilation, secondary structural
Differences in integration into U.S. society should also shape the coping resources employed by individuals as well as foreshadow the effectiveness of those strategies. Noh and colleagues found that passive coping strategies among recent Korean immigrants were more beneficial for mental health than active coping strategies (Noh et al. 1999). However, among Korean immigrants with more social capital, including “extremely high levels of education, stable marriage and employment situations, above average family incomes, and an average of 20 years of residency,” active coping was more adaptive (Noh and Kaspar 2003: 237). Social support networks may have direct effects on immigrants’ well-being as well as indirect effects by shielding one from the negative health effects of discrimination.
In this study, I assess the roles that assimilation and social resources play in perceiving and coping with discrimination among African Americans and Caribbean Black Americans. It has not eluded me, however, that intergroup comparisons can often reify groups—ignoring that there is as much difference within groups as between them (Kasinitz et al. 2008). At worst, group comparisons can be read as racist generalizations. My intention in making group
comparisons is not to treat these categories as absolute or ignore the multiplicity of overlapping identities that define the individuals in this study. Instead, I hope to demonstrate how ethnic group membership shapes perceptions of discrimination, the resources available for dealing with those experiences, and their consequences for health.
Data
2001-2003). The NSAL is a cross-sectional data set of individuals 18 years of age and older, designed to examine racial and ethnic differences in psychological disorders, distress, and service use. The NSAL is unique in that it provides the first ever national sample of Caribbean Black Americans, the majority of whom are from or trace their heritage to Barbados, Guyana, Haiti, Jamaica, Puerto Rico, and Trinidad-Tobago. The survey population excludes institutionalized persons, individuals living on military bases, and non-English speakers.
The sample frame included a four-stage national area probability sample: (1) a primary stage sampling of U.S. Metropolitan Statistical Areas (MSAs) and counties; (2) a second stage sampling of area segments; (3) a third stage sampling of housing units; (4) and a fourth stage random sampling of eligible household respondents. In the primary stage, 21 of the strata contained only a single self-representing (SR) metropolitan primary stage unit (PSU). Each SR PSU was included in the sample with certainty in the primary stage of selection. For the remaining primary stage strata containing more than one PSU, one PSU was sampled with probability proportionate to the number of occupied housing units reported in the 1990 census (Heeringa et al. 2004). To supplement the Caribbean Black American sample, additional
sampling of metropolitan areas with a concentration greater than 10 percent of Caribbean Black Americans was conducted. Face-to-face interviews were administered in rural and urban areas with significant numbers of Black Americans between 2001 and 2003. The main sample included 3,570 African Americans and 1,621 Black Caribbean American respondents, for a total sample of 5,191.
resources, racial identity, meritocracy beliefs, and political involvement, among other concepts. All NSAL respondents were asked to participate in the mailback NSAL-SAQ. The response rate for African Americans (n = 2,137) was 59.9 percent and 42.9 percent for Black Caribbean Americans (n = 695), resulting in a final sample size for the current study of 2,832. While there were few demographic differences between the main NSAL sample and the NSAL-SAQ sample, survey weights for the NSAL-SAQ factor in the higher response rates among females, the unemployed, the more highly educated, and those who participated in the original survey post-September 11, 2001.
Table 1.1 provides unweighted sociodemographic characteristics for the NSAL-SAQ by ethnicity. The mean age of the African American sample is 44.3 years, compared to 41.7 years for Caribbean Black Americans. Caribbean Black Americans have higher mean levels of
education (13.3 years; s.d. 2.7) and annual household income ($41,775; s.d. 35,200) compared to African Americans who average 12.4 years of education (s.d. 2.5) and $30, 344 (s.d. 28,128) in annual household income. In addition, the majority of the African American sample resides in the south (64.7%) while the majority of the Black Caribbean American sample resides in the Northeast (71.5%).
Table 1.1 Here
Table 1.2 Here Measuring Perceived Discrimination
Perceived discrimination is included in all three empirical chapters. I, therefore, discuss its measurement here in order to avoid redundancy. The measurements of other variables in the analyses are discussed later. In measuring perceived discrimination, I draw from Kessler,
Table 1.3 Here
Everyday discrimination is measured with items asking the respondent if he or she has ever: (1) been treated with less courtesy than others, (2) been treated with less respect than others, (3) received poorer restaurant service than others, (4) had people act like you are not smart, (5) had people act afraid of you, (6) had people act like you are dishonest, (7) had people act better than you, (8) been called names or insulted, (9) been threatened or harassed, or (10) been followed in stores. Response options include 0 (“never”), 1 (“less than once a year”), 2 (“a few times a year”), 3 (“a few times a month”), 4(“at least once a week”), and 5 (“almost everyday”).
Conducting a principal components analysis, I found strong support for a single factor with an eigenvalue of 6.150 and no other eigenvalues greater than 1.0. Day-to-day discrimination ranges from 0 to 50 with approximately 46% of the African American sample and 48% of the
Caribbean Black American sample reporting zero experiences of day-to-day discrimination. Approximately 12 percent of the total sample reports experiencing at least one these items almost everyday. The day-to-day discrimination scale has an alpha of 0.933 for African Americans and 0.946 for Caribbean Black Americans.
Table 1.4 Here The Analysis Ahead
Table 1.1. Sociodemographic Unweighted Distribution of the NSAL-SAQ by Ethnicity* Participants, No. (%)
Indicator
Black Caribbean Americans
(n = 695)
African Americans (n = 2,137)
Age (in years)
18-25 122 (17.55) 278 (13.07) 26-35 158 (22.73) 428 (20.11) 36-45 161 (23.17) 498 (23.40) 46-55 124 (17.84) 419 (19.69)
≥ 56 130 (18.71) 505 (23.73) Sex
Male 242 (34.8) 693 (32.4) Female 453 (65.2) 1444 (67.6) Work Status
Employed 491 (70.7) 1328 (62.2) Unemployed 73 (10.5) 248 (11.6) Not in labor force 131 (18.8) 560 (26.2) Education (in years)
0-11 113 (16.2) 563 (26.3) 12 189 (27.2) 795 (37.2) 13-15 307 (44.2) 647 (30.3)
≥ 16 86 (12.4) 132 (6.2) Annual Household Income
0-17,999 164 (23.6) 855 (40.0) 18,000-31,999 196 (28.2) 543 (25.4) 32,000-54,999 148 (21.3) 431 (20.2)
≥ 55,000 187 (26.9) 308 (14.4) Marital Status
Married/Cohabitating 299 (43.0) 727 (34.0) Divorced/Separated/Widowed 161 (23.2) 739 (34.6) Never Married 235 (33.8) 670 (31.4) Birthplace
Born in U.S. 218 (31.5) 2101 (98.6) Born outside U.S. 474 (68.4) 28 (1.3) Region
Table 1.2. Unweighted Sample Characteristics for Black Caribbean Americans, NSAL-SAQ*
Participants, No. (%)
Indicator
Black Caribbean Americans (n = 695)
Caribbean Ethnic Origins
Spanish Caribbean 86 (12.5) Haiti 104 (15.1) Jamaica 217 (31.4) Trinidad/Tobago 80 (11.5) Other 203 (29.4) Birthplace
Born in U.S. 218 (31.5) Born outside U.S. 474 (68.4) Years in the U.S.
≤ 5 50 (7.6) 6-10 69 (10.4) 11-20 154 (23.4)
≥ 21 386 (58.6) Age at time of immigration
≤ 12 97 (14.4) 13-17 55 (8.2) 18-34 212 (31.5)
Table1.3 Weighted Descriptive Statistics for Major Discrimination Items
Caribbean Black Americans Total
Sample (n = 4,996)
African Americans (n = 3,526)
First Generation (n = 1,166)
Second Generation
(n = 304)
% (se) % (se) % (se) % (se)
Fired from a job 9.9 (0.004) 9.9 (0.004) 7.1 (0.018) 21.0 (0.075)
Not hired for a job 12.9 (0.008) 12.8 (0.008) 15.2 (0.031) 16.3 (0.059)
Denied a promotion 11.1 (0.006) 11.4 (0.006) 8.0 (0.017) 6.6* (0.021)
Harassed, physically threatened, or abused by the police 20.3 (0.010) 20.4 (0.010) 15.8 (0.032) 32.0 (0.091)
Discouraged by a teacher from continuing your educ. 5.4 (0.006) 5.5 (0.007) 3.9 (0.013) 7.6 (0.020)
Prevented from renting/buying home 7.0 (0.006) 7.0 (0.006) 7.3 (0.012) 5.7 (0.019)
Neighbors made life difficult for you or your family 3.9 (0.004) 4.0 (0.005) 2.2 (0.009) 4.6 (0.018)
Denied a bank loan 5.7 (0.004) 5.9 (0.005) 4.3 (0.015) 1.6*** (0.005)
Received inferior service (e.g., plumber, mechanic) 3.8 (0.003) 3.9 (0.004) 2.8 (0.009) 2.2 (0.008)
57 missing cases; Standard errors in parentheses; * significantly different from African Americans at the p < 0.05; ** significantly different from
Table 1.4. Weighted Descriptive Statistics for Day-to-Day Discrimination Items Almost
everyday (5)
At least once a week
(4)
A few times a Month
(3)
A few times a year
(2)
Less than once a Year
(1)
(If volunteer:)
Never (0)
% (se) % (se) % (se) % (se) % (se) % (se)
Treated with less courtesy than others 2.2 0.003 3.4 0.004 7.2 0.005 18.4 0.009 13.6 0.007 55.2 0.015
Treated with less respect than others 1.9 0.003 2.9 0.003 6.1 0.005 17.8 0.009 14.6 0.009 56.7 0.014
Receive poorer service in
restaurants/stores 1.2 0.002 1.6 0.002 5.8 0.004 19.8 0.010 14.4 0.008 57.2 0.015
People act as if they think you aren’t
smart 4.4 0.005 3.3 0.004 6.9 0.006 15.2 0.010 12.6 0.006 57.6 0.012
People act as if they are afraid of you 2.7 0.003 2.6 0.004 5.0 0.005 9.6 0.007 13.9 0.008 66.3 0.013
People act as if they think you are
dishonest 2.4 0.003 1.5 0.002 4.4 0.004 10.3 0.007 15.5 0.009 65.9 0.012
People act as if they’re better than you 7.3 0.005 4.6 0.004 8.8 0.005 16.2 0.010 7.3 0.005 55.8 0.014
You are called names or insulted 1.7 0.003 1.3 0.002 2.4 0.003 6.2 0.004 17.7 0.009 70.7 0.011
You are threatened or harassed 0.4 0.001 0.7 0.002 1.3 0.003 3.7 0.003 18.8 0.010 75.1 0.010
You are followed around in stores 2.6 0.004 2.0 0.003 7.1 0.005 12.4 0.006 12.0 0.008 64.0 0.012
All of the abovea 11.8 0.008 7.4 0.006 14.0 0.007 16.7 0.009 0.1 0.0004 50.0 0.014
CHAPTER 2
Predictors of Perceived Racial Discrimination among the U.S. Black Population: Exploring Ethnic Variations
Despite the accomplishments of the Civil Rights movement, racism continues to be an enduring problem in the United States (Bonilla-Silva 2001; Feagin 2001). Racial discrimination not only affects the economic and social advancement of minorities—it also takes a toll on one’s mental and physical well-being (Williams, Neighbors and Jackson 2003). W.E.B. Dubois
famously said that the enduring problem of the 20th Century is that of the color line
(1997(1903)). The recent waves of immigration to the U.S., however, have begun to shift the racial divide in the 21st Century (Bean and Stevens 2003 ; Shaw-Taylor and Tuch 2007). Studies
of contemporary Latin American and Asian immigrant groups suggest the conventional black-white divide is quickly becoming theoretically obsolete (Bonilla-Silva 2003; Lee and Bean 2004). No longer is the U.S. characterized by a White majority and a predominantly Black minority. Instead, the United States is an increasingly multiracial and multi-ethnic nation, leading some scholars to posit an emerging black-nonblack divide (Lee and Bean 2004) or a triracial system with whites at the top, honorary whites (e.g., light-skinned Latinos, Japanese-Americans, multiracial individuals) in the middle, and a collective black population at the bottom of the racial hierarchy (Bonilla-Silva 2003).
These racial schemas suggest that the social distance between many Asian and Latino immigrant groups and whites is shrinking. What is less clear is the incorporation of those
immigrants “deemed phenotypically black” (Alba and Nee 1997: 846). Black immigrants have on average higher incomes (Kalmijn 1996) and employment rates (Waters 1999) and are
compared to African Americans. While a few scholars contend that Caribbean Black Americans’ successes suggest the declining significance of structural racism (Patterson 2006), these favorable outcomes—like the more favorable outcomes of all immigrants groups compared to their native racial counterparts—are largely the result of Black immigrants being a highly motivated, self-selected group (Model 2008). Far from race being inconsequential for Caribbean Black immigrants, a growing body of ethnographic research suggests they are often shocked by the importance placed on skin color in the U.S. (Vickerman 1999) and that racism presents a structural barrier to social integration and socioeconomic advancement that many Caribbean Black immigrants did not face in their native countries (Portes and Zhou 1993). For example, Haller, Portes, and Lynch’s (2011) recent study found that Caribbean Black immigrants are falling behind some Latino and Asian immigrant groups who face a more hospitable context of reception in the U.S.
Racial discrimination is clearly an enduring problem for Black minorities in the United States. The increasingly covert nature of processes and practices that reproduce racial inequality, however, make it difficult to determine if one has been the victim of racism (Bonilla-Silva 2001). Subtle or invisible discriminatory practices can result in a divide between the objective
occurrence of racial discrimination and the perception that one has been the victim of discrimination (Phinney, Madden and Santos 1998). Many sociocultural factors (e.g., gender, socioeconomic status, beliefs, values) can shape one’s interpretation of discriminatory cues or signals in his or her environment (Feldman-Barrett and Swim 1998).
perspective” suggests one’s integration into American society will play an important role in perceptions of discrimination. In his influential work, Milton Gordon (1964) outlined the integration of European immigrants at the turn of the twentieth century, positing stages of successful assimilation to the American white mainstream. He contended that initial cultural contact results in migrants both influencing and being influenced by the destination country’s culture. Cultural assimilation is then followed by structural and marital assimilation, culminating in the immigrant group completely identifying, as well as being identified by others, as American. From this perspective, socioeconomic status—including measures of education, income, and occupational prestige—is often treated as an indicator of structural assimilation. Structural assimilation refers to increasing intergroup contact in public settings (e.g., workplaces) (Aguirre, Saenz and Hwang 1989). Some studies suggest that increasing socioeconomic status should be associated with decreases in perceptions of discrimination as increasing intergroup contact reduces prejudice (see Pettigrew and Tropp 2006 for a review). Current assimilation theorists have found that second generation Caribbean Black Americans have more favorable economic outcomes than both their parents and African Americans and that this moderate mobility is consistent with the experiences of European immigrants roughly a century ago (Kasinitz et al. 2008).
In contrast, some studies of the relationship between socioeconomic status and
Williams et al. 1997). While the children of European immigrants were white1 and could decide
to leave their native culture behind in favor of assimilating to the American mainstream, contemporary second generation immigrants often face a context of reception in the U.S. marked by racial prejudice. From the segmented assimilation perspective, assimilation to the white mainstream, anticipated in early assimilationist models, is an untenable assumption for many recent immigrants of color. Instead, Black immigrants may assimilate to the Black
underclass or maintain their native culture and solidarity with others from their ethnic group—a process Portes and Zhou (1993) term selective acculturation.
While the assimilation perspective assumes structural integration reflects a classical model of incorporation into the white middle class, segmented assimilation proposes two additional paths of incorporation besides the white middle class—the black underclass and the ethnic community. Implicit to both the classic and segmented assimilation perspectives are the assumptions that economic mobility is equivalent to decreasing discrimination and that
identifying with native Black Americans puts one at a disadvantage. As some scholars have noted, however, the Black middle class presents a potential fourth path of incorporation for immigrants of color and their children (Neckerman, Carter and Lee 1999).
I contend that while both the classical and segmented assimilation perspectives suggest that structural integration is a reflection of incorporation into the white middle class, gains in socioeconomic status may also be indicative of Black middle class assimilation. This fourth path of assimilation challenges the assumptions of both theories. First, Black economic advancement may be associated with greater perceived economic and interpersonal discrimination. As contact
1 The “whiteness” of some European immigrants in the 1700 through early 1900s has been the subject of scholarly
with whites increases, the Black middle class often perceive more racial discrimination than Black Americans with lower levels of socioeconomic status (Braboy-Jackson and Stewart 2003). Thus, the assumption that economic mobility is indicative of lessening discrimination does not account for the sense of relative depravation some middle class Black Americans may experience or the interpersonal slights they may endure. Second, if some Caribbean Black Americans
assimilate to the Black middle class, then this does not substantiate a “downward mobility trajectory” or the assumption that a Black American identity is a liability (Lacy 2004). However, it may mean that Caribbean Black Americans will report more discrimination as they gain some economic advancement and an increasing awareness of a common fate with other Black Americans (Neckerman, Carter and Lee 1999; Portes, Nash Parker and Cobas 1980).
The present study is comprised of two parts. First, I examine the assumption among classic assimilation and segmented assimilation perspectives that gains in socioeconomic status are indicative of structural assimilation into the white middle class. Particularly, I test if increases in education, income, and white interracial contact as well as being in a professional occupation are associated with fewer reports of major lifetime and day-to-day discrimination for both African Americans and Caribbean Black Americans. Second, I explore the pathways of selective acculturation and assimilation to the Black middle class among Caribbean Black Americans only. Segmented assimilation theory suggests that socioeconomic gains among Caribbean Black Americans will not necessarily accompany assimilation to the white middle class (Portes and Zhou 1993). Instead, Caribbean Black Americans may preserve their native culture and solidarity with others from their ethnic group in a process of selective acculturation. I also examine
segmented assimilation perspectives propose but that recent scholars have suggested as a potential pathway of incorporation for Black immigrants (Lacy 2004; Neckerman, Carter and Lee 1999). These pathways of incorporation are summarized in Table 2.1.
Table 2.1 Here Structural Assimilation and Perceived Discrimination
The literature linking structural assimilation to perceived discrimination presents
contradictory findings (Aguirre, Saenz and Hwang 1989; Floyd and Gramann 1995; Portes, Nash Parker and Cobas 1980). Some research has shown that increased structural assimilation,
when beliefs in internal causality and personal responsibility are applied at the group level, they imply that groups at the top rungs of the social hierarchy are entitled to their privileged status because they worked hard, and groups at the bottom rungs of the hierarchy are to blame for their low status because they have not worked hard enough (2006).
The prevailing social order and distribution of resources is thought to reflect the work effort of individuals, thereby legitimizing status hierarchies. In contrast, the segmented assimilation perspective would predict growing racial consciousness and a diminishing meritocratic
worldview. This is due to the possibility that increasing interactions with non-Hispanic whites may increase the likelihood of racist encounters and recognition of differential rewards for similar work effort.
The extent to which a meritocratic worldview influences attributions to discrimination among racial minorities is unclear. Some studies have found that when African Americans and Latinos have a meritocratic worldview, they are less likely to attribute unfair treatment to racial discrimination (Major et al. 2002; Shorey, Cowan and Sullivan 2002). Similarly, a recent study by Hunter (2008) found that British Caribbean Americans who valued individuality and
self-reliance, were less likely to perceive racial discrimination. The same values among African Americans, however, were not related to perceived discrimination.
(Pearlin and Schooler 1978: 5). While individuals may mobilize psychological resources in response to discrimination, social psychology studies suggest individual dispositions may also shape perceptions of discrimination as well.
Mastery is defined as “the belief that one can determine one’s own internal states and behaviors, influence one’s environment, and/or bring about desired outcomes” (Taylor and Aspinwall 1996: 78). Studies suggest that the psychological benefits of maintaining a sense of personal control over life outcomes contributes to the minimization of discrimination among minority group members (Major, Quinton and McCoy 2002). Ruggiero and Taylor (1995), for example, found increases in mastery are associated with decreases in discriminatory attributions for negative events. In contrast, a positive attitude towards one’s self (i.e., self-esteem) may lead to increases in perceived discrimination. Studies suggest that attributing negative outcomes to external causes, such as discrimination, rather than personal characteristics or traits is positively associated with self-esteem (Crocker and Major 1989). These studies indicate that psychological resources may shape perceptions of discrimination.
Segmented Assimilation: The Role of Cultural Assimilation
The concept of cultural assimilation has been the subject of much scholarly debate and criticism.2 From one perspective, cultural assimilation involves immigrant groups acquiring the
values and behaviors of American society (Liebkind 2003). Park (1950) theorized assimilation as the final step after “contact, competition, and accommodation,” with migrants eventually succumbing to the “progressive and irreversible” pull of incorporation into American culture and practices (Park 1950: 138). In his influential work, Milton Gordon (1964) contends that
cultural assimilation is the first step in a long process of immigrant incorporation, that may or may not be followed by other assimilative experiences, including primary and structural assimilation, marital assimilation, and identificational assimilation. Traditional perspectives on cultural assimilation suggest that minority immigrant groups are expected to perceive more discrimination. As they assimilate to American culture, however, these perceptions should decrease. Cultural assimilation has been found to mediate perceptions of discrimination, with culturally assimilated individuals reporting less perceived discrimination (Aguirre, Saenz and Hwang 1989; Phinney, Madden and Santos 1998).
Critics of the traditional assimilation perspective have explored the theory’s
“ethnocentric and patronizing” elements—especially the implicit assumption that developing American middle-class values and behaviors is superior to maintaining the values and behaviors of one’s original culture (Alba and Nee 1997). A second approach sees acculturation as a
dynamic process, with groups both adapting to the host culture and maintaining, to some extent, their own cultural heritage (Liebkind 2003). This dynamic approach attempts to address a
aspects of one’s own cultural heritage and contact with co-ethnic others is a resource for successfully navigating the barriers of American race and class structures.
While segmented assimilation theory suggests that selective acculturation is protective against institutionalized racism in underclass neighborhoods, the extent to which it buffers or suppresses experiences of racial discrimination in predominantly white, middle class contexts is unclear. Additional work is needed on the measurement of discrimination-relevant domains of cultural assimilation and the modeling of links among structural assimilation, cultural
assimilation, and perceived discrimination. The present study is an attempt to contribute to both of these important issues.
Structural Assimilation, Cultural Assimilation, and Perceived Discrimination
How and why might cultural assimilation modify the effects of structural assimilation on perceived discrimination? From the assimilationist framework, cultural differences between immigrant groups and the U.S. born reflect beliefs, behaviors, norms, and other aspects of culture that immigrants have brought with them to the host society. As number of years in the U.S. increase, cultural familiarity and socioeconomic incorporation should increase, subsequently reducing perceptions of discrimination.
for discriminatory cues in their environment (Allport 1979; Major, Quinton and McCoy 2002). While selective acculturation (i.e., partial assimilation) might lead to minimization of
discrimination initially by limiting contact with non-Caribbeans (Viruell-Fuentes 2007), as Caribbean Black Americans gain greater economic assimilation, this should increase contact with non-Caribbeans and subsequent perceptions of discrimination.
A final potential pathway for incorporation to U.S. society is assimilation to the Black middle class. Ethnographic studies suggest that as Caribbean Black Americans spend more time in the U.S., their sense of a common fate with African Americans grows. Vickerman found that “the longer [Jamaican-born men] live in this country, the more [discriminatory] episodes they encounter and the more they tend to identify with African Americans” (1994: 99). Rumbaut’s (1994) study of second-generation youth found that three-fourths of Jamaicans and two-thirds of Haitians reported experiences of discrimination. Furthermore, many of them anticipated continuing experiences with discrimination, regardless of their education levels (Rumbaut 1994: 770). In addition, a study by Seaton and colleagues found no differences between African American and Caribbean Black youths in reports of discrimination (Seaton et al. 2008). These studies suggest that, while Caribbean Americans may come to the U.S. embracing the
opportunities it offers and downplaying the role of race in access to those opportunities, increasing exposure to the U.S. race structure leads many Caribbean Black Americans to not only acknowledge racial discrimination but a common fate with African Americans as well. The Present Study
examine the direct effects of indicators of structural assimilation, including socioeconomic status and contact with predominantly white contexts, on perceived major lifetime and day-to-day discrimination for Caribbean Black Americans and African Americans. Next I determine if measures of racial consciousness, meritocracy beliefs, self-esteem, and mastery account for any significant effects between structural assimilation and perceived discrimination. I then examine measures of cultural assimilation on perceived discrimination among Caribbean Black Americans only. Finally, to assess assimilation to the Black middle class among Caribbean Black Americans, I present simulated probabilities of any perceived lifetime major discrimination and frequent day-to-day discrimination for differences in both structural and cultural assimilation. I propose the following hypotheses:
HYPOTHESIS 2.1— The assimilation perspective predicts that increasing interracial contact should decrease prejudice, resulting in fewer perceptions of discrimination. Based on this perspective, I hypothesize that measures of structural assimilation— including education, household income, professional occupation, and contact with whites in public settings—will be negatively associated with perceived day-to-day and major discrimination.
HYPOTHESIS 2.2—I hypothesize that structural assimilation will be more strongly associated with perceptions of discrimination for African Americans than Caribbean Black Americans.
HYPOTHESIS 2.3—A review of the assimilation literature suggests that one’s worldview (i.e., racial consciousness and a meritocratic worldview) as well as beliefs about the self (i.e., self-esteem and mastery) influence perceptions of discrimination. I therefore hypothesize that the relationship between structural assimilation and perceived major lifetime and day-to-day discrimination will be accounted for by racial
consciousness, meritocratic worldview, self-esteem, and mastery.
HYPOTHESIS 2.4—I hypothesize that the relationship between beliefs and perceived discrimination differs for African Americans and Caribbean Black Americans.
in-group identification (Barth 1969). Based on this possibility, I hypothesize that number of years in the U.S. will be positively associated with perceived major lifetime and day-to-day discrimination and weakening Caribbean orientation will be negatively associated with perceived major lifetime and day-to-day discrimination.
HYPOTHESIS 2.5b—In contrast to selective acculturation, another possibility is that Caribbean Black Americans may culturally assimilate to the Black middle class. Based on this possibility, I hypothesize that measures of cultural assimilation and structural
assimilation will be positively associated with perceived major lifetime and day-to-day discrimination as Caribbean Black Americans become similar to middle class African Americans.
Measures
Measuring perceived discrimination
Studies of perceived discrimination often distinguish between major lifetime
discrimination and day-to-day discrimination (Williams et al. 1997). Major lifetime discrimination refers to discriminatory experiences that can undermine economic as well as social advancement. In contrast, day-to-day discrimination includes discriminatory experiences that undermine the worth of the individual but do not interfere with social mobility. I measure both types of
perceived discrimination with items developed by Williams and colleagues (Williams et al. 1997).3
The major lifetime discrimination variable ranges from 0 to 8. Approximately 61% of the African American sample and 64% of the Caribbean Black American sample report zero
experiences of major discrimination and 0.6% of the African American sample and none of Caribbean Black American sample report 7 or 8 experiences of major discrimination. Any truncation of the major discrimination item would be arbitrary and model convergence could not be achieved when the variable ranged from 0 to 8. I therefore treat lifetime major
3 Please see Chapter 1 for a discussion of the major lifetime discrimination and day-to-day discrimination scale
discrimination as a dichotomous variable, coded 1 (one or more reports of major discrimination) and 0 (no reports of major discrimination).
The day-to-day discrimination scale ranges from 0 to 50 with approximately 46% of the African American sample and 48% of the Caribbean Black American sample reporting zero experiences of day-to-day discrimination. The day-to-day discrimination scale has an alpha of 0.933 for African Americans and 0.946 for Caribbean Black Americans. Because I am concerned with racial discrimination, only reports of major or day-to-day discrimination due to race are included in the scales.
Structural Assimilation
Structural assimilation is measured with four items—education, log of household
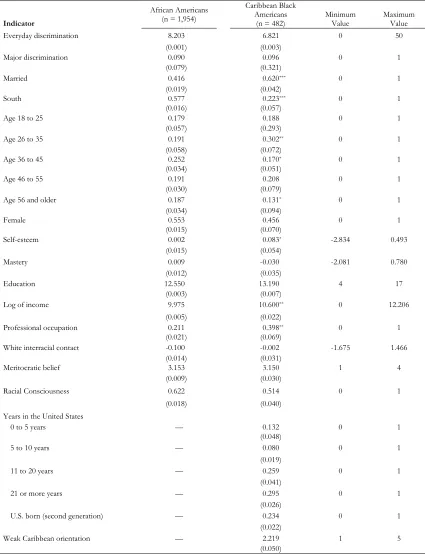
income, professional occupation, and white interracial contact. The mean household income for African Americans is $36,346.62 (s.e. 1635.80) and $52,029.61 (s.e. 3056.22) for Caribbean Black Americans with household income ranging from 1 to 200,000 dollars. I use the log of household income, making the analysis more responsive to small scores and less responsive to extreme scores. This models real world effects of earnings—individuals with little or no income are more sensitive to small changes in earnings than individuals with more income. Caribbean Black Americans report significantly higher mean levels of the log of household income compared to African Americans (Table 2.1). Education is measured with one item: “How many years of school did you finish?” Responses to this item range from 4 (“4 or less”) to 17 (“17 or more”).
more likely to be employed in professional occupations than African Americans (Table 2.1). White interracial contact is a measure of the respondent’s level of interaction with white people during his or her adult life over five social settings: (1) college, (2) present neighborhood, (3) grocery store, (4) place for medical care, and (5) present workplace, if employed. Responses include 1(“all Blacks”), 2 (“mostly Blacks”), 3 (“about half Black”), 4 (“mostly White”), and 5 (“almost all white”). I recoded these items to 1 (all Black or mostly Black contexts), 2 (half Black environments), and 3 (mostly White or almost all White contexts). I constructed a white interracial contact scale by summing the standardized values of the individual items and computing the average score over the non-missing items for each respondent.
Mediating Beliefs
Four beliefs are posited to mediate the relationship between structural acculturation and perceived discrimination in the present study. Meritocratic belief is measured by one item, “America is a land of opportunity in which you only need to work hard to succeed.” Responses to this item include 1 (“strongly agree”), 2(“somewhat agree”), 3 (“somewhat disagree”), and 4 (“strongly disagree”). Responses were reverse coded so that high scores indicate high levels of meritocratic belief. Racial Consciousness is measured with one item, “Do you think what happens generally to Black people in this country will have something to do with what happens in your life,” coded 0 (no) and 1 (yes).
about anything I really set my mind to” and “What happens to me in the future mostly depends on me”), resulting in a final alpha of 0.747 for African Americans and 0.791 for Caribbean Black Americans. Self-esteem is measured using Rosenberg’s (1965)self-esteem scale, which includes ten items. Example items include “I feel that I’m a person of worth, at least on an equal basis with others,” and “I feel that I have a number of good qualities.” When necessary, items were reverse coded so that high scores indicate high self-esteem. Cronbach’s alpha for this scale is 0.779 for Caribbean Black Americans and 0.767 for African Americans.
Cultural Assimilation
Cultural assimilation is measured only for Caribbean Black Americans and is assessed with two items: (1) a Caribbean orientation scale and (2) number of years in the U.S. Caribbean orientation is measured with an adapted version of the Acculturation Rating Scale for Mexican Americans-II (Cuellar, Arnold and Maldonado 1995). The original ARSMA-II measures both Mexican cultural orientation and Anglo cultural orientation. The current scale is a modified version of the Mexican Orientation Subscale adapted to measure involvement and identification with Caribbean culture. The scale includes the following items, which ask respondents “how much do you do each of the following”: “I associate with Caribbeans,” “I enjoy listening to Caribbean music,” “My contact with Caribbeans has been not at all, very little, moderately, very often, almost always,” “My friends, while I was growing up, were of Caribbean Descent,” “My family cooks Caribbean food,” “My friends now are of Caribbean origin,” and “I like to identify myself as Caribbean.” Items were recoded to reflect weakening Caribbean orientation. The
1 to 5 with a mean score of 2.219 (Table 2.1). The scale has an alpha of 0.931 for Caribbean Black Americans.
Cultural assimilation is also measured by number of years in the U.S. Number of years in the U.S. includes dummy variables reflecting 5 to 10, 11 to 20, and 21 or more years in the U.S. for first generation Caribbean Black Americans and a dummy variable for U.S. born second generation Caribbean Black Americans. Fewer than 5 years in the U.S. is the reference category. Controls
Table 2.2 Here
Correlation matrices for all items were estimated separately for African Americans and Caribbean Black Americans (see Appendix A). Separate tests showed no signs of multicollinearity.
Analytic Strategies
The data for this study come from the National Survey of American
Life-Self-Administered Questionnaire (see Chapter 1 for a discussion). All of the analyses (conducted with STATA 11.0) are performed with population weights to adjust for non-response bias due to being Caribbean, male, employed, having lower levels of education, and non-participation in the original NSAL interview post–September 11, 2001. Standard errors are corrected for clustering and stratification in the survey design.
I model both perceived day-to-day and major discrimination in this paper. Major discrimination involves logistic regression modeling of the outcome of reporting any major lifetime discrimination versus reporting no major lifetime discrimination. Day-to-day
McCoy 2002). Because judgments of discrimination are subjective, dispositions and beliefs as well as demographic and assimilation factors may lead some individuals to never perceive themselves as victims of racial discrimination—even when discrimination has objectively occurred. Thus it becomes important to model membership in this always zero group. Zero-inflated negative binomial (ZINB) regression is useful for modeling count variables with
excessive zeros and generates both a count model and a logit model for predicting zeros. In this paper, the parameter estimates for the negative binomial count model (β) are interpreted as the percent change in the number of experiences of discrimination per one-unit increase in the independent variable, holding other variables constant (100×(exp(β)-1)). The parameters for the logit model are interpreted with the same equation and indicate percent change in the likelihood of belonging to the always zero group, that is of never reporting day-to-day discrimination.
The analyses begin by examining the direct effects of indicators of structural assimilation including socioeconomic status and contact with predominantly white contexts, on perceived major lifetime and day-to-day discrimination for the total sample and Caribbean Black Americans and African Americans separately. Next I determine if measures of racial
of any perceived lifetime major discrimination and frequent day-to-day discrimination among Caribbean Black Americans.
Results
Classic assimilation perspective and perceived major lifetime discrimination
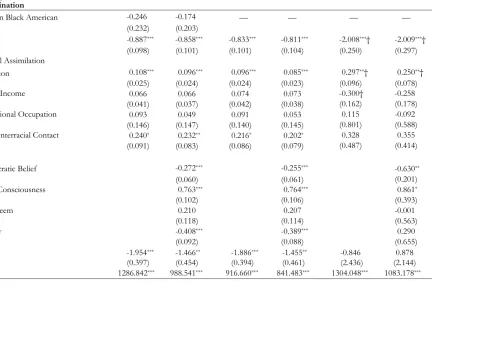
I begin my analysis by testing the assimilation perspective that structural assimilation will be negatively associated with perceived discrimination. Table 2.3 presents the logit equation for lifetime major discrimination and the negative binomial and logit equations for day-to-day discrimination. Perceptions of lifetime major discrimination for African Americans do not support the classic assimilation perspective (hypothesis 2.1). Education and white interracial contact are both significantly and positively associated with reports of any lifetime major discrimination. Log of income and professional occupation are also positively associated with perceived lifetime major discrimination, although these coefficients are not significant.
Table 2.3 Here
assimilation perspective. Consistent with hypothesis 2.2, this effect is significantly different from the positive effect of household income for African Americans (F (1, 50) = 5.02, p = .03).
Consistent with Hypothesis 2.3, meritocratic belief, racial consciousness, self-esteem, and mastery partially account for the relationships between measures of structural assimilation and experiences of lifetime discrimination. The effect of education is reduced, although not completely explained, by these beliefs. Even though somewhat diminished by racial
consciousness, meritocratic belief, self-esteem, and mastery, white interracial contact remains significantly and positively associated with major lifetime discrimination for African Americans only. Each additional unit increase in white interracial contact is associated with a 22.4% increase in the odds of reporting any major lifetime discrimination, a 1.8 percentage point decrease from its effects in Model 1.
Inconsistent with hypothesis 2.4, none of the beliefs are significantly different in their effects for African Americans and Caribbean Black Americans in Model 2. I find that
meritocratic belief is significantly and negatively associated with perceptions of major
discrimination while racial consciousness has a significant and positive affect for both groups. Self-esteem is not significantly related to reports of major lifetime discrimination, while mastery is significantly and negatively associated with major discrimination for both African Americans and Caribbean Black Americans.
Classic assimilation perspective and day-to-day discrimination
African Americans, meritocratic belief, self-esteem, and mastery are significantly and negatively related to day-to-day discrimination, while racial consciousness is significantly and positively related to perceived day-to-day discrimination, consistent with hypothesis 2.3. Each additional unit increase in meritocratic belief reduces the amount of perceived day-to-day discrimination by 5.5%, while increases in racial conscious increase the amount by 15.6%. In Model 2 for
Caribbean Black Americans, only esteem is significant. Each additional unit increase in self-esteem is associated with a 35.2% decrease in the expected count for day-to-day discrimination. Consistent with hypothesis 2.2, the effect of self-esteem is significantly stronger for Caribbean Black Americans compared to African Americans (F (1, 50) = 5.24, p = .03).
Panel three of Table 2.3 presents the logit equation, modeling the likelihood of never reporting day-to-day discrimination. Inconsistent with the classic assimilation perspective, all of the structural assimilation items except professional occupation are negatively associated with never reporting day-to-day discrimination for African Americans (hypothesis 2.1). However, only white interracial contact is significant, with each additional unit increase in white interracial contact decreases one’s odds of never reporting day-to-day discrimination by 19.6%.
In consistent with hypothesis 2.2, the structural assimilation variables do not significantly differ for African Americans and Caribbean Black Americans in Model 1.
In model 2 for African Americans, meritocratic worldview and mastery are
associated with a 41.4% increase in the odds of never reporting day-to-day discrimination. In addition, meritocratic worldview, racial consciousness, self-esteem, and mastery suppress the effect of professional occupation on zero reports of day-to-day discrimination. When these items are controlled for, Caribbean Black American professionals’ odds of reporting no day-to-day discrimination are 69.9% higher than the odds for Caribbean Black American
non-professionals.
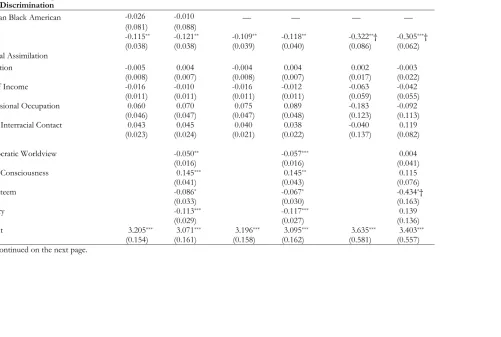
Selective acculturation and assimilation to the Black middle class among Caribbean Black Americans I introduce measures of cultural assimilation in Table 2.4 for Caribbean Black
Americans. Consistent with selective acculturation proposed in segmented assimilation theory (hypothesis 2.5a), a weakening Caribbean orientation is negatively associated with lifetime major discrimination, while number of years in the U.S. is positively associated with perceived major lifetime discrimination. These measures, however, are not statistically significant.
Table 2.4 Here
The binomial equation coefficients for perceived day-to-day discrimination are presented in column 2 of Table 2.4 and do not tell a consistent story about cultural assimilation among Caribbean Black Americans. Inconsistent with the selective acculturation proposition, a
weakening Caribbean orientation is positively associated with increases in perceived day-to-day discrimination while there is no discernible pattern for number of years in the U.S. Furthermore, neither of these cultural assimilation measures is significantly associated with increases in
perceived day-to-day discrimination for Caribbean Black Americans.
negatively associated with never reporting day-to-day discrimination compared to the reference group of Caribbean Black Americans who have been in the U.S. fewer than 5 years. The odds of never reporting day-to-day discrimination for Caribbean Black Americans who have been in the U.S. 21 or more years is about six times higher than for individuals who have been in the U.S. fewer than five years (1/e -1.780 = 5.917) and about 7 times higher for Caribbean Black Americans
who were born in the U.S. (1/e-1.935 = 6.944) compared to individuals who have been in the U.S.
fewer than five years. In addition, a weakening Caribbean orientation is positively, although not significantly, associated with never reporting day-to-day discrimination. Taken together, these findings suggest weak support for the selective acculturation hypothesis.
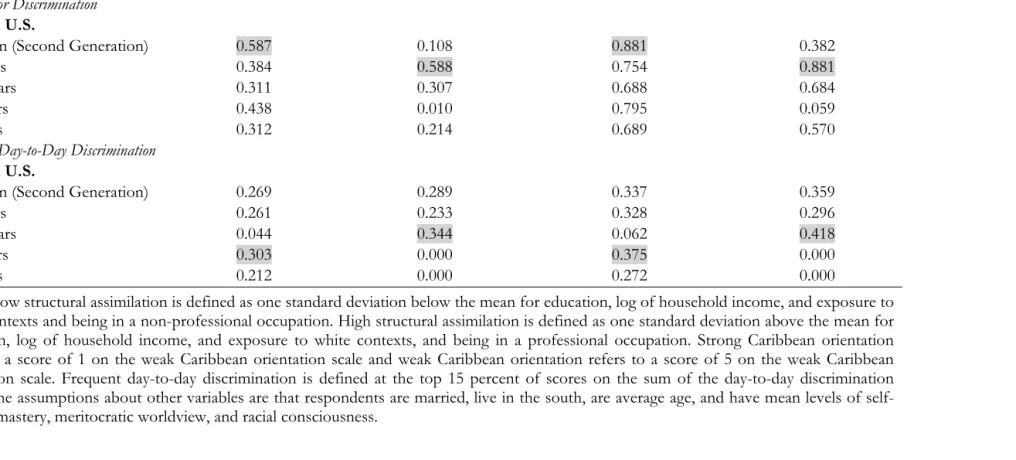
To gain an understanding of assimilation to the Black middle class, I estimate the predicted probabilities of reporting any major lifetime discrimination and frequent day-to-day discrimination for Caribbean Black Americans. These predicted probabilities are presented in Table 2.5. Frequent day-to-day discrimination is defined as the top fifteen percent of scores on the day-to-day discrimination items among Caribbean Black American men.
Table 2.5 Here
2.5b). However, consistent with the selective acculturation proposition (hypothesis 2.5a), second generation Caribbean Black Americans who are high on structural assimilation report more major lifetime discrimination when they have a strong Caribbean orientation.
Figure 2.1 Here
The highest predicted probability for frequent day-to-day discrimination is among weakly identified, high structural assimilation males who have been in the U.S. for 11-20 years. Looking at panel 2 of Figure 2.2, there is a clear increase in the slope of the line for first generation Caribbean Black American men who have been in the U.S. 11-20 years as their Caribbean orientation decreases.
Figure 2.2 Here
This is consistent with assimilation to the Black middle class. There is also a slight increase in the slope of the line for the second generation, although the gradient is not nearly as pronounced. For Caribbean Black Americans who have been in the U.S. 10 or fewer years and those who have been in the U.S. 21 or more years, there is not consistent support for assimilation to the Black middle class. Instead, reports of day-to-day discrimination are highest for those individuals when their Caribbean identification is strongest. Black Caribbean Americans who have been in the U.S. 10 or fewer years and who report a weak Caribbean identity have the lowest predicted probability of frequent day-to-day discrimination, regardless of structural assimilation level. Conclusion
regardless of ethnic differences. The measures of cultural assimilation among Caribbean Black Americans suggest weak support for the selective acculturation thesis. With the exception of Caribbean Black Americans who have been in the U.S. 21 or more years being less likely to never report day-to-day discrimination than Caribbean immigrants who have been in the U.S. fewer than five years, cultural assimilation does not appear to significantly impact perceptions of discrimination. I do, however, find some evidence that second generation Caribbean Black Americans are practicing selective acculturation while higher socioeconomic status first generation Caribbean Black Americans are possibly assimilating to the Black middle class.
The findings for Caribbean Black Americans are more complicated. Education is associated with higher odds and the log of household income is associated with lower odds of perceiving major lifetime discrimination for Caribbean Black Americans compared to African Americans. The finding regarding education is inconsistent with previous studies, which suggest that higher educational levels should predict fewer experiences of discrimination—especially among immigrant groups (Barona and Miller 1994; Beiser, Johnson and Turner 1993; Nicassio 1985). None of these studies were conducted with Black immigrants, however. This is
significant, given that a recent study found that second generation Caribbean Black Americans are experiencing less social mobility than other immigrant groups (Haller, Portes and Lynch 2011). If Caribbean Black Americans are investing in their educations and not receiving concomitant returns, then we would expect greater perceptions in the area of major
discrimination, which takes into account forms of discrimination related to economic mobility. In addition, if Caribbean Black immigrants have come to the U.S. to pursue the American dream, have high levels of human capital, but are not reaching their goals, then it is not surprising that they would report higher levels of discrimination than African Americans. In contrast, the negative association between log of household income and discrimination is supportive of the assimilation perspective (hypothesis 2.1).
Some previous studies suggest that attributing negative outcomes to external causes, such as discrimination, rather than personal characteristics or traits is positively associated with self-esteem (Crocker and Major 1989). From this perspective, perceived day-to-day
this research, the negative binomial equation for perceived day-to-day discrimination indicates that self-esteem is associated with decreases in this type of discrimination for both African Americans and Caribbean Black Americans—with the effects being greater for Caribbean Black Americans. This suggests that perceptions of day-to-day discrimination are not simply strategies for cognitively reframing circumstances so that they are less threatening to one’s sense of self-worth.
In the logit model for day-to-day discrimination, only professional occupation predicts perceived day-to-day discrimination for Caribbean Black Americans and only when controls for meritocratic belief, racial consciousness, self-esteem, and mastery are introduced into the equation. In analyses not shown, I entered each belief item into the equation separately and found that meritocratic worldview is responsible for the suppression effect. This suppression effect suggests that professionals have similar odds of never reporting day-to-day discrimination as non-professionals. However, professionals are less likely to espouse a meritocratic worldview than non-professionals. Once this difference in worldview is taken into account, Caribbean Black American professionals have higher odds of never perceiving day-to-day discrimination compared to non-professionals.