ETTRINGITE SYNCHROTRON ENERGY DISPERSIVE DIFFRACTION STUDY
M.N.Muhamad, P.Barnes, C.H. Fentiman, D.Hausermann, H.Pollmann and S.Rashid
ABSTRACT
Synchrotron radiation - energy dispersive diffraction has been used as a method for in-situ studies on the hydration of cements. The rapid data capture of the technique permits a time-resolved analysis of hydrating cement species under realistic (chosen) conditions. In this paper, we report on a study of the early hydration of minepack mixtures forming ettringite: the growth can be perceived over steps as small as 20 seconds, also the shifts in diffraction peak positions which are interpreted in terms of a time-dependent composition of the ettringite phase.
Keyword: synchrotron, dispersive, diffraction, cements, minepack , ettringite.
INTRODUCTION
Following the first use of Synchrotron Radiation Energy-Dispersive Diffraction (SR-EDD) to study the early hydration of cement [1], a hydration cell was subsequently designed specifically to the needs of cementitious systems: principally, the cell permits diffraction-analysis of a sizable volume of cement during hydration, from the initial wet paste up to fully hardened cement.
The minepacking systems under study use mixes of calcium aluminate, anhydrite, lime and water to form ettringite. In practical operations, these constituents are pumped considerable distances into the line ~a two slurries, one containing the calcium aluminate and the other the remaining ingredients. The two slurries are finally splash-mixed together at a nozzle aimed at pre-positioned minepacking bags. The mixture then hardens rapidly with sufficient strength developing for de-shuttering withtn 30 minutes [2].
This operation has become of topical interest due to the worldwide popularity of this method where the advancing face technique of coal mining is used. The stoichiometric reaction leading to the formation of ettringite is:
CA + 3CS + 2CH + 30R ---) C3A.3CS.H32 - (1) *
In this reaction, the CA is provided by the calcium aluminate cement (CAC) which should be of the 40% A1203 - type, such as Ciment Fondu Lafarge. In practice, exact stoichiometry is not sought, nevertheless the relative amounts of each component are critical [2]. The hydration sequence of one such composition at ambient temperatures has been studied in detail using the method of time- resolved synchrotron radiation energy-dispersive diffraction which is briefly explained next.
METHOD
SR-EDD is a technique which exploits the intense parallel beams of white X-radiation available from a synchrotron source in conjunction with the energy discriminating properties of an energy-dispersive ED-detector.
Abbreviations: C=CaO, A=Al2O3, S=SO3, H=H2O
By irradiating a polycrystalline sample with such radiation, diffraction is excited over a continuous range of wavelengths, A, and corresponding Bragg angles, a, which satisfy Bragg's law (A = 2d.sinè). However the EDdetector collimation system deliberately
permits only a small "subset" of these diffracted X-ray photons to reach the ED-detector, that is just those which are diffracted by a specific angle, è, which is half of the angular
position, 2è, of the ED-detector. The ED-detector sorts out these diffracted photons into
their respective energies using a multi-channel analyser (MCA) , the resulting energy spectrum being indeed the required EDD-pattern. Since energy E and wavelength A are reciprocally related, Bragg's law can then be more conveniently recast as Ed.sinè =
constant. Current ED-detectors are capable of operating at count rates between 103 104 c.p.s. so that acceptable ED-patterns can be collected in seconds or even less [3]. The rapid rate of data capture and the fixed geometry of the system (i.e. fixed a, 2è angles and
no moving parts) are ideally exploited in the study of fast reactions and transformations of polycrystalline materials subjected to a range of pressure/temperature and chemical conditions. In this study these methods have been applied to the study of mine-packing hydration using the ED-diffractometer on station 9.7 of the Daresbury SERC synchrotron.
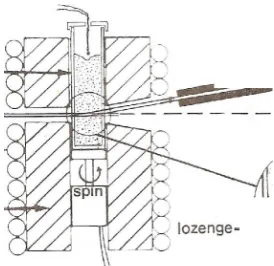
In order to guard against the potentially dangerous effects of intense synchrotron radiation, stringent safety searches have to be conducted before X-ray irradiation and data collection can begin. This, combined with the physical realities of mixing the ingredients (of equation (1)) and pouring them into the hydration cell, has meant that upto the present time data collection could only commence some 30-60 seconds after starting the mixing. It was then found that 20 second pattern collections were adequate for the first 15 minutes of hydration, after which progressively longer collection times could be used. The paralled beam optics chosen for this system result in a well-defined diffracting region termed a lozenge (see Figure.1). On spinning the tube, this lozenge explores a discus - shaped region with a diameter close to the full width of the sample tube and a volume of the order of tenths of a cubic millimeter. Thus material across almost the full width of the sample tube is sampled during diffraction.
RESULTS & DISCUSSION
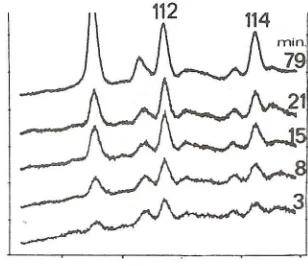
Figure.2 gives a selection of time-resolved EDD-patterns, taking the form of plots of intensity (arbitrary units) versus energy (keV). These patterns indicate the various stages of ettringite formation after 3, 8, 15, 21 and 79 minutes. Each pattern has been collected (rapidly) within 20 seconds. The broad peaks (full width half maxima of several hundreds of eV) are typical of what is to be expected from ED-diffraction where the peak widths are mostly determined by the relatively poor resolution of the detector. The ettringite (110), (112) and (114) peaks are indicated, and their growth with time clearly shows that ettringite starts to form within the first minute of mixing.
A more quantitative view of the hydration sequence is gained from a diffraction peak area/position analysis of the time-resolved patterns. Figure 3 shows the 8 progression with time of the area (1110) of the (110)-peak as a measure of the growth in concentration of the ettringite phase. This indicates that ettringite growth commences immediately from mixing (or at least within 4 30-60 seconds) and continues thereafter in typical sigmoidal fashion. There is no clearly defined dormant period as with 0 conventional cement hydration although there is noticeable slowing down in growth after N15min.: however perceptible ettringite growth is apparent even after 30 hours. This sigmoidal growth is indeed not unlike the strength-time plots obtained for such mixtures [2], indicating a strong relationship between strength development and ettringite growth: this aspect will be dealt with further in a future publication.
An intruiging result is gleaned from an analysis of peak shifts. Now EDD is a low (peak) resolution technique, with which one can determine lattice parameters to an accuracy of only N1 part in 104 even with ideal materials such as a perfect silicon powder [4]. For more complex multiphase systems such as hydrating cements, N7 in 104 is a more realistic accuracy. We would need therefore to obtain lattice parameter shifts of >0.1% if we are to place any meaningful significance on their variations with time.
Because of unfortunate peak overlaps in the ED-patterns, only the a-parameter of the ettringite unit cell could be properly monitored (using the (110) and (100) peaks) throughout the hydration sequence. The results prove to be dependent on the degree and mode of initial mixing. However the trend of increasing a-parameter with time has now been obtained on three separate hydration experiments: the results reported in Figure 4 are from the experiment which was considered to have achieved the best mixing and 11.18 simulation of the hydration sequence. The a-parameter increases with time from 11.14 to 11.23 in sigmoidal fashion. After 80 minutes, it is close to the asymptotic value which is indeed also the standard ettringite value (11.23 Å).
Figure.3: Growth of ettringite as determined from the (110) peak areas.
Figure.4: Variation of ettringite a parameter during growth.
In seeking an explanation for these lattice parameter shifts, and indeed the early rapid growth of ettringite, we take note of work on the solid solution crystal chemistry of ettringite [5-6]. One such idea is as follows: At first, as the anhydrite phase dissolves, the solution will be sulphate-deficient so that hydroxy/carboxy-rich analogues of ettringite will rather be formed since there will be plenty of (CO3)2- and OH- ions in the early
solution. There is a continuous range of solid solution between sulphate and hydroxy/carboxy ettringites with corresponding a-parameters varying from 10.90 A (N100% hydroxy-) and 10.86 A (N100% carboxy-) to 11.22 A (100% sulphate-ettringite). However the a-parameters do not obey Vegard's law (i.e. changes in a-parameter are ~ot proportional to concentration of the hydroxide or carbonate). For example, a 11.5 A a-parameter at early hydration times can result from either composition:
3 CaO.Al2O3. 0.9 CaSO4. 2.1 CaCO3.32 H2O
or 3 CaO.Al2O3.0.075 CaSO4. 2.925 Ca(OH) 2.32 H2O,
whereas on the other hand, an intermediate value, 11.19 A, can result from:
3 CaO.AI2O3. 2.7 CaSO4.0.3 CaCO3. 32 H2O
or 3CaO.AI2O3. 3 CaSO4. 2.7 Ca (OH)2. 32 H2O
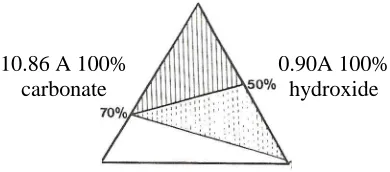
Further to this, there will always be more complex ternary solid solutions of ettringite, containing (SO4)2-, OH- and (CO3)2- simultaneously, in the form 3CaO.AI2O3.xCaCO3.y
Ca(OH)2.zCaSO4.32H2O, where x+y+z = 3. We can map the a-variations on to a ternary
Figure 5: The ettringite ternary diagram during growth (shaded region). The broken lines cover regions not yet verified by "static" powder diffraction
We conclude that the variation in a-parameter of ettringite during growth is due to compositional changes, the earliest ettringites being sulphate-defficient by the amounts indicated in Figure.5. This mechanism can explain why ettringite growth can occur from apparently "time zero" (initial mixing) even when there 100% sulphate 11.22A are insufficient·sulphate ions in solution. It also easily accounts for the effect being mix
-dependent since mixing will control the precise "early availability" of the respective ions in solution:
This latter aspect however will require further research. The a-parameters obtained are well within the tolerable error limits for the SR-EDD technique, and the superior time resolution of SR-EDD (20 second pattern collection times, here) is clearly necessary to reveal the effect. This may well be the first occasion where a time dependent solid solution has been observed on a time scale of seconds.
ACKOWLEDGEMENTS
We acknowledge the use of SERC synchrotron beam time and the various help and facilities provided by the station master (Mr.S.M.Clark).
REFERENCES
[1] Barnes,P., Clark,S.M., Tarling,S.E., Polak,E., Hausermann,D., Brennan,C., Doyle,S., Roberts,K.J., Sherwood,J.N. & Cernik,R.J.; Daresbury Laboratory Technical Memorandum DL/SCI/TM55E (1987).
[2] Brooks S.A.and Sharp J.H., in "Calcium Aluminate Cements" (edited by R.J.Mangabhai), p.335. Chapman and Hall, London (1990)
[3] Anwar,J., Barnes,P., Clark,S.M., Dooryhee,E., Hausermann,D., Tarling,S.E.; J.Mat.Sci.Lett. 9, 436-439 (1990).
[4] Hausermann,D., PhD thesis, University of London (1987).
[5] Pollmann ,H., In "Proc.9th.Int.Conf.on Cement Microscopy" (edited by J.Bayles, G.R.Gouda and A.Nisperos (Ed.), p.426-445. International Cement Microscopy Association, Duncanville, Texas, USA, (1987).
[6] H.Pollmann and H-J.Kuzel, Cem.Concr.Res. 20,941 (1990). 10.86 A 100%
carbonate