MELVIN, ELIZABETH MICHELLE. AC Electric Field Separation, Collection and Detection of Cells and Synthetic Particles. (Under the direction of Dr. Orlin D. Velev).
The goal of this dissertation is to develop new tools for the manipulation and characterization of specific cell types in AC electric fields. Cells are polarizable and resistive, therefore, it is possible to manipulate and detect cells using AC electric fields. Novel bio-microfluidic devices using two AC field techniques, AC electrokinetics and impedance spectroscopy, were developed to collect, trap and detect cells and particles in electrolyte suspensions.
detection lab-on-a-chip methods, and specifically, are compatible with optical evanescent waveguide detection technique.
The second part of the dissertation focuses on impedance-based cell detection, and the characterization of interdigitated gold electrode devices as well as methods to detect specific cell types by agglutination. Impedance is the resistance and capacitance in an electric circuit while impedance spectroscopy is the measure of impedance over varying applied frequencies at a fixed current and voltage. The effects of agglutination techniques and suspension characteristics on the impedance spectroscopy of yeast/latex particle, yeast/gold nanoparticle and yeast/magnetic particle suspensions were investigated. All of the agglutinated systems demonstrated a distinct, repeatable impedance change versus the non-agglutinated systems, showing impedance spectroscopy across interdigitated electrodes is sufficient to detect distinct agglutinated suspensions. Improving upon existing impediometric detection devices, biospecific ligand-functionalized magnetic particles were used to draw the agglutinated suspensions to the electrodes. To improve the device further, it was inverted so that cells bound exclusively to specifically functionalized magnetic particles. The bound particle and cell conglomerates were manipulable using magnetophoresis and brought to the electrode surface. The bio-chip impedance spectroscopy technique could be extended to determine the feasibility of using impedance spectroscopy methods in a system with fluid flow, to systems with multiple cell types and be of potential use in new novel biomaterials, biosensors, and microdevices.
by
Elizabeth M. Melvin
A dissertation submitted to the Graduate Faculty of North Carolina State University
in partial fulfillment of the requirements for the degree of
Doctor of Philosophy
Chemical Engineering
Raleigh, North Carolina 2012
APPROVED BY:
_______________________________ ______________________________
Dr. Orlin D. Velev Dr. Peter Fedkiw
Committee Chair
________________________________ ________________________________ Dr. Sonia Grego Dr. Glenn Walker
DEDICATION
This dissertation is dedicated to:
My mom and dad
For teaching me the value of education
And to:
BIOGRAPHY
Elizabeth M. (Lynch) Melvin was born on June 17, 1978 in Springfield, IL. The daughter of an engineer and an elementary school teacher, Liz moved a bit as a child between Illinois and Ohio, eventually ending up in Lexington, OH. After graduating high school in 1996, she attended Ohio University for a quarter, majoring in biochemistry determined to pursue a career in medical research. After careful consideration of a close friend’s advice, she decided to switch majors to chemical engineering.
While in ChE at Ohio State, she was involved in AIChE, science outreach, and undergraduate research with Dr. Robert Brodkey developing fluid dynamics computer models for impingement mixing. She also worked part-time for the OSU Athletic Ticket Office. She co-oped with Dow Corning (a world leader in silicon products) for four quarters in Midland, MI. One of her most favorite jobs while at Ohio State was being a TA for Mass Balance, Fluid Dynamics and Heat Transfer classes. In doing so, she discovered she had a passion for helping others understand chemical engineering principles.
In August 2002, she graduated from Ohio State and started working for Johns Manville (JM) in their Fast Start program in Hazleton, PA. Johns Manville is the #2 producer of building insulation in the US, with world-wide operations. The Fast Start program sent her traveling all over the country for training and to help start up several poly-isocyanurate foam insulation plants. She started as a plant engineer and was promoted to a Product Development Engineer role in appliance and aerospace insulation in early 2004 in Denver, CO. There, she discovered a love for hiking and mountains and even found her way to the top of Mt. Princeton (14,167 ft). She enrolled in the Six Sigma program and graduated with a DMAIC Black Belt in 2005. Her career was going well, but she realized that she still had a passion for teaching and mentoring. A PhD would position her to be promotable to teaching and mentoring roles in both industry and academia. Impressed by the closeness of the NCSU Chemical and Biomolecular Engineering Department, she quit her job (after another promotion to Research Engineer), and moved from Denver, CO to Raleigh, NC.
ACKNOWLEDGMENTS
I would like to thank the Velev group for their continued support and teaching. It’s nice to know that there is always someone around to ask for help. Burak Ucar, Stephanie Lam, Elena Blanco and Hyung-Jun Koo in one way or another have all been instrumental in keeping the lab running as well as helping me whenever it was needed. They all, most certainly, made being the lab safety manager much less difficult.
Thank you to the Graduate School for choosing me to be a part of their flagship Dissertation Writing Grant program. The funding was instrumental in helping me to write my dissertation and to help take care of my daughter for the first 7 months of her life. Being able to be with Abigail while finishing my PhD will be an experience I will hold dear for the rest of my life.
I’d like to give an extra special thanks to Brandon Moore for his dedication and hard work with gathering data for the cell pre-concentrator project. Brandon is so enthusiastic and bright and a complete joy to work with in the lab. Brandon is now in the master’s BTEC program and is doing excellent work. I know that his career will go far! Thank you, Brandon, for being a fantastic help!
The Fedkiw lab, Dr. Fedkiw and Rameswar Yadav have been incredibly helpful in teaching me about and allowing me to use the IM6 Impedance Measurement System in their lab. Yadav has been exceptionally helpful and patient with scheduling time on the equipment and answering my many questions. I’d also like to thank Andrew Loebl and his wife, Nora Schuette for their friendship and for helping me navigate the Fedkiw lab. A very special thank you to Dr. Fedkiw for being on my dissertation committee. Thank you for carefully editing my prelim as it was instrumental to the completion of my dissertation. I will also never forget that it was your class (ChE 711) that officially started my PhD journey.
Dr. Sonia Grego has been instrumental in making sure I have the electrode chips I need to perform experiments. Thank you Sonia and RTI for providing our group with microelectrode chips and for helping to fund this PhD work.
been quick to respond to all inquiries, even while on vacation and being a new dads. Thank you, also, Dr. Dickey for making my last TA-ship fun and fulfilling. You are a great professor!
Thank you to Dr. Chase Beisel, who within two weeks of my defense, offered to be a proxy for a committee member who was unable to attend my defense.
A very special thank you to the ChBE office staff, but especially to Sandra Bailey, Saudra Doby, Shelia Hayes and Diane Harper. You guys made me feel at home every day and helped me to navigate the NCSU system. You also kept me well fed, especially during my pregnancy. You are all truly special and will always hold a dear place in my heart. The department is blessed to have you and I feel fortunate to have gotten to know you.
I feel very fortunate to have Dr. Lisa Bullard as a mentor and friend. She has helped me to navigate my graduate career and giving me perspective into how to balance work and family as well as finding creative ways to pursue my life goals. Dr. Bullard, I appreciate the times you’ve welcomed me to your office, taken time to have lunch with me and for having enough faith in me to let me help you with the TA training workshops. I will never forget those Saturday morning sessions!
Dr. Brodkey was my undergraduate research advisor, and I’m convinced, the reason I got into grad school. He is one of the most brilliant and life-loving people I know. His frank stories of his grad school experience and his constant reassurance that, “You will make it”, is always with me. Who knew that saving someone’s Ohio State Season Football tickets would turn into a grad school career?
I would like to thank my parents for not killing me when I said I was going to quit my job at JM and come back to grad school. My parents have always shown me the importance of education and sticking with it. My mom returned to grad school when I was 16 and received her master’s in education by attending evening classes in 4 years. My Papaw, may he rest in peace, also got his PhD in Mechanical Engineering later in life when he was 48, showing me that it’s never too late to go back. I admire their dedication to education. Thank you, mom and dad for patiently listening to me complain about my devices that didn’t work.
I’d also like to thank Lindsey (Jerrim) Stamm, who, despite the fact that she has enough of her own life-events looming, always has time to be my best friend. I am grateful for most of my experiences in graduate school and meeting Lindsey is in the top five. She and I met because we were in the same lab, but also because we share a deep affection for our pets. Lindsey has helped me through some of the most difficult times in my life and shown me what a true, gentile southern woman is like. Lindsey, thank you for being there for me, befriending me even in times when I was not the most friendly, and for teaching me how to make brownies that didn’t come from a box mix.
I would like to thank my dog, Summer, for being ecstatic about the simple things in life. Whether it’s dinnertime or time for a walk, my dog reminds me that life isn’t as complex as we make it out to be. She also reminds me that fear of the unknown can be crippling if you don’t go and discover the root of it. Thank you for being my writing buddy, Summer! Thank you for lapping up the tears and dancing in celebration with me.
the best husband any woman could ask for. These have been the most challenging 5.5 years of my life and I can’t believe it is finally over. If I take nothing else away from this experience, being with you and having our daughter has definitely made this whole experience worth it. We made it. I can’t wait to start the next chapter in our lives together.
TABLE OF CONTENTS
LIST OF TABLES ... xi
LIST OF FIGURES ... xii
CHAPTER 1: Introduction to Microfluidics, Electric Biosensors and AC Electrokinetics ...1
1.1. Introduction ...2
1.2. History of Lab-on-A-Chip Devices ...2
1.3. Electrical and Surface Properties of Cells ...5
1.4. AC Electrokinetics ...7
1.4.1. Electrokinetic Fluid Flow: Electrothermal and AC Electroosmosis ...8
1.4.2. Electrokinetic Particle Motion: Dielectrophoresis (DEP) ...11
1.5. Microfluidic Methods for Particle and Cell Manipulation and Separation...12
1.5.1. Manipulation ...12
1.5.2. Separations on a Chip ...15
1.6. Electrochemical Analytical Methods ...19
1.6.1. Impedance and Electrochemical Impedance Spectroscopy ...19
1.6.2. Cyclic Voltammetry ...22
1.7. Microfluidic Methods for Particle and Cell Detection ...25
1.7.1. Optical Detection ...25
1.7.2. Electrical Detection ...26
1.8. Layout of Dissertation...29
1.9. References ...31
CHAPTER 2: On-Chip Collection of Particles and Cells by AC Electroosmotic Pumping and Dielectrophoresis Using Asymmetric Microelectrodes ...46
2.1. Introduction ...47
2.2. Materials and Methods ...51
2.2.1. Sample Preparation ...51
2.2.2. Patterned Electrode Design ...51
2.2.3. Electrode Chip Fabrication ...52
2.2.4. Experimental Apparatus and Data Acquisition ...52
2.3. Results ...53
2.3.1. Bulk Fluid Flow Generation… ...55
2.3.2. Particle Collection Tuning Parameters ...57
2.3.3. Effects of Medium Composition and Particle Type ...72
2.4. Conclusions ...73
2.5. Acknowledgements ...74
2.6. References ...74
CHAPTER 3: Optimizing Coating and Composition of Metal Electrodes for AC Field Manipulation and Collection of Cells and Particles in Electrolytic Suspensions...78
3.1. Introduction ...79
3.2. Materials and Methods ...82
3.2.1. Particle and Cell Preparation ...82
3.2.3. Electrode Coating ...83
3.2.4. Experimental Apparatus and Data Acquisition ...86
3.3. Results and Discussion ...87
3.3.1. Effect of Type of Electrode Metal ...88
3.3.2. Hydrogel-Based Coatings ...92
3.3.3. Silane and LbL Polyelectrolyte Coatings ...95
3.3.4. On-Chip Collection of Large Particles and Cells...102
3.4. Conclusions ...104
3.5. Acknowledgements ...106
3.6. References ...106
CHAPTER 4: Particle-Cell Agglutination Based Impediometric Biosensor ...115
4.1. Introduction ...116
4.2. Materials and Methods ...119
4.2.1. Sample Preparation / Agglutination Techniques ...119
4.2.2. Yeast Viability Study ...120
4.2.3. Interdigitated Electrode Chip Fabrication ...121
4.2.4. Interdigitated Electrode Chip Types ...121
4.2.5. Impedance Measurements ...123
4.3. Results… ...125
4.3.1. Sample Preparation Observations ...125
4.3.2. Biosensor Design Considerations: Impedance Analysis ...131
4.3.3. Agglutination by Electrostatic Binding ...132
4.3.4. Impedance Analysis of the Process of Functionalized Particle Agglutination...135
4.3.5. Magnetic Field Manipulation of Functionalized Particles ...137
4.3.6. Equivalent Circuit Modeling of Agglutination Methods ...140
4.3.7. Interdigitated Electrode Chip Redesign...149
4.4. Conclusions ...151
4.5. References ...153
LIST OF TABLES
Table 2.1 Electrode Design Configuration and Dimensions ...56
Table 2.2 Relative Particle Density for Electrode Repeat Designs at Various Chip Positions ...66
Table 3.1 Optimal Collection and Maximum Applied Potential and Frequency Settings for Platinum Electrodes...99
Table 3.2 Equivalent Salt Concentrations of Common Biological Buffers to Raleigh City Tap Water ...103
Table 4.1 Electrostatic Agglutination Samples of Yeast Cells and Particles as Pictured in Figure 4.8 ...127
Table 4.2 Bio-specific Binding Cell Viability for Varying Cell / Particle / Biological Salt Solutions Residence Times ...131
LIST OF FIGURES
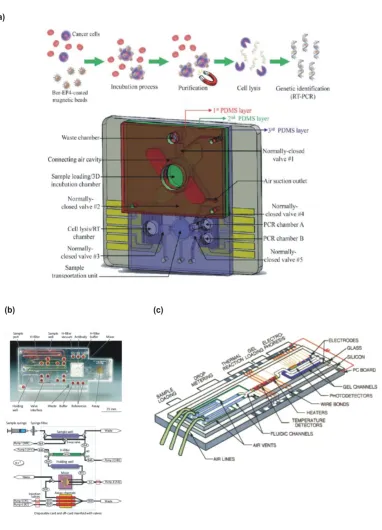
Figure 1.1 Integrated microfluidic devices combine microfluidic manipulation, separation and detection techniques. (a) Lab on a chip systems have been designed to bring whole cells into a detection chamber and perform all cell treatment steps: separation, incubation, purification lysis and gene identification.[21] (b) Lab on a chip assays treat the analyte with the proper antibodies and have more accurate result readings than traditional microarrays.[23] (c) Gel electrophoresis uses bulky equipment and gels that are friable, difficult to load and difficult to read. Burns et al. developed a device to perform all gel electrophoresis steps from sample preparation through analysis on one chip.[24]...4
Figure 1.2 Cells can act like a (a) traditional capacitor which is comprised of an insulator bounded by two conductive plates. (b) Cell membranes are comprised of amphiphillic molecules that form a thermodynamically favorable structure called a vesicle. Proteins are contained within the lipid bilayer and typically have a net negative charge. The charged surfaces surround the uncharged lipid bilayer like a capacitor ...6
Figure 1.3 AC electroosmosis occurs in asymmetric electric fields as a result of the charging of the electrical double layer. Fluid flow is tangential to the direction of the electric field.[49] ...9
Figure 1.4 Model of AC electroosmotic flow for varying distances from electrode (x) and frequencies.[49] For every electrolyte system, an optimal fluid velocity exists at a particular distance from the electrode, x, and frequency ...10
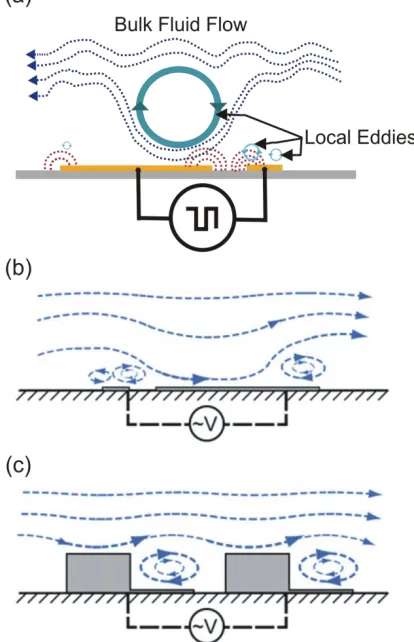
Figure 1.5 (a) AC electroosmotic flow is induced by asymmetric field gradients (red) that are driven by local eddies that form just above the electrodes and substrate. Bulk fluid flow is driven by the local eddies similar to that of a conveyor belt. Electric field asymmetry can be introduced by using (b) asymmetric planar electrodes and (c) asymmetric step electrodes. It is hypothesized that the step electrodes will induce higher bulk flow rates than that of the planar electrodes as the step electrode vortices do not impede forward bulk flow.[37] ...11
Figure 1.7 In microfluidic flows, x-direction and y-direction forces need to be overcome in order to direct cell manipulation in the positive direction. Negative x-direction forces include viscous drag or friction. The y-x-direction forces include buoyancy (positive) and gravity (negative) ...13
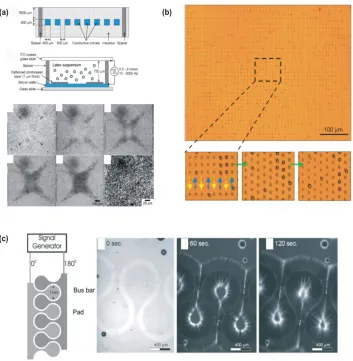
Figure 1.8 Examples of microfluidic cell and particle manipulation devices. (a) An electrically-driven fluid flows induced by asymmetric AC fields at the photoresist and silicon interface where particles and cells were drawn to a stagnant area in the center of a corral.[36] (b) Optical tweezers will generally collect one cell or particle at a time, but a system of multiple beams can trap and direct movement of a set of microparticles. Such a system was designed by Chiou et al.[79] (c) Using a zipper-like buss bar system, particles and cells on both the nano and microscale were collected using positive and negative DEP.[34]...15
Figure 1.9 Examples of microfluidic cell and particle separation devices. (a) A multi-branched microfluidic device separated particles of different sizes and densities. Two fluids of different densities, one of which is carrying the particle sample, are introduced to the chamber, meeting at a pinch point. Once the particle sample reaches the expanded, branched section at the end of the pinch point, the particles are drawn to different branches based on buoyancy.[87] (b) Specifically functionalized microwells used to trap HeLa and pancreatic cancer cells. Once trapped, the cells reproduced. Each well can also be actuated and removed individually for further analysis.[100] (c) Magnetic fields can be used to separate cells and particles with differing magnetic affinities by varying the magnetic field across a microfluidic channel.[102] (d) Cells and charged particles are polarizable and able to be separated using castellated electrodes by dielectrophoresis.[16] ...18
Figure 1.10 (a) Simple direct current (DC) circuit. (b) Simple alternating current (AC) circuit ...19
Figure 1.11 Phasor diagram for impedance. The real and imaginary impedance are related by the phase angle, ...20
Figure 1.12 Representative impedance spectra plots (a) Bode plot (b) Nyquist plot ...21
electrochemical cell. The brass working electrode connection contacts the sample at the bottom of the electrochemical cell. (b) Side view. The electrochemical cell is the hollow tube at the center of the glass reservoir. The reference electrode and counter electrode do not contact the working electrode ...22
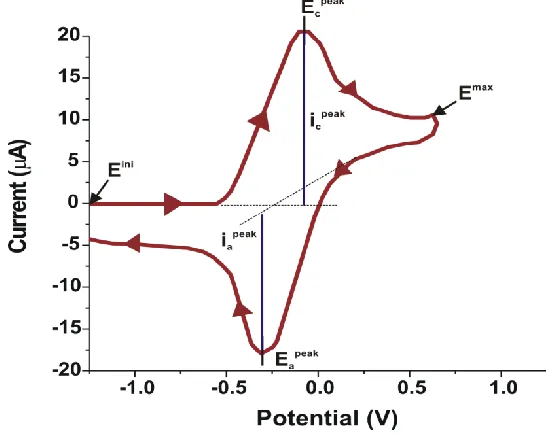
Figure 1.14 A typical cyclic voltammagram. The forward scan represents the reduction of the redox probe. At Ec, the oxidized form of the redox probe is depleted and
the reaction shifts to oxidation. As the reduced form of the redox probe is depleted, the current becomes more negative until Ea is reached and the
reduced form of the probe is depleted. Emax is typically chosen such that the potential at which Ec and Ea occur are within the bounds of the potential
sweep...24
Figure 1.15 Examples of detection methods in microfluidic chambers. (a) Strip assays are the most common microfluidic detection systems, but are not as sensitive to dilute analytes. Rastogi et al. developed a droplet-based bioassay system immobilized using dielectrophoresis that can detect dilute samples of ricin.[145] Bringing cells and particles between electrodes increases the capacitance close to the electrodes and is detectable by measuring impedance. This has been done using (b) DEP and specifically functionalized particles and (c) a combination of DEP and specifically functionalized surfaces.[4, 31] (d) and (e) Optical waveguides use changes in the refractive index of the surface to detect cells and particles. A wavelength or incidence angle shift specific to particular particles and cell types indicates the presence of a desired analyte. These devices are most effective if the particle or cell sample is concentrated over the grating.[146-147]...29
Figure 1.16 Capabilities of AC electric fields cells at low voltage / high frequency and high voltage / low frequency ...29
ACEO flow over the asymmetric electrodes is in the form a large eddy induced just above the edge of the large electrode adjacent to the small gap (adapted from Ramos et al.[29] ...50
Figure 2.2 Micrographs of typical particle collection results for 300 Hz, 800 mV at (a) 0 s, (b) 10 s, (c) 180 s, and (d) 360 s. A line of grouped particles, or particle front, is formed within the first few seconds of applying the AC voltage. The particle front traverses from the edge of the electrodes towards the center of the chip over the course of the trial, forming a rectangular deposit of densely packed particles in the middle of the collection area. The collection patterns are similar to those attained by Bhatt et al. [26], but thanks to the different principle are attained in 10% of the time ...55
Figure 2.3 Effect of chamber height on particle collection. (a) – (c) depict the top view in real time of particle collection device. The width of the collection area is 1mm. (a) At a relatively low height of 250 m, small, rapid eddies form directly over the electrodes and erratic eddies exist along the edge of the chip. Little, if any, particle collection was observed at the center of the collection area. (b) The optimal chamber height is approximately at a 1:1 ratio to the width of the collection area on the chip (750 m). This thickness leads to strong vortices and a well-defined stagnant are the center of the chip. (c) Higher chamber height allows for larger vortices to form over the electrodes, however, these vortices are strong enough to draw the particles away from the electrode chip surface. (d)-(f) show the side view of the COMSOL model output for geometry and dimensions analogous to corresponding particle collection experiments and present the corresponding fluid dynamics simulations ...58
Figure 2.4 Particle front velocity at 300 Hz as particles suspended in DI water travel from the electrode edge to the center of the collection area. The electrode edge is at 0, and the center of the chip is at 500 m. For lower potentials (250 – 300 mV), the bulk fluid velocity is insufficient to drag the particles to the center of the collection area within the 15 min trials. As potential increases, the bulk fluid velocity increases, drawing the particles to the center ...62
collection area center. (c) At 700 mV to 800 mV the efficient collection of particles at the center was confirmed by a positive %DFW ...63
Figure 2.6 Particle front velocity analysis in the low-frequency regime at 800 mV. DI water suspensions require low potentials and frequencies to induce ACEO bulk fluid flow. Very little change in the particle front velocity is observed for small frequency changes between 300 Hz and 1 kHz. As the frequency was raised above 2.5 kHz, DEP was observed, reducing the amount of particles in the collection area and reducing the apparent particle front velocity ...65
Figure 2.7 Pixel density analysis of observed ACEO phenomena in DI water at 300 Hz, 800 mV for 1, 3, 5, and 10 electrode repeats. The bulk fluid flow velocity driven by on electrode repeat will collect cells just beyond the large electrode, but is not sufficient to draw particles to the collection area center. Three repeats will induce flows that draw the particles only 250 m towards the collection area. Although 10 electrode repeats does act much like the 5 repeat device at first, after 100 s, the particles appear to be lifted from the corral center surface ...67
Figure 2.8 COMSOL finite element analysis models and micrographs taken at 280 s for increasing number of electrode pattern repeats: one (a,b), three (c,d), and ten (e,f). The bulk fluid flow eddies formed as a result of ACEO increase in size and velocity as the number of repeats increases. None of the repeat designs resulted in densely packed collection of particles as in the five repeat design (Figure 2.3b,e and Table 2.2) ...68
Figure 2.9 Micrographs and pixel analysis for circle geometry electrode segment repeat trials at 300 Hz, 800 mV. The %DFW analysis indicates similar results to the rectangular electrode geometry in that an optimum x-direction fluid velocity is needed to form a densely packed bed of particles in the center of the collection area. The 5-repeat design appeared to induce the optimum fluid velocity to draw 1 m particles to the collection center. Despite the lower %DFW range than in the rectangular case, (a) integrating the area under the %DFW curves for both the rectangular and circular geometries indicates the circular geometry is capable of drawing a larger amount of particles into the collection area. This is further seen by comparing the micrographs of the (b) 5-repeat rectangular design and (c) 5-repeat circular design results at 280 s ...70
Figure 3.1 (a) Top view of planar electrode collection chip. The collection area is 1 mm for each electrode repeat patterns (1, 3, 5, 10 repeats). The square-wave AC current is applied to one repeat segment while the others are grounded. (b-f) Side view enlargement of electrode chip with coating schematic for each type of thin film coating. Each coating includes a thiolated crosslinker to strengthen the bond of the polymer to the metal electrode. (b) The AquaSil silane coating is crosslinked with MPTES. (c) The LbL polyelectrolyte coating is crosslinked using MUA and comprised of 5 layers of alternating PSS and PDAC. (d) To ensure that the agarose is spread to a thin film during the spin coating process, the chips were first coated with MPTES and AquaSil. (e-f) Polyelectrolyte agarose coatings were doped with PSS and PDAC respectively before being layered over the silane. Not featured: polyacrylamide coatings ...85
Figure 3.2 Micrographs of uncoated gold and platinum electrodes before and after electrode damage. (a) Undamaged gold electrodes. (b) Gold electrodes damaged at 3V, in 0.001 TE electrolyte, evident by the light areas along the length of the electrode. Some of the damage on the small electrode is enough to render the device useless. (c) Undamaged platinum electrodes. (d) Platinum electrodes damaged in 10 mM PBS at 800 mV, evident by the dark purple and brown areas of the large electrode. For a reference to scale, large electrode is 30 m wide ...89
Figure 3.3 Electrokinetic phenomena diagram for gold electrodes. Experiments for uncoated gold in 1 TE and 1 mM PBS as well as silane coated gold in 1 mM PBS were not performed as electrodes were prone to rapid damage ...91
Figure 3.4 Electrokinetic phenomena diagram for platinum electrodes. Experiments for uncoated platinum in 1 TE and 1 mM were not performed as electrode damage was eminent ...92
Figure 3.5 Cyclic voltammetry curves following ferric cyanide reaction on bare gold (black) as well as silane (red) and LbL polyelectrolyte (green) coated gold. The peak at 0.3 V and 0.01 V for the gold curve exemplifies the oxidation and reduction reaction respectively. The lack of peak for the silane and LbL polyelectrolyte coated slides suggests the faradaic reaction has been sufficiently suppressed ...97
at the centrally located stagnant point is typically preceded by a distinct particle front that forms at the edges of the innermost electrode and traverses towards the center over time ...98
Figure 3.7 Particle density analysis at 800 mV, 300 Hz for uncoated (black), silane coated (red) and LbL polyelectrolyte coated (green) platinum electrode chip in DI water after 280 s of particle collection ...100
Figure 3.8 Time dependence analysis of particle density at 4 V, 10 kHz for uncoated, silane coated and LbL polyelectrolyte coated platinum electrode chip in 1 mM PBS ...101
Figure 3.9 (a) Collecting yeast cells with the electrode device was attempted with uncoated gold electrodes at 5V, 200 Hz in DI water. The cells tended to stick to the substrate. Within 80 s of applying potential, bubbles formed over the electrodes. (b) Gold lift-off occurred on the smaller electrodes, especially at the southwest corner. (c-f) Micrographs of particle collection trials of large particles and yeast cells in tap water with platinum polyelectrolyte coated electrodes. The 5 m latex particle trials were performed by toggling between 2 V and 4 V at 50 kHz. Particle collection is apparent after (d) 15 mins over (c) the initial micrograph. (e-f) Yeast cells were collected at 6 V 50 kHz after 15 mins. No electrode damage was apparent after either particle or cell collection trial with the coated electrodes ...104
Figure 4.1 Matrix depicting agglutination via pH. At a pH above the isoelectric point, the surface charge of cells is negative and negatively charged particles will be repelled. At a pH below the isoelectric point (pH = 4 for yeast cells), the surface charge of the cells will be positive and attract negatively charged particles ...118
Figure 4.2 Yeast viability study and growth judging examples. Judging criteria was as follows: 0 – no observable growth, 1 – growth on less than 50 % of the line, 2 – growth on 50%-75% of the line, 3 – full line with a few spots (greater than 75% of the line full) and 4 – full line of growth ...121
Figure 4.4 Gold on glass interdigitated electrode chip used in agglutination impedance spectroscopy measurements. The dual interdigitated electrode sets consisted of 25 electrodes on each side separated by 10 m gaps ...123
Figure 4.5 Photograph of electrode chip with soldered connections used for impedance spectroscopy measurements ...124
Figure 4.6 Side view of chamber for settling impedance experiments. The suspensions were loaded in the chamber from the top of the chamber and allowed to settle .. ...125
Figure 4.7 Magnetic particles can be manipulated with magnetic fields. The electrode sample chamber was inverted and a magnetic field induced just over the electrodes. (a) Unfunctionalized particles only were manipulated by the magnetic field and drawn between the electrodes. (b) For Con A magnetic particles, networks were formed with the yeast cells. Both magnetic particles and yeast cells were brought between the electrodes when the magnetic field was applied...125
Figure 4.8 Sample vials for agglutination via pH change. (a) Dispersed sample vials of (1) yeast + latex at high pH, (2) yeast and gold at high pH, (3) yeast + latex at low pH, (4) yeast and gold at low pH. (b) Settled sample vials of (1) yeast + latex at high pH, (2) yeast and gold at high pH, (3) yeast + latex at low pH, (4) yeast and gold at low pH. Yeast only samples not pictured ...127
Figure 4.9 Microcetrifuge tubes of (a) dispersed cells and particles and (b) settled cells and particles for (1) yeast only, (2) yeast and unfunctionalized gold nanoparticles and (3) yeast cells and Con A functionalized gold nanoparticles .. ...128
Figure 4.10 (a) Yeast cells and Con A functionalized magnetic particles after 5 minutes, (b) yeast cells and Con A functionalized magnetic particles after 30 mins, (c) yeast cells and unfunctionalized magnetic particles after 5 minutes ...130
(red) is distinguishable from the bare yeast (black) and gold nanoparticle / yeast (green) samples as they settled faster than the other agglomerates ...133
Figure 4.12 NPIC vs. frequency for pH agglutination technique (a) real impedance, (b) imaginary impedance at 70 minutes. The low pH samples are distinguishable from the high pH samples with the agglutinated yeast and latex particles exhibiting the greatest NPIC ...134
Figure 4.13 NPIC vs. frequency for bio-specific binding with gold nanoparticles (a) real impedance, (b) imaginary impedance at 30 mins. Yeast only (black) and yeast / unfunctionalized (red) particle suspensions exhibit similar impedance spectra, indicating little difference between the two suspensions. The electrochemical impedance spectra of the yeast / functionalized particle is distinct from the other two suspensions, especially above 10 kHz. The slope of the imaginary impedance curve is also less steep with respect to frequency and can also to be used to distinguish the agglutinated suspension from the non-aggluinated suspensions ...136
Figure 4.14 Inverted interdigitated electrode chip with unfunctionalized magnetic particles and yeast cells. When a magnetic field was applied, the magnetic particles formed chains. A few cells were observed to adhere to the glass substrate ...138
Figure 4.15 NPIC vs. log frequency for biospecific binding with magnetic particles (a) real impedance, (b) imaginary impedance at 15 mins. Yeast only (black) and yeast / unfunctionalized (red) particle suspensions exhibit similar impedance spectra, indicating little difference between the two suspensions. The electrochemical impedance spectra of the yeast / functionalized particle is distinct from the other two suspensions, especially above 100 kHz...139
Figure 4.16 (a)Equivalent circuit and (b) model fit for pH agglutination study at 70 mins. This model is similar to those used in other surface bound impedeometric biosensors[16-17] and is relatively simple involving two constant phase elements (CPE), solution resistance (Rs) and electrode capacitance (Celectrode) ...
...142
biosensors[16-17] and involves two constant phase elements (CPE), solution resistance (Rs) and electrode capacitance (Celectrode) ...143
Figure 4.18 (a) Equivalent circuit and model fit for (b) Con A functionalized gold nanoparticle and (c) Con A functionalized magnetic particle agglutination studies at 30 and 15 mins respectively. This model includes a resistance and capacitance component near the electrode surface (R3,C3) and two sets of
components between the electrode and bulk solution (R1, R2, C1, C2) ...145
Figure 4.19 (a) Bulk solution resistance of the ConA functionalized gold experiments with PBS alone, yeast alone, yeast and unfuctionalized particles, and yeast / ConA functionalized particles. Due to settling and the networks formation, the Con A functionalized particles and yeast cell networks exhibit just slightly higher resistances and contribute to the solution resistance. (b) The capacitance of the components from the electrode surface to just above the electric double layer. The capacitive component closest to the electrode surface C1 is
predominant from 100 kHz to 500 kHz. Components at and just above the electric double layer, C2 and C3 are evident in the NPIC from 10 kHz to 100
kHz and 1 kHz to 10 kHz respectively ...147
Figure 4.20 (a) Bulk solution resistance of the ConA functionalized gold experiments with PBS alone, yeast alone, yeast and unfuctionalized particles and yeast / ConA functionalized particles. Due to settling and the networks formed, the Con A functionalized particles and yeast cell networks exhibit just slightly higher resistances and contribute to the solution resistance. (b) The capacitance of the components from the electrode surface to just above the electric double layer. The capacitive component closest to the electrode surface C1 is
predominant from 100 kHz to 500 kHz. Components at and just above the electric double layer, C2 and C3 are evident in the NPIC from 10 kHz to 100
kHz and 1 kHz to 10 kHz respectively ...148
Figure 4.21 Imaginary impedance spectra from 1 kHz to 1 MHz for yeast only (black), unfunctionalized magnetic particles / yeast (red) and Con A functionalized magnetic particles (green) suspended in DI water at 15 minute time point. The distinctive difference between the functionalized and unfunctionalized particle samples between 10 kHz and 100 kHz indicates cells are present on the electrode array surface ...150
CHAPTER 1
1.1Introduction
In a time when cancer, pandemics, food contamination, environmental contamination, and biological terrorism are getting more public attention, there is a growing demand for rapid and accurate detection of certain cell types and viruses. In 2003, biotection was reported to be a rapidly growing market at $563 million with a compound annual growth rate of 4.3% with four major sectors: food, military, environmental and medical.[1] The analytes vary in size and shape from DNA to specific cell types for each application, however they each face the same challenges when trying to detect biological species: the tests available to date are slow, tedious, and inaccurate. Most of these lab bench macroscale techniques require large instrumentation and produce large amounts of biological waste. Developing new microscale devices for cell sample preparation, separation, collection and detection is becoming increasingly important.
Microscale methods, replacing those performed on the macroscale, could lead to lower material costs and power consumption. In most cases, media, nutrients and cell lines can cost hundreds of dollars per unit or can only be collected in small volumes. Lower power consumption makes possible hand-held, battery-powered devices. Further, studying cells in lab-on-a-chip devices allows researchers to take advantage of the microscale properties of cells. For example, biological particles have many of the characteristic properties of their synthetic particles and have been found to be easily manipulated by electrically induced forces.[2-17] By taking advantage of these and other microscale properties, biological systems can be integrated with man-made systems to build new devices, develop new detection techniques, and make advancements in medical research. Although the task of taking these research-driven micro biodetection devices to market is challenging[18], the foundation has certainly been laid over the last 20 years to develop micro biodetection devices to make a deep impact in the biodetection market.
1.2 History of Lab-on-A-Chip Devices
oxygen levels during cardiovascular surgery that the biosensor race began.[19] Less than a decade later, doctors were using similar electrode systems to measure other gases and glucose levels for diabetics. The advent of the microchip and fabrication methods used to make them gave rise to fabrication techniques like photolithography, chemical etching and micropatterning. By the late 90’s, miniature biosensor development was in full swing. Non-electrically driven biosensors were becoming commonplace in households with the great improvements in the strip assays used for home pregnancy tests. These tests have become so popular that they are now used in environmental, food pathogen and military applications. As biosensor innovation continues into the new millennium, so does the progress in micro total analysis systems (TAS), where entire lab functions are combined on one device.
Figure 1.1. Integrated microfluidic devices combine microfluidic manipulation, separation and detection techniques. (a) Lab on a chip systems have been designed to bring whole cells into a detection chamber and
perform all cell treatment steps: separation, incubation, purification lysis and gene identification.[21] (b) Lab on a
chip assays treat the analyte with the proper antibodies and have more accurate result readings than traditional
microarrays.[23] (c) Gel electrophoresis uses bulky equipment and gels that are friable, difficult to load and
difficult to read. Burns et al. developed a device to perform all gel electrophoresis steps from sample
1.3 Electrical and Surface Properties of Cells
Any charged particle has manipulatable and measurable electric properties. The ability for a substance to conduct or polarize in electric fields has also been widely used in biological cell and particle system characterizations.[3,9,11-12,14-15,27-32] Although direct current (DC) can be used, many electric properties are most apparent in alternating current (AC) electric fields. AC electric fields have been used to manipulate ions in solution to induce microfluidic flows (AC electroosmosis and electrothermal) or to manipulate polarizable particles (dielectrophoresis).[4-7,10,13-14,17,33-38] The parameters used in AC circuit measurements are discussed in Section 1.6.
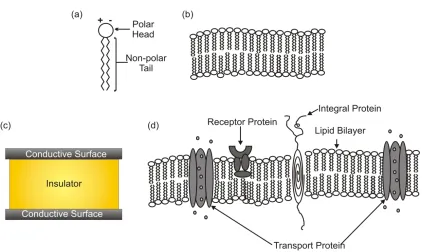
Figure 1.2. Cells can act like a (a) traditional capacitor which is comprised of an insulator bounded by two conductive plates. (b) Cell membranes are comprised of amphiphillic molecules that form a thermodynamically favorable structure called a vesicle. Proteins are contained within the lipid bilayer and typically have a net negative charge. The charged surfaces surround the uncharged lipid bilayer like a capacitor.
Proteins move freely within the lipid bilayer and, in the presence of an AC electric field are partially responsible for the polarization of the cell surface. Further, the integrated proteins have large dipole moments and are highly polarizable.[41-43] Similar to their polarizable synthetic particle counterparts, cells have the propensity to be more polarizable than the media in which they are contained and can be manipulated using DEP (See Section 1.4.2).[4-7, 10, 13-14, 17, 33-38]
potential and acts as a resistive sphere.[40] At higher frequencies, the electric field can penetrate the lipid bilayer, diminishing the cell membranes resistive properties and allowing charge to be stored in the membrane and to transfer into the cytoplasm.[40] However, due to the small concentration differences of ions and charged molecules, the membrane capacitance is only apparent within micrometers of the membrane.[46] For most suspended cells, the accepted value for membrane capacitance is approximately 1 F/cm[47], but can vary by ± 0.5 – 2 F/cm when in suspension or nutritive media.[39] For example, the membrane capacitance of yeast cells was measured experimentally to be 0.66 F/cm2 .[45]
The surface charge of a cell can also be altered by changing the net charge of the suspension media, typically by increasing or decreasing the pH. Commonly, the terminus of the proteins contained within the lipid bilayer is negative; therefore the surface charge on a cell is negative. Most proteins are amphoteric and have negative net charge at a neutral pH. When a protein is subjected to a lower pH, the net charge on the molecule will decrease until the isoelectric point, the point at which a molecule has zero net charge, is reached. Beyond this point, as the pH continues to decrease, the net charge of the protein is positive.
1.4 AC Electrokinetics
1.4.1. Electrokinetic Fluid Flow: Electrothermal and AC Electroosmosis
Ionic solutions are commonly measured using conductivity, the ability to conduct electrical current; and permittivity, the flux of an electric field. When in contact with an electrode with a potential applied, the conductivity and permittivity of the solution will change locally as the ions move. Applied potentials can also induce local non-uniform heating. Electrothermal flow results from the conductivity and permittivity gradients produced from this non-uniform heating. This typically occurs at relatively high frequencies above 10 kHz in high electrolyte concentrations or at low frequencies in lower electrolyte concentrations.[49]
Figure 1.3. AC electroosmosis occurs in asymmetric electric fields as a result of the charging of the electrical
double layer. Fluid flow is tangential to the direction of the electric field.[49]
AC electroosmosis typically occurs between frequencies of 10 Hz and 10 kHz. Fluid flow could occur at higher frequencies, only due to electrothermal effects. The fluid velocity in AC electroosmosis is frequency-dependent as shown in Equation 7.
For a non-dimensional frequency,
(Eq. 8) where is the reciprocal of the Debye length, m is the permittivity of the medium, is the
conductivity of the medium, and is the angular frequency. The diffuse layer potential, d,
for an applied voltage, Vo is:
(Eq. 9)
the average AC electroosmotic fluid velocity is:
where x is the relative distance from the electrode, o is the surface potential and is the
fluid viscosity. AC electroosmotic flow has both an upper limit and optimal velocity that is frequency and spatially dependent (Figure 1.4).
Figure 1.4. Model of AC electroosmotic flow for varying distances from electrode (x) and frequencies.[49] For every electrolyte system, an optimal fluid velocity exists at a particular distance from the electrode, x, and frequency.
the current potential.[50-51] Bazant et al. later modeled step electrode configurations for microfluidic pumping.[52] The advantage of using step electrodes is that the vortices created by the asymmetric electric field will be induced between the walls of the step electrodes. The vortices still contact the bulk fluid and induce flow in one direction only, reducing backflow. The step configuration is reported to possibly increase bulk flowrates up to 17-fold.[52]
Figure 1.5. (a) AC electroosmotic flow is induced by asymmetric field gradients (red) that are driven by local eddies that form just above the electrodes and substrate. Bulk fluid flow is driven by the local eddies similar to that of a conveyor belt. Electric field asymmetry can be introduced by using (b) asymmetric planar electrodes and (c) asymmetric step electrodes. It is hypothesized that the step electrodes will induce higher bulk flow rates
than that of the planar electrodes as the step electrode vortices do not impede forward bulk flow.[37]
1.4.2. Electrokinetic Particle Motion: Dielectrophoresis (DEP)
forces. When subjected to a non-uniform AC electric field, a dielectric particle can be drawn towards or away from the region of electric field with the greatest intensity. If a particle is more polarizable than the media into which it is suspended, it is drawn towards the region of the highest electric field (positive DEP) (Figure 1.6a). Conversely, if a particle is less polarizable than the media, the particle is repelled from the highest region of the electric field (negative DEP) (Figure 1.6b). The dielectrophoretic force is dependent on the intensity of the electric field (|E|), the radius of the particle (r) and the effective permittivity of the particle in the media (p, m)[49] (Eq. 7).
(Eq. 7)
Figure 1.6. (a) When the particle is more polarizable than the media the particle will experience positive DEP and be drawn to the highest electric field gradient. (b) When the particle is less polarizable than the media, the particle experience negative DEP and is repelled from the electric field.
1.5Microfluidic Methods for Particle and Cell Manipulation and Separation
1.5.1. Manipulation
One of the first challenges in designing biosensors is delivering the dispersed cell and particles to the detection area of the device. All cells are prone to sticking to microfluidic walls and substrate surfaces. Few cell types are suspension-based. Adherent cell lines require treatment as well as certain media additives for the cells to remain in suspension. Further, some common materials used to construct or coat microfluidic devices are toxic to biological cells.[53-54] Thus, microfluidic devices for biological applications need to be designed with
2 3
Re
2
p m
DEP m
p m
F r E
biocompatible materials that reduce biofouling and direct cells to their desired destination on the biosensor chip while keeping cells in suspension.
Directing cell motion by fluid flow is one of the most common modes for cell transport. Natural examples of such flows can be found in natural systems like the human cardiovascular system of capillaries as well as the vascular systems of leaves. In microfluidic chambers cells and particles are usually carried by fluid flows in the laminar regime[2] and therefore must overcome gravitational forces, buoyancy forces, friction and viscous drag forces[39,49] (Figure 1.7). Generating microfluidic flows, requires a gradient or pressure differential across the channel, generally instigated with a pump. Just as with macroscale pumps, microfluidic pumping systems have used positive displacement and dynamic systems[55] and commonly include piezoelectric[56-60], electric[37-38, 61-67], and magnetic[68-74] actuation.
Figure 1.7. In microfluidic flows, x-direction and y-direction forces need to be overcome in order to direct cell manipulation in the positive x-direction. Negative x-direction forces include viscous drag or friction. The y-direction forces include buoyancy (positive) and gravity (negative).
be used to collect cells and particles in predictable locations on substrates[36, 75-76] and have been especially effective in increasing cell counting efficiency[76] (Figure 1.8a).
Figure 1.8. Examples of microfluidic cell and particle manipulation devices. (a) An electrically-driven fluid flows induced by asymmetric AC fields at the photoresist and silicon interface where particles and cells were
drawn to a stagnant area in the center of a corral.[36] (b) Optical tweezers will generally collect one cell or
particle at a time, but a system of multiple beams can trap and direct movement of a set of microparticles. Such
a system was designed by Chiou et al.[79] (c) Using a zipper-like buss bar system, particles and cells on both the
nano and microscale were collected using positive and negative DEP.[34]
1.5.2. Separations on a Chip
phospholuminescent tags. Once these tags trigger a detector, a valve is actuated that changes the flow direction and the desired cell type is trapped in a chamber separate from other cells. These methods are only about 30% efficient[86] in separating desired cell types. Further, in some cases, the optical tags used alter the cell’s function. Just as with manipulation methods, separation methods utilize physical, chemical, magnetic and electrical properties to divide cells and particles into desired groupings, ideally without pre-treatment or optical tags.
Other mechanical and acoustical separation techniques involve using size or density differences, typically by varying flow fields with varying channel widths[87-89] or microfilters.[90] Takagi et al. developed a multi-channel microfluidic device to redistribute samples of varying particle diameters and densities[87] (Figure 1.9a). The raw sample of particles is introduced into one channel while a fluid of a higher density is introduced in an adjacent channel. When the two flows meet in a constricted portion of the channel, the particles are all aligned at the top of the channel. Branched microfluidic channels at the end of the constricted segment collect particles of different sizes based on buoyancy.[87] Hydrodynamic flow filters use membranes and blocked flow chambers of different sizes to sift particles based on diameter.[91-94] Particulates and cells can also be separated based on the elasticity of their surfaces. For animal cells, the lipid bilayer is relatively elastic. When sound waves are applied to suspension of cells or particles with varying surface elasticities, they will separate based on how the sound wave is adsorbed or reflected from the membrane or particle surface. This acoustical separation method has proven effective in isolating cells from solid particles as well as lipids from eyrthrocytes.[95-97]
Both magnetic and electrical separations involve manipulation by an induced field. Magnetic functionalized particles are commonly used to separate proteins and ligands from cell lysates in chromatography columns. In microfluidic devices, magnetic fields have been used to separate particles of different size[101-102] (Figure 1.9c). Red blood cells have also been isolated from whole blood samples with magnetophoresis, the manipulation of magnetic particulates with magnetic fields, by the paramagnetic properties of the heme groups.[101] Particles of different shapes, diameters, and materials were easily manipulated between electrodes excited by AC currents via dielectrophoresis.[33, 103]
Figure 1.9. Examples of microfluidic cell and particle separation devices. (a) A multi-branched microfluidic device separated particles of different sizes and densities. Two fluids of different densities, one of which is carrying the particle sample, are introduced to the chamber, meeting at a pinch point. Once the particle sample reaches the expanded, branched section at the end of the pinch point, the particles are drawn to different
branches based on buoyancy.[87] (b) Specifically functionalized microwells used to trap HeLa and pancreatic
cancer cells. Once trapped, the cells reproduced. Each well can also be actuated and removed individually for
further analysis.[100] (c) Magnetic fields can be used to separate cells and particles with differing magnetic
affinities by varying the magnetic field across a microfluidic channel.[102] (d) Cells and charged particles are
1.6 Electrochemical Analytical Methods
1.6.1. Impedance and Electrochemical Impedance Spectroscopy
In DC circuits electron flow is unidirectional and the current, I, is characterized only by the potential, V, and resistance, R (Ohm’s Law Eq. 1) (Figure 1.10a).
(a) (b)
Figure 1.10. (a) Simple direct current (DC) circuit. (b) Simple alternating current (AC) circuit.
(Eq. 1)
The oscillating AC current depends on the elements of a circuit that resist electron flow or hold electric charge. Most generally, this is expressed by the impedance, Z, the complex ratio of the voltage to the current in an AC circuit, similar to that of the resistance of the DC circuit. For a simple AC circuit (Figure 1.10b) in which the resistor and capacitor are connected in series, the current is similar to that of Ohm’s Law where impedance takes the place of the resistance term (Eq. 2).
(Eq. 2) For impedance measurements, alternating currents are typically sinusoidal. The impedance is therefore, dependent on the angular frequency while the resistance and capacitance are related by a phase angle, (Figure 1.11). To distinguish the phasors, the resistance is considered to be the real part of the impedance and the capacitance to be the imaginary part (Eq 3, 4 and 5).
V I
R
V I
Z
Z(w)
Figure 1.11. Phasor diagram for impedance. The real and imaginary impedance are related by the phase angle, .
(Eq. 3)
(Eq. 4) (Eq. 5) The real and imaginary phasors are related by the tangent of the phase angle (Eq. 6). Impedance measurements are typically presented as Bode plots, the log Z() versus the phase angle and Nyquist plots, the ZRe versus ZIm, for increasing angular frequencies (Figure
1.12a,b).
(Eq. 6)
Re ImRe
Im 1
Z Z jZ
where
Z R
Z
C
Im
Re
tan Z
Z
Im
Re Z
Im
(a)
(b)
Figure 1.12. Representative impedance spectra plots (a) Bode plot (b) Nyquist plot
For electrochemical impedance spectroscopy measurements performed in aqueous environments, the charges that form on the surface of the electrodes must be taken into account. Even when no current is flowing through the electrode a layer of ions and water molecules will form on the surface. This layer will be capacitive because of the distribution of charges over the electrode surface and is responsible for reducing the efficiencies of electrochemical reactions. Impedance measurements can be broken down into two types: faradaic and non-faradaic. Faradaic impedance refers to the resistance to charge transfer based on a redox electrochemical reaction. Non-faradaic impedance is the impedance due to
0.00 1.00 2.00 3.00 4.00 5.00 6.00 7.00
0.00 0.76 1.35 1.81 2.21 2.61 3.00 3.40 3.80 4.20 4.60 5.00 5.40 5.80
Log Frequency (Hz)
Lo g | Z| (O hm s) -90 -80 -70 -60 -50 -40 -30 -20 -10 0
Phase Angle (
deg
)
Impedance Phase Angle
0.00 1.00 2.00 3.00 4.00 5.00 6.00 7.00
0.00 1.00 2.00 3.00 4.00 5.00 6.00 ZRe (Ohms)
-ZIm
(O
hm
the capacitive layer on the electrode, the resistance of the solution and the capacitance of a solution’s components. For this study, the interaction from the faradaic impedance is reduced by limiting the electrolyte concentration and performing experiments at low potentials.[111]
1.6.2. Cyclic Voltammetry
Cyclic voltammetry is an electrochemical analytical method that is used to study the environment at the metal – solution interface. Cyclic voltammetry studies not only reveal information on reactive species in solution, but respond to very small changes to the surface of metals.[112-128] Traditionally, these experiments are performed in large glass vessels, but as the technique has been refined to study surface interactions, the apparatus has been miniaturized to limit side reactions (Figure 1.13).[111, 122, 129-132] The design of the apparatuses used for these studies varies, but ideally have the same basic components: a working electrode, redox probe, reference electrode and counter electrode.
Figure 1.13. Experimental apparatus for studies involving thin-film metal electrodes and thin film coatings. (a) Top view. The Ag/AgCl reference electrode and the counter electrode (not pictured) are inserted at the top of the device into the electrochemical cell. The brass working electrode connection contacts the sample at the bottom of the electrochemical cell. (b) Side view. The electrochemical cell is the hollow tube at the center of the glass reservoir. The reference electrode and counter electrode do not contact the working electrode.
inert noble metals that do not participate in the electrochemical phenomena being studied at the working electrode.[111, 134] The potential is applied directly to the working electrode and the resulting current is measured with respect to the reference electrode. Most commonly, reference electrodes are saturated concentrations of an electrolytes paired with its elemental metal (eg. Ag/AgCl) of a known potential ranging from 0 V to 0.4 V.[111] The saturation of the reference electrode is important in that it must remain ideally non-polarizable so that only the reaction at the working electrode is apparent in the resulting voltammagram.
The voltammagram follows the redox reaction of the redox probe, an electrochemically active species that freely accepts or donates electrons at predictable potentials depending on the polarization of the electrodes. Potential is applied to the working electrode and is swept positive to negative (forward scan) from an initial potential, Eini, and reversed (reverse scan) once a particular potential maxima, Emax, is reached. If the reference electrode and working electrode are both ideally nonpolarizable, then the voltammagram will represent the electrochemical reaction that occurs in the cell only. However, in surface reaction studies, the working electrode must be polarizable such that the voltammagram represents what is occurring on the surface of that electrode.[111]
Figure 1.14 is an example of a typical voltammagram that follows the reduction and oxidation reaction of the redox probe where O is the oxidant, R is the reductanct, e- is the electron and n is the sociometric number to balance the electrons transferred (Eq. 7).
(Eq. 7)
During the forward, negative scan, the voltammagram represents the cathodic current at the working electrode or reduction of the oxidized form of the redox probe (O). As the potential decreases, a peak emerges (ic, Ec), indicating that the concentration of the oxidized form of
the redox probe is becoming depleted. Once Emax has been reached; the reverse, positive scan demonstrates the electrochemical reaction from the reduced form of the redox probe (R) to the oxidized form. As the reaction progresses, the concentration of the reduced form of the redox probe continues to diminish until the anodic current peaks (ia, Ea), when the
[ ][ ] (Eq. 8)
where E is the potential of the cell which is dependent on the standard potential for the redox species reaction, Eo’, temperature, T, and the concentration of the redox probe species, [R] and [O].
Figure 1.14. A typical cyclic voltammagram. The forward scan represents the reduction of the redox probe. At
Ec, the oxidized form of the redox probe is depleted and the reaction shifts to oxidation. As the reduced form of
the redox probe is depleted, the current becomes more negative until Ea is reached and the reduced form of the
probe is depleted. Emax is typically chosen such that the potential at which Ec and Ea occur are within the bounds
of the potential sweep.
Cyclic voltammetry experiments can be performed in a number of variations to collect information about the surface properties of metals, coatings and electrochemical reactions. If experiments are performed at varying scan rates, one can determine important information regarding a reaction’s kinetics.[133, 135]
voltammetry was used to determine the effectiveness of coatings to reduce electrochemical reactions on an electrode surface.
1.7Microfluidic Methods for Particle and Cell Detection
Microfluidics combined with detection has been in use for over 40 years with the advent of the strip or linear flow assay.[139] By drawing a sample by capillary forces through a strip of cotton or other non-woven fibrous materials through an area pretreated with specific antibodies, an anaylte is detected once it is immobilized on an area with concentrated tagged antigens. A line of bright blue or red indicates a positive result when compared to a control line. These strips are common and commercially available in home pregnancy and drug testing kits, but have also made major strides in detection of diseases such as STD’s [140-141]
and diphtheria[142-144] in third world countries. Though relatively inexpensive to fabricate, distribute and use, strip assay kits are prone to fouling in humid conditions and are not ultra-sensitive to dilute analytes. More recently, researchers have examined more ultra-sensitive optical and electrical detection methods in microfluidic devices for cell, particle and biological molecule detection. Droplet assays have been developed for the rapid and sensitive detection of ricin using similar antigen-antibody recognition, with smaller sample sizes than those used for strip assays[145] (Figure 1.15a).
1.7.1 Optical Detection
1.7.2. Electrical Detection
Virtually all electric detection methods are derived from the electrochemical analysis methods mentioned in Section 1.6. Impedance and cyclic voltammetry are most commonly used as they are able to detect minute differences within tens of microns from the electrode or substrate surface.[27-28, 111] Cyclic voltammetry (CV) is used to measure the mobility of ions between a metal electrode and solution. The CV response is unique for each electrochemically active species in solution and for metal types. It is sensitive enough not only to detect cells, but also to determine small changes of the cell’s extracellular environment.[149-151] CV has also been used to determine minute changes in that of surface coatings, immobilized cells[152-153] or changes to surface-bound proteins.[154]
Impedance has also proven effective as a surface-bound detection method for cells, particles and biological molecules. As a result, many techniques have been studied to bring a cell type of interest to sensing electrodes in impedance cell detection devices. Antibodies specific to certain cell type have been used to functionalize the surfaces between electrodes (Figure 1.15c). The desired cell is brought between the electrodes while other cells in the sample are washed from the detection surface. The immobilized cells are detected by a distinct impedance difference.[27, 29-31] In addition, studies have shown that it is possible to detect differences in cell secretions by impedance of immobilized cells on electrodes.[155] Though effective, the functionalized surfaces used to immobilize the cell of interest are subject to bio-fouling, have short shelf-lives, and are difficult to reuse.
Functionalized particles have also been used to enhance impediometric detection of cells in suspension. Cells are brought between the electrodes by DEP and gold nanoparticles functionalized with the antibody of the cell of interest are introduced to the sample chamber. The particles bind specifically to the cells of interest, producing a distinctive electrical response.[4, 11, 156-157] Velev et al. used silver to further enhance the change in electrical response[4] (Figure 1.15b).

![Figure 1.4. Model of AC electroosmotic flow for varying distances from electrode (x) and frequencies.[49] For every electrolyte system, an optimal fluid velocity exists at a particular distance from the electrode, x, and frequency](https://thumb-us.123doks.com/thumbv2/123dok_us/1198829.1150578/34.612.154.484.192.448/electroosmotic-distances-electrode-frequencies-electrolyte-particular-electrode-frequency.webp)