Characterisation of the Deformation and Fracture of Nuclear Graphite using Neutron Diffraction
Dong Liu1, Keith Hallam1, Andreas Andriotis2, David Smith2 and Peter Flewitt1,3
1 Interface Analysis Centre, School of Physics, University of Bristol, Bristol, BS8 1TL, UK
2 Department of Mechanical Engineering, Queen’s School of Engineering, University of Bristol, Bristol,
BS8 1TR, UK
3 HH Wills Physics Laboratory, School of Physics, University of Bristol, Bristol, BS8 1TL, UK
ABSTRACT
It has been demonstrated that the initiation and growth of localised, heterogeneously-distributed process zones is associated with the non-linear stress-strain response of graphites used to moderate UK gas-cooled civil nuclear reactors. These graphites, such as Gilsocarbon graphite, have heterogeneous complex polygranular microstructures which contain pores and flaws arising from their fabrication. The macroscopic properties of such nuclear graphites are dictated by their microstructure. Due to the presence of pores and aggregates, the lattice strain is not expected to change 1:1 with the externally bulk strain applied to macro-scale specimen. Deformation of the material containing pores and flaws causes localisation of strains and, hence, initiation of inelastic damage. The length-scale at which the localised damage develops during loading can be characterised by the lattice strain in a bulk volume of material. Therefore, in situ neutron diffraction on a Gilsocarbon graphite bend geometry test specimen has been undertaken at the ENGIN-X, ISIS facility. It was found that lattice strain changes linearly with applied bulk strain but with reduced magnitude. The results are discussed with respect to the evolution of characteristic process zones, as deformation is increased, and the associated of microcracking.
INTRODUCTION
Isotropic and near-isotropic nuclear grade graphites are used as the moderator and major structural components of existing power plant, such as the UK Advanced Gas-cooled Reactors (AGR). In addition, it is a candidate material for Gen IV reactors, such as the Very High Temperature Reactor (VHTR) and the Pebble Bed Modular Reactor (PBMR) (Moskovic et al. 2013). There are many grades of nuclear graphites, differing in their particle size (fine to coarse), coke source (pitch or petroleum) and processing (extrusion, isostatic pressing, moulding, etc); in particular, Gilsocarbon graphite is used as a moderator in all of the UK AGRs, the THTR (helium-cooled high-temperature reactor) in Germany and as fuel supports in some French Magnox reactors. The manufacturing process for this graphite leads to a multi-scale pore structure and a distribution of filler particles in a graphitised matrix (Eason et al. 2008) (Liu et al. 2015) (Laudone, Gribble and Matthews 2014). The size, distribution and 3D geometry of these pores and flaws have an influence on subsequent radiolytic oxidation during service, permeability and diffusivity of the core, and the loading-bearing capacity, deformation and fracture of the material (Hindley et al. 2013) (Burchell 1996).
of local events, like micro-cracking, leads to a non-linear, inelastic bulk stress-strain relationship for nuclear graphite prior to failure, and a corresponding relaxation of lattice strain due to removal of local constraints (Hodgkins et al. 2006). The scale at which this type of damage develops can be characterised by examining the elastic lattice strain change in a deformed bulk volume of material. In situ neutron diffraction of a Gilsocarbon graphite under bending using a time of flight (TOF) instrument can provide simultaneous measure of all lattice planes for a given spectrum direction (e.g. along the deformation axis) (Santisteban, Daymond 2006). The present work investigates the deformation of a type of Gilsocarbon graphite by establishing the correlation between local lattice strain and bulk strain using TOF neutron diffraction.
EXPERIMENTS
Virgin Gilsocarbon graphite extracted from stock AGR reactor core bricks was provided by EDF Energy Ltd. This material was formed by pressing to achieve near-isotropic mechanical and physical properties. Beam specimens made from this Gilsocarbon graphite were loaded under four-point bending and the elastic strains measured in situ by neutron diffraction. The ENGIN-X ISIS neutron diffraction facility (Santisteban, Daymond 2006) was used to measure the change of lattice spacing of a Gilsocarbon specimen under bending.
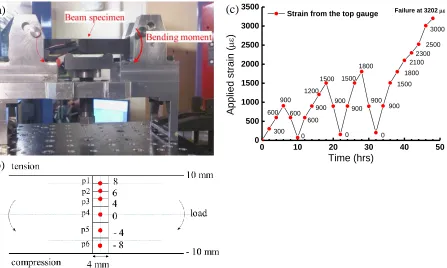
Figure 1. (a) Bending configuration of Gilsocabon beam specimen at the beam line; (b) schematic of the six neutron diffraction measurement points (p1 to p6) when the specimen is held at a particular load, as shown in (a); (c) six measurements across the section of the beam with time for load-unload cycles. Positions p1, p2 and p3 overlap with each other to give better resolution to the strain profile.
Figure 1a shows a photograph of the specimen being loaded at the beam line. Strain gauges were applied to the top and bottom surfaces of the specimen to monitor the applied bulk strain. The dimensions of the specimen were 10 mm x 20 mm x 150 mm; the loading span and supporting span were 50 mm and 128 mm respectively; loading-unloading cycles were carried out on the specimen, 24 steps of loading as shown in Figure 1b. Each data point in Figure 1b represents one measurement; the strain value at which the specimen was held whilst a diffraction measurement is made was obtained from the strain gauge at the top tensile
(a)
(c)
0 10 20 30 40 50
0 500 1000 1500 2000 2500 3000 3500
Strain from the top gauge
Ap
pli
ed
strain
(
)
Time (hrs) 300
600 900
600
0 600
900 1200
1500
900
0 900 1500
1800
900
0 900
1500 1800
2100 2300
2500 3000
Failure at 3202
surface. Three load cycles were measured, and each set of measurements took approximately 2 hrs, Figure 1c. Therefore, the graph plotted as a function of time shows the total number of points measured, and the specimen failed at 3202 με in the fourth cycle. At each step, measurements have been made at six positions, p1 to p6, across the section from tensile surface to compressive surface, Figure 1b. One of the detectors measured the in-plane lattice strain, i.e. the change of lattice spacing along the length of the beam when the specimen was deformed by the externally applied force. The out-of-plane strain due to the Poisson ratio is not within the scope of the present work.
The spacing of a lattice plane, dhkl, can be derived from the position of the corresponding peak using the
Bragg’s law:
𝑑ℎ𝑘𝑙 = ℎ
2𝑠𝑖𝑛𝜃𝑚(𝐿1+𝐿2)𝑡ℎ𝑘𝑙 (1)
where: h is the Planck constant; θ is half of the angle between the incident neutron beam and the diffracted
path; m is the neutron weight; L1 is the primary flight path for the neutron beam, which is about ~50 m to
minimise counting times; and L2 is the secondary flight path, i.e. the distance between the instrumental
gauge volume within the specimen and the detectors (~1.53 m). For the case of Gilsocarbon graphite, the peak position is determined using a least-squares refinement to fit individual peaks. The presence of elastic strain changes the magnitude of the lattice spacing, dhkl, so the evaluation of this strain for a grain family
requires a measure of the lattice spacing under the strain-free condition. In the present work, this condition was not achievable, so the measurements record the change of strain as a result of applied bulk strain.
RESULTS AND DISCUSSION
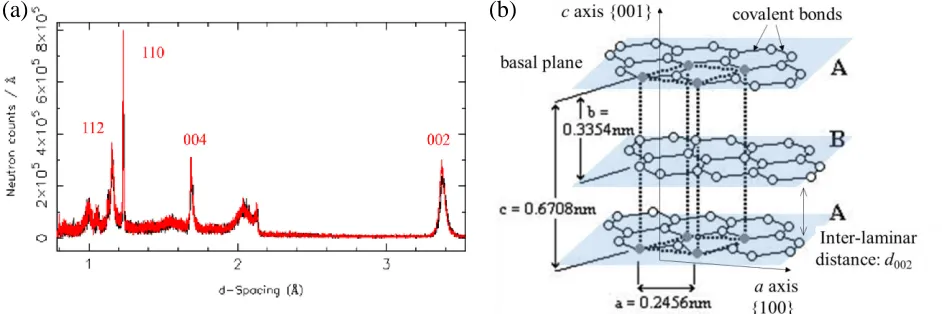
Two typical spectra (overlaid) obtained using the ENGIN-X neutron diffractometer are shown in Figure 2a
and the Miller indices, h k l, have been assigned according to the pseudohexagonal structure of graphite.
The software allows stacking of several spectra to compare the consistency, as shown in Figure 2a. TOF has been converted to d-spacing using software GSAS and Open Genie at ENGIN-X. The corresponding lattice
parameters, a, b and c, are shown in a unit cell of pseudohexagonal graphite, Figure 2b, where d002 is the
inter-planar distance (the stress-free theoretical value is ~0.335 nm).
Figure 2. (a) Typical spectrum of neutron flux as a function of d-spacing on Gilsocarbon graphite; (b) pseudohexagonal graphite unit cell and spacing parameters at stress-free condition.
Sensitivity of diffraction peaks with applied bulk strain
Four peaks, corresponding to the lattice planes {11.2}, {11.0}, {00.4} and {00.2}, have been investigated, as shown in Figure 2. All lattice spacing changes for each of the planes have been calculated for all the six positions, p1 to p6, at each loading step for all of the 24 loading conditions. The lattice strain, 𝜀ℎ𝑘𝑙, in terms
of the change in lattice spacing for a particular {hkl} plane, 𝑑ℎ𝑘𝑙, has been calculated using:
𝜀ℎ𝑘𝑙 = [𝑑ℎ𝑘𝑙− (𝑑ℎ𝑘𝑙)0] (𝑑⁄ ℎ𝑘𝑙)0 (2)
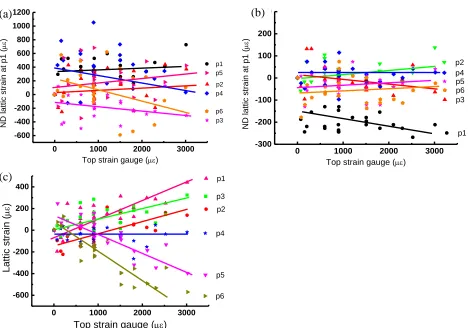
where (𝑑ℎ𝑘𝑙)0 is the lattice space measured for the load-free condition. In the current work, this reference value was obtained prior to loading of the beam specimen to provide relative change of lattice spacing, Δε. For example, in Figure 3a the lattice strain on the {11.2} plane has been calculated for position p1 at the 24 loading steps and the results are plotted as a function of the bulk strain (macro-scale strain measured by the strain gauge on the top surface of the beam specimen). This bulk strain is an indication of the amount of deformation that has been externally applied to the specimen. The same has been carried out for calculations relating to position p2. To compare the trends of change of all the positions, the results have been plotted in one graph for convenience, Figure 3a. For plane {11.2} the lattice spacing does not show an obvious or systematic change with the increase of bulk strain. For plane {11.0}, the same analysis procedure has been undertaken and the results are shown in Figure 3b. The lattice strain at position p1, which has the highest tensile strain since it is the nearest position to the top tensile surface, has negative values (compressive lattice strain) and becomes more compressive with increased tensile bulk strain. For the other five positions, there is not much variance in the measured lattice strain although the applied bulk strain varied from about -2300 µε to 2000 µε. Therefore, Figures 3a and 3b indicate that these two planes are insensitive to the externally applied bulk strain and are not suitable for the evaluation of strains in the current experiments.
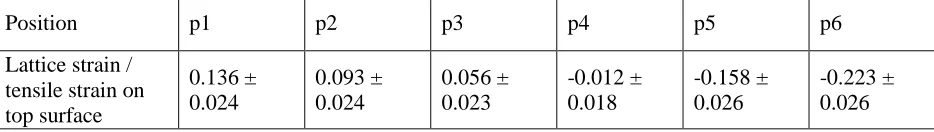
As {00.2} and {00.4} are both basal planes, only the results from {00.2} are shown here to avoid duplication. Figure 3c summarises analysis from the {00.2} diffraction peak, and there is a clear change of the peak position with applied bulk strain. For positions in the top, tensile, half of the beam, i.e. p1, p2 and p3, the gradient of change becomes less steep as the distance between the position and the neutral axis decreases. Particularly for position p4, at the neutral axis, there is no change (horizontal line) within the scatter of the data over the bulk strain range of 0 to 3200 µε. For positions measured in the compressive part of the beam, i.e. p5 and p6, the lattice strain becomes compressive as the beam is bent further. Position p6, the outmost position in the compressive side, has the largest compressive lattice strain. To summarise, the gradient of change at each position has been listed in Table I, and they are consistent with the beam-bending theory.
Table I. Gradient of lattice strain change with externally applied tensile strain at six positions.
Position p1 p2 p3 p4 p5 p6
Lattice strain / tensile strain on top surface
0.136 ± 0.024
0.093 ± 0.024
0.056 ± 0.023
-0.012 ± 0.018
-0.158 ± 0.026
Figure 3. The calculated relative lattice strain at all the six positions plotted as a function of the bulk strain measured by the top strain gauge on the tensile surface: (a) plane {11.2}; (b) plane {11.0}; (c) plane {00.2}.
Residual strain on unloading
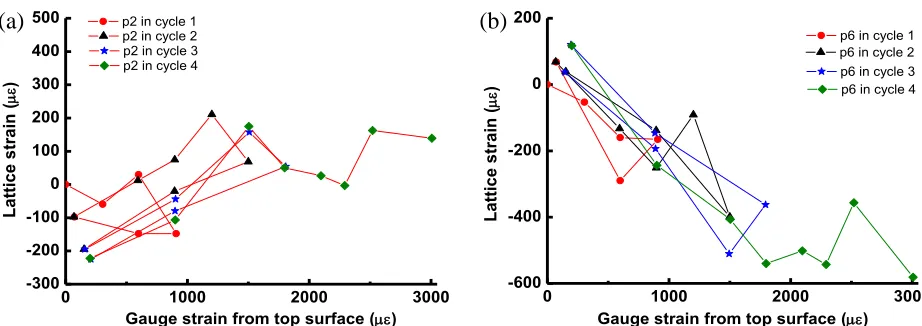
Evolution of the lattice strain of the basal plane {00.2} with the load and unload cycles has been analysed. Two positions were chosen: one close to the top tensile surface, position p2, Figure 4a; and the other close to the compressive bottom surface, position p6, Figure 4b. For clarity, each loading cycle has been separately plotted using a different symbol. As can be seen in Figure 4a, the lattice strain at position p2 was at zero prior to loading cycle 1. The peak loading in cycle 1 is ~900 µε (top tensile surface) and there is a residual compressive strain (~-100 µε) upon removal of the load once cycle 1 was completed. For further loading cycles to higher maximum strain (~1500 µε for cycle 2 and ~1800 µε for cycle 3), the residual compressive strain has increased to about ~220 µε, Figure 4a. The trend described above applies to positions in the tensile half of the beam.
However, for position p6, the opposite trend occurred, Figure 4b. As position p6 is at the compressive side, when the top strain gauge has a high tensile reading, position p6 is actually subjected to a similar level of compressive strain. It can be seen from Figure 4b that the residual lattice strain at p6 is in the tensile range after the first loading cycle and that this value increased in tension up to ~100 µε as the peak strain become higher in subsequent cycles. The trend described above applies also to position p5.
0 1000 2000 3000
-600 -400 -200 0 200 400 600 800 1000 1200 ND lat tic stra in a t p 1 ( )
Top strain gauge ()
p1 p2 p3 p4 p5 p6
0 1000 2000 3000
-300 -200 -100 0 100 200 300 ND lat tic stra in a t p 1 ( )
Top strain gauge ()
p1 p2 p3 p4 p5 p6
0 1000 2000 3000
-600 -400 -200 0 200 400 p1 La ttic st ra in ( )
Top strain gauge ()
p2 p3
p4
p5
p6
(a)
(b)
Figure 4. The change of lattice strain as a function of gauge strain from the top tensile surface during each loading cycle at: (a) position p2; (b) position p6.
This residual strain in the opposite sign is consistent with the presence of a residual strain within the material after manufacture. In the case described for position p1, it is more likely to be a tensile residual strain that has been subsequently relaxed by accumulated damage created during tensile loading. Therefore, the same volume has been subject to compression due to the constraint from the surrounding material. For position p6, subjected to a compressive strain during loading, a more tensile residual strain was observed after unloading to zero, probably due to consolidation of the porous structure by compression. Raman spectroscopy measurements showed that for unirradiated Gilsocarbon graphite the binder phase is in compression whereas the filler particles are in tension; cracks in filler and binder phases have shown mixed behaviour, compressive as well as tensile, while pores in binder and filler particles have shown compressive behaviour (Krishna et al. 2015).
Load-bearing mechanism
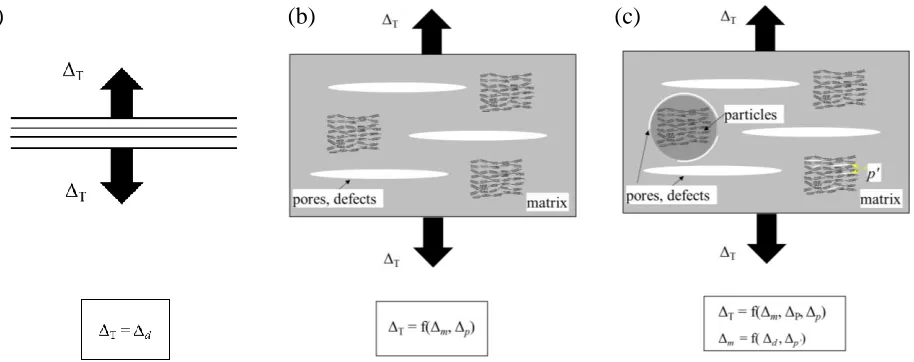
As shown in the previous section, Figure 3 and Table I, the {00.2} lattice strain changes linearly with the applied bulk strain (with scatter), but the elastic lattice strain is only 15-25 % of the total applied bulk strain. For a single crystal graphite contains parallel lattice, if a total uniaxial tensile deformation, ΔT, is applied
vertical to the lattice orientation, the measured elastic lattice strain, Δd, should be a true reflection of the
overall deformation, Figure 5a. However, nuclear Gilsocarbon graphite has a porous structure with large
pores and defects embedded in the matrix. Therefore, the total displacement, ΔT, is a function of both the
displacement of the matrix, Δm, and that of the pores and defects, Δp, Figure 5b. It is worth noting that the
parallel lattice planes indicated in Figure 5b are idealised for clarity of explanation as, in reality, the orientation of the crystals will be random.
In addition to the macro-pores that are discernible under optical microscopy, there are also harder phases present in Gilsocarbon graphite, such as particles, though these are usually surrounded by onion-shaped pores to separate them from the matrix, Figure 5c. TEM analysis has revealed Mrozowski cracks (a few nanometres wide by several micrometres long) running parallel to the basal plane within graphite crystals in Gilsocarbon graphite (Brocklehurst and Kelly 1993). These cracks are closed pores within the coke filler particles formed by preferred volume shrinkage during the calcination step of the manufacturing process. Taking these features into consideration, the applied deformation is therefore divided among the constituent phases:
ΔT = f(Δm, ΔP, Δp, Δp) (3)
0 1000 2000 3000
-300 -200 -100 0 100 200 300 400 500
Gauge strain from top surface ()
L
at
tic
e s
tr
ain
(
)
p2 in cycle 1 p2 in cycle 2 p2 in cycle 3 p2 in cycle 4
0 1000 2000 3000
-600 -400 -200 0 200
Gauge strain from top surface ()
L
at
tic
e s
tr
ain
(
)
p6 in cycle 1 p6 in cycle 2 p6 in cycle 3 p6 in cycle 4
where: ΔP is thedisplacement of the particles; and Δp’ is thedisplacement accommodated by the nano-scale
pores that lie parallel to the basal planes. The above example illustrated in Figure 5 is a simplified case under uniaxial tension to assist the understanding of the elastic strain and inelastic strain that could occur during the deformation of the bulk volume of material. Considering the complexity of the realistic microstructure, it is understandable that the actual lattice strain measured by neutron diffraction is much less than the total strain applied to the bulk volume.
Figure 5. Schematic showing the loading/displacement bearing mechanism in cases when a displacement is applied to: (a) a lattice; (b) a volume of material containing weak phases (pores, defects, etc) embedded in the matrix; (c) a volume of material containing weak phases (pores, defects, etc) in the matrix, stronger phases with pores separating it from the matrix and lattice-scale cracks that form between basal planes.
CONCLUSIONS
Neutron diffraction is a very effective means of quantifying changes in the spacing of lattice planes with respect to externally applied deformation. There are several points can be concluded:
The single-peak method gives good fitting to the shape of the peaks and, therefore, can be adopted
for strain measurements using neutron diffraction in nuclear graphite.
Residual strain exists in the as-manufactured unirradiated Gilsocarbon graphite, and this has to be
taken into account for in-service integrity analysis.
Amongst the many lattice planes in a hexagonal graphite crystal, the {00.4} and {00.2} planes are
sensitive to externally applied deformation and are suitable for elastic strain analysis.
The elastic lattice strains are found to be 0.15 - 0.25 times those of the applied bulk strain. This
indicates that the inelastic deformation has been accommodated by the complex microstructure.
ACKNOWLEDGEMENTS
The authors acknowledge financial support from EPSRC grant number EP/J019801/1 (Bristol): QUBE: QUasi-Brittle fracture: a 3D Experimentally-validated approach.
REFERENCES
Brocklehurst, J. E., Kelly, B. T. (1993). “The Dimensional Changes of Highly-Oriented Pyrolytic Graphite Irradiated with Fast Neutrons at 430°C and 600°C.” Carbon 31: 179-83.
Burchell, T. D. (1996). “A Microstructurally Based Fracture Model for Polygranular Graphites.” Carbon 34(3): 297-316.
Burchell, T. D. and Snead, L.L. (2007). “The Effect of Neutron Irradiation Damage on the Properties of Grade NBG-10 Graphite.” Journal of Nuclear Materials 371: 18-27.
Cahn, R.W. and Harris, B. (1969). “Newer Forms of Carbon and Their Uses.” Nature 221: 132-41.
Eason, E.D., Hall, G.N., Marsden, B.J., Heys, G.B. (2008). “Development of a Young’s Modulus Model
for Gilsocarbon Graphites Irradiated in Inert Environments.” Journal of Nuclear Materials 381:
145-51.
Hindley, M.P., Mitchell, M.N., Erasmus, C., McMurtry, R., Becker, T.H., Blaine, D.C., Groenwold, A.A.
(2013). “A Numerical Stress Based Approach for Predicting Failure in NBG-18 Nuclear Graphite Components with Verification Problems.” Journal of Nuclear Materials 436: 175-84.
Hodgkins, A., Marrow, T.J., Mummery, P., Marsden, B.J., Fok, A. (2006). “X-Ray Tomography Observation of Crack Propagation in Nuclear Graphite.” Materials Science and Technology 22: 151-1045.
Krishna, R., Jones, A.N., Edge, R., Marsden, B.J. (2015). “Residual Stress Measurements in Polycrystalline Graphite with Micro-Raman Spectroscopy.” Radiation Physics and Chemistry 111: 14-23.
Laudone, G.M., Gribble, C.M., Matthews, G.P. (2014). “Characterisation of the Porous Structure of Gilsocarbon Graphite Using Pycnometry, Cyclic Porosimetry and Void-Network Modeling.” Carbon 73: 61-70.
Liu, D., Nakhodchi, S., Heard, P., Flewitt, P.E.J. (2015). “Small-Scale Approaches to Evaluate the Mechanical Properties of Quasi-Brittle Reactor Core Graphite.” Graphite Testing for Nuclear Applications: The Significance of Test Specimen Volume and Geometry and the Statistical Significance of Test Specimen Population STP1578 (Nassia Tzelepi and Mark Carroll, Eds.): 1-21. Moskovic, R., Heard, P.J., Flewitt, P.E.J., Wootton, M.R. (2013). “Overview of Strength, Crack Propagation
and Fracture of Nuclear Reactor Moderator Graphite.” Nuclear Engineering and Design 263:
431-42.
Santisteban, J. R., Daymond, M. R., James, J. A., Edwards, L. (2006). “ENGIN-X: A Third-Generation Neutron Strain Scanner.” Journal of Applied Crystallography 39: 812-25.