See discussions, stats, and author profiles for this publication at: https://www.researchgate.net/publication/220793388
Intelligent Clustering with PCA and
Unsupervised Learning Algorithm in Intrusion
Alert Correlation
Conference Paper · January 2009 DOI: 10.1109/IAS.2009.261 · Source: DBLP
CITATIONS
5
READS
96
3 authors, including:
Some of the authors of this publication are also working on these related projects:
Feature Extraction View project
Efficient Anomaly Detection Model for Wireless Sensor Networks View project Maheyzah Md Siraj
Universiti Teknologi Malaysia
17PUBLICATIONS 34CITATIONS
SEE PROFILE
Mohd Aizaini Maarof
Universiti Teknologi Malaysia
150PUBLICATIONS 598CITATIONS
SEE PROFILE
All content following this page was uploaded by Maheyzah Md Siraj on 30 August 2017.
Intelligent Clustering with PCA and Unsupervised Learning Algorithm in Intrusion
Alert Correlation
Maheyzah Md Siraj, Mohd Aizaini Maarof, Siti Zaiton Mohd Hashim
Faculty of Computer Science and Information Systems Universiti Teknologi Malaysia
81310 Skudai Johor, Malaysia
E-mail: {maheyzah, aizaini, sitizaiton}@utm.my
Abstract—As security threats advance in a drastic way, most of the organizations implement multiple Network Intrusion Detection Systems (NIDSs) to optimize detection and to provide comprehensive view of intrusion activities. But NIDSs trigger a massive amount of alerts even for a day and overwhelmed security experts. Thus, automated and intelligent clustering is important to reveal their structural correlation by grouping alerts with common attributes. We propose a new hybrid clustering model based on Improved Unit Range (IUR), Principal Component Analysis (PCA) and unsupervised learning algorithm (Expectation Maximization) to aggregate similar alerts and to reduce the number of alerts. We tested against other unsupervised learning algorithms to validate the performance of the proposed model. Our empirical results show using DARPA 2000 dataset the proposed model gives better results in terms of the clustering accuracy and processing time.
Keywords-alert correlation; alert clustering; unsupervised learning; PCA; Expectation Maximization
I. INTRODUCTION
In order to maintain trust in systems, mechanisms are deployed that monitor any violation of such perception. Network Intrusion Detection Systems (NIDSs) have been extensively used by researchers and practitioners to maintain trustworthiness in systems [1]. However, NIDSs usually generated thousands of alerts even for a day. Worse, those alerts are mixed with false positives, and repeated warnings for the same attack, or alert notifications from erroneous activity [2]. Therefore, manually analyze those alerts are tedious, time-consuming and error-prone [3].
A promising technique to automatically analyze the intrusion alerts is called correlation. In specific, Alert Correlation System (ACS) is post-processing modules that provide high-level insight on the security state of the network and filter false positives as well as redundant alerts efficiently from the output of NIDSs. The analyses from ACS actually become an important guidance for security expert (SE) to plan and develop the responsive and preventive mechanisms. Generally, correlation can be of two types: structural correlation and causal correlation. In this paper, we address the structural correlation (or alert clustering) aspect of NIDSs data to aggregate alerts with similar attributes.
The main problem in existing ACSs is they require high levels of human involvement in creating the system and/or maintaining it, as patterns of attacks change as often as from month to month [4]. Our goal is to minimize the intervention (i.e., to ease the burden) of SE as much as possible, but not to replace them. Therefore, an unsupervised learning-based clustering model is proposed to reduce the number of alerts and to discover the attack steps launched by attackers. We propose a new hybrid clustering method called Improved Unit Range and Principal Component Analysis with Expectation Maximization (IPCA-EM), for alert aggregation in ACS.
The following section outlines the overview of some related researches and provides necessary background information in the area of intrusion alert correlation. Section 3 describes our proposed approach, elaborating each component involved in the system architecture. Section 4 explains the dataset, experiments conducted followed by discussions of the results. Lastly, we conclude the paper and present potential future work.
II. RELATED WORK
Most of the previous works of alert clustering for finding structural correlation [e.g., 2, 3, 5, 6, 7] required strong dependencies on SE in developing and/or maintaining their correlation system. They either need pre-defined rules or human expert knowledge to manage and analyze the intrusion alerts. As a result, rules or knowledge for such systems need to be updated periodically as patterns of attacks change drastically.
In [3], Aggregation and Correlation Component (ACC) is proposed to group alerts into situations based on any combination of the three attributes: source, target and alert class. ACC relies on a set of rules to cluster the alerts. Whilst in CRIM [6] and Rule-Based Temporal ACS [7], they implemented a knowledge-based database to correlate and filter false positives alerts. Such database stored predicate logics to support logical reasoning in finding similarity between incoming alerts and existing alerts. In both cases, these approaches were time-consuming since they required a large number of predefined rules/knowledge in order to correlate alerts.
There are few works that cluster alerts based on supervised machine learning. For instance, algorithm introduced by [5] required a significant amount of alerts to 2009 Fifth International Conference on Information Assurance and Security
978-0-7695-3744-3/09 $25.00 © 2009 IEEE DOI 10.1109/IAS.2009.261
be managed manually (i.e., hand-clustered) beforehand. Likewise, system by [2] required manual tuning periodically. Moreover, in their first system deployment, it needs to encode network properties to assist the clustering algorithm. Again, these approaches were time-consuming since regular setup and maintenance are significantly required for their system. Therefore, those constraints make the development of supervised learning-based correlation system less practical.
The closest work to ours was by [4] which used Expectation Maximization (EM) clustering algorithm as well in their second stage of correlation. A major different is that we implemented Principal Component Analysis (PCA) to obtain better performance. Detail justifications on the implementation of PCA in our work are presented in the next section.
III. SYSTEM ARCHITECTURE
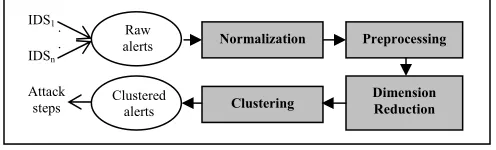
The goal of this work is to find the best integration of PCA and unsupervised learning algorithm for clustering intrusion alerts. Our system architecture composed of four main components as in Figure 1 (i.e., normalization, preprocessing, dimension reduction, and clustering). In the first component, alerts that were generated by multiples NIDSs are collected and stored in database before they were modeled and converted into a standard format called Intrusion Detection Message Exchange Format (IDMEF). The formatted alerts were represented in numerical value and scaled to produce a balanced dataset. Since the number of alerts was huge and the alerts information was massive, we reduced the dimensionality of data using PCA. There were four unsupervised learning clustering algorithms tested. Among them, the EM gave better performance. Alerts in each cluster were ranked based on their severity level in order to discover the high and low risks of alerts. Based on the sensor’s signatures file, alerts were verified to determine the false positives and invalid alerts. In the last component, the system automatically merged redundant alerts, and discarded false positives and invalid alerts.
Figure 1. Our proposed system architecture.
A. Alert Normalization
Recently, organizations use cooperative NIDSs to provide better detection and global view of intrusion activities. This contributes to the diversity of output formats. In order to correlate alerts such diversified formats have to be converted into a unified standard representation. We applied IDMEF [8] to define the common data formats for the alerts. We extracted nine attributes for each alert. Thus, a vector for an alert A = {AlertID, SensorID, DetectTime,
SourceIPAddress, SourcePort, DestinationIPAddress, DestinationPort, ServiceProtocol, AlertType}. A sample of an alert in IDMEF is illustrated in Figure 2. All alerts are stored in a database.
Referring to Figure 2, the alert is uniquely identified by the ‘Alert ident’ attribute. The service section describes network services on targets. In this case, it contains two attributes, namely protocol (tcp) and port (22). The target node address is specified by the target element and the alert message is given by the Classification name attribute. This alert simply reports a stealth scan on port 22 from 135.013.216.191 to 172.016.112.149. Note that stealth scan attack is a kind of scan that is designed to go undetected by auditing tools. So scanning very slowly becomes a stealth technique.
<IDMEF-Message/> <?xml version="1.0"?>
<!DOCTYPE IDMEF-Message PUBLIC "-//IETF//DTD RFC XXXX IDMEF v1.0//EN" "/usr/local/etc/idmef-message.dtd">
<IDMEF-Message version="1.0"> <Alert ident="289">
<Analyzer analyzerid="109" model="snort" version="2.0.5"> <Node>
<name>tcpdump_dmz</name> </Node>
</Analyzer>
<CreateTime ntpstamp="0xc36cc187.0xd3aa9b49">2007-11-24T17:42:31Z</CreateTime>
<Source> <Node>
<Address category="ipv4-addr"> <address>135.013.216.191</address> </Address>
</Node> <Service>
<port>22</port>
<protocol>tcp</protocol> </Service>
</Source> <Target> <Node>
<Address category="ipv4-addr"> <address>172.016.112.149</address> </Address>
</Node> <Service>
<port>22</port>
<protocol>tcp</protocol> </Service>
</Target>
<Classification origin="vendor-specific">
<name>msg=(spp_stream4) STEALTH ACTIVITY (NULL scan) detection</name>
<url>none</url> </Classification> </Alert>
</IDMEF-Message>
Figure 2. IDMEF representation of an alert in an XML document.
B. Alert Preprocessing
Alert attributes are in the form of numerical and non-numerical values. Attributes that contain non-numerical values are AlertID, SensorID, SourcePort, DestinationPort, and DetectTime. The rest are non-numerical values (i.e., SourceIPaddress, DestinationIPaddress, ServiceProtocol and AlertType) and have to be mapped into numerical values. For instance to convert a 32-bit IP address (IPaddr) which in
X1.X2.X3.X4 format, mapping as (1) was used. Normalization Preprocessing
Dimension Reduction Clustering
Clustered alerts Raw alerts IDS1
IDSn
. .
Attack ps ste
IPaddr = ((X1 x 256 + X2) x 256 + X3) x 256 + X4. (1)
We scaled all values in the range of [0,1] using Improved Unit Range (IUR) scaling method as in (2) because it eliminates zero lva ues.
ݔƍൌ ͲǤͺ ሺ௫ି௫ሻ
ሺ௫ೌೣି௫ሻ ͲǤͳ (2)
where x’ is the scaled value, x is raw value, xmax is
maximum value and xmin is minimum value.
C. Dimension Reduction with PCA
PCA has proven to be a useful technique for dimension reduction and multivariate analysis [9]. An important virtue of PCA is that the extracted components are statistically orthogonal to each other which can contribute to speedup training and robust convergence. With these advantages, we expect that the unsupervised learning algorithm can work much better with PCA.
According to [9], the definition of PCA is that, for a set of observed vectors {vi}, i
{1,2,...,N}, the q principle axes{wj}, j
{1,2,..,q} are those orthonormal axes onto whichthe retained variance under projection is maximal. It can be shown that the vectors wj are given by the q dominant
eigenvectors (i.e., those with largest associated eigenvalues)
of the covariance matrix
T
i
i i
N v v v v
C
¦
such that, where
j i
j
w
Cw
O
v
is the simple mean. The vectorv W
ui T vi , where
q
w w w
W 1, 2,..., , is thus a q-dimensional reduced representation of the observed vector
.
^ `
viFor the intrusion alerts in the dataset, the purpose of performing PCA is to find the principal components of the alerts, (i.e., the attributes vector that can describe the alerts exactly and sufficiently) but not redundantly. In mathematical terms, we wished to find the principal components of the distribution of the alerts, or the eigenvectors of the covariance matrix of the set of the alerts [9].
D. Alert Clustering with Unsupervised Learning
Besides EM, we tested against other three unsupervised learning algorithms namely Self-organizing maps (SOM), K-Means, and Fuzzy C-Means (FCM) for performance comparison.
The EM algorithm consists of two repeated steps, Expectation and Maximization. It uses a statistical model called Gaussian finite mixtures model (GMM) to achieve the goal of producing the most likely set of clusters given the number of clusters, k, and a set of data. The model consists of a set of k probability distributions, one to represent the data of each cluster. There are parameters (e.g., number of iteration and log likelihood difference between two iterations) that define each of the k
distributions. The EM algorithm begins by making initial guesses for these parameters based on the input data, then determines the probability that a particular data instance belongs to a particular cluster for all data using these parameter guesses. The distribution parameters are revised again and this process is repeated until the resulting clusters have some level of overall cluster ‘goodness’ or until a maximum number of algorithm iterations are reached.
In particular, it attempts to find the parameters ș, that maximize the log probability logP(x;ș) of the observed data. It reduces the difficult task of optimizing logP(x;ș) into a sequence of simpler optimization subproblems, whose objective functions have unique global maxima that can often be computed in closed form. These subproblems are chosen in a way that guarantees their corresponding solutions
I
(1),I
(2),... and will converge to a local optimumof logP(x;ș).
More specifically, the Expectation step (E-step) of the algorithm estimates the clusters of each data instance given the parameters of the finite mixture. The algorithm chooses a function gt that lower bounds logP(x;ș) everywhere, and
for which gt(
I
(1))=logP(x;I
(t)).The Maximization step (M-step) of the algorithm tries to maximize the likelihood of the distributions that make up the finite mixture, given the data [4]. The algorithm moves to a new parameter set
I
(t+1), that maximizes g. As the value ofthe lower-bound g matches the objective function at
t
t
I
(t), itfollows (3), so the objective function monotonically increases during each iteration of EM [10].
logP(x;ҏ
I
(t)) = g(t
I
(t))d
gt(I
(t+1)) = logP(x;ҏI
(t+1)) (3)IV. EXPERIMENTS AND RESULTS
The experiments were conducted on MIT Lincoln’s Lab’s DARPA 2000 Scenario Specific Dataset [11] which contains simulated multi-staged attack scenarios in a protected environment: the intruder probes, breaks-in, installs the Distributed Denial-of-Service (DDoS) daemon and launches a DDoS attack against an off-site server. Since we are dealing with the sensor data, we used alerts reported by RealSecure Network Sensor Version 6.0 [12] which were provided by [13] to evaluate the effectiveness of our model.
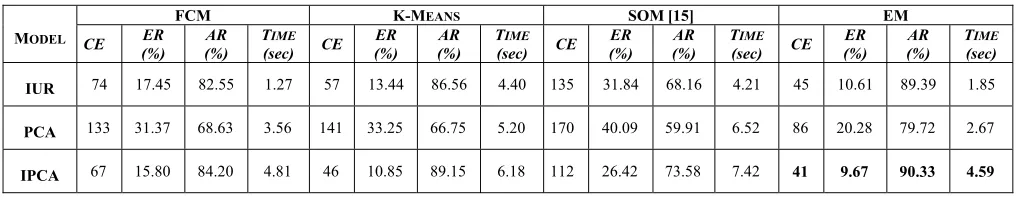
The alerts data represents two kinds of attack scenarios (i.e., scenario 1.0 and scenario 2.0.2) in two types of networks (i.e., inside and dmz network). Attacks in scenario 2.0.2 were stealthier than scenario 1.0. In this paper we only present results based on alerts data for scenario 2.0.2 in dmz network. For implementation of the model, we used MATLAB Software [14]. We have conducted three set of experiments as in Table I: (1) clustering with IUR only (i.e., labeled as IUR), (2) clustering with PCA only (i.e., labeled as PCA), and (3) clustering with IUR and PCA (i.e., labeled as IPCA).
TABLE I. CLUSTERING PERFORMANCE
The results for all three set of experiments are shown in Table I. The number of alerts tested was 430. The results obtained were compared against the benchmark clusters (i.e., 16 clusters are expected) to determine the performance of the proposed model.
We used four measurements: (1) Clustering Error (CE) is the number of alerts that are wrongly clustered. (2) Error Rate (ER) is the percentage of wrongly clustered alerts, ER = (CE ÷ Total number of alerts observed) x 100, (3) Accuracy Rate (AR) is the percentage of alerts that are accurately clustered as they should be, AR = 100 – ER, and (4) Time is the algorithm processing time in seconds.
We varied the number of clusters in FCM, K-Means, and EM to find the optimal results. Similarly, we tested the SOM by simultaneously varying the epochs and lattice configuration. Two third of the dataset were used for training and the rest for testing. The best result on SOM (i.e., 73.58% with IPCA) was attained after it was trained for 2500 epochs using hexagonal 4 by 6 lattice type. It produced 12 clusters. SOM’s overall processing time for training and testing was 7.42 seconds. The processing time might be longer if the dataset, epochs and/or lattice type are larger.
Overall, the best clustering performance was EM (i.e., 90.33% with IPCA) which is reached at 14 clusters in just 4.59 seconds. In each cluster, similar types of alerts are grouped together to represent an attack step. Since FCM, K-Means, and SOM have larger value of CE, this means that theyput a large number of alerts that should belong together in one cluster into other different clusters. Therefore, we summarized that the proposed model (i.e., IPCA-EM) was effective and performed better for this dataset in terms of clustering accuracy and processing time.
V. CONCLUSION AND FUTURE WORK
We propose a new hybrid clustering model based on IPCA and EM clustering algorithm to aggregate alerts and to reduce the number of alerts. Altogether, the results were encouraging in term of clustering accuracy rate and processing time compared to other unsupervised learning algorithms tested in this paper. It is important to note that a successful network attack consists of multi-stages attack, and an attack stage may comprise of one/more attack steps. In this work, the clusters reveal the attack steps. Thus, we need a secondary clustering component to aggregate similar attack types to reveal the stages of attack. Besides testing the proposed model with larger dataset, in the near future we
would like to develop a collaborative multi-stages correlation system to determine known and unknown attack scenarios.
ACKNOWLEDGMENT
This paper is based upon study sponsored by Ministry of Higher Education (MOHE), Malaysia.
REFERENCES
[1] A. Siraj, and R. B. Vaughn, “Multi-level alert clustering for Intrusion Detection Sensor data,” Proc. of the North American Fuzzy Information Processing Society, 2005, pp. 748-753.
[2] K. Julisch, and M. Dacier, “Mining intrusion detection alarms for actionable knowledge,” Proc. of the 8th ACM Int. Conf. on Knowledge Discovery and Data Mining, 2002, pp. 366–375.
[3] H. Debar, and A. Wespi, “Aggregation and correlation of intrusion detection alerts,” Proc. of the 4th Int. Symp. on Recent Advances in Intrusion detection, 2001, pp. 87–105.
[4] R. Smith, N. Japkowicz, M. Dondo, and P. Mason, “Using unsupervised learning for network alert correlation,” Springer-Verlag LNAI 5032, 2008, pp. 308-319.
[5] O.M. Dain, and R. K. Cunningham, “Fusing a heterogeneous alert stream into scenarios,” ACM Workshop on Data Mining for Security Applications, 2001, pp. 1-13.
[6] F. Cuppens, and A. Miege, “Alert correlation in a cooperative intrusion detection framework,” Proc. of the IEEE Symp. on Security and Privacy, 2002, pp. 202-215.
[7] P. Kabiri, and A. A. Ghorbani, “A rule-based temporal Alert Correlation System,” Int. J. of Network Security, vol. 5, no. 1, 2007, pp. 66–72.
[8] H. Debar, D. Curry, and B. Feinstein, The Intrusion Detection Message Exchange Format (IDMEF), ftp://ftp.rfc-editor.org/in-notes/rfc4765.txt,(current Mar. 2007).
[9] I. T Jolliffe, Principal Component Analysis, 3rd ed. New York: Springer Verlag, 2002.
[10] C. B. Do, and S. Batzoglou, “What is the Expectation Maximization algorithm?,” Nature Biotechnology, vol. 26, 2008, pp. 897-899.
[11] MIT Lincoln Lab, DARPA 2000 Scenario Specific Dataset, http://ideval.ll.mit.edu/2000index.html, (current June 2008).
[12] Internet Security Systems, RealSecure Network, http://www.iss.net/products_services/enterprise_protection/rsnetwork/senso r.php, (current Jan. 2008).
[13] P. Ning, TIAA : A Toolkit for Intrusion Alert Analysis, http://discovery.csc.ncsu.edu/software/, (current Mar. 2008).
[14] MATLAB, http://www.mathworks.com/, (current Dec. 2008). [15] A. Faour, P. Leray, and B. Eter, “Automated filtering of network intrusion detection alerts,” Proc. 1st Joint Conf. on Security in Network Architectures and Security of Information Systems, France, 2006, pp. 277-291.
MODEL
FCM K-MEANS SOM [15] EM
CE (%) ER (%) AR T(sec) IME CE (%) ER (%) AR T(sec) IME CE (%) ER (%)AR T(sec)IME CE (%)ER (%)AR T(sec)IME
IUR 74 17.45 82.55 1.27 57 13.44 86.56 4.40 135 31.84 68.16 4.21 45 10.61 89.39 1.85
PCA 133 31.37 68.63 3.56 141 33.25 66.75 5.20 170 40.09 59.91 6.52 86 20.28 79.72 2.67
IPCA 67 15.80 84.20 4.81 46 10.85 89.15 6.18 112 26.42 73.58 7.42 41 9.67 90.33 4.59
682