How training and testing histories affect
generalization: a test of simple neural networks
Stefano Ghirlanda
1,2,*
and Magnus Enquist
2,3 1Department of Psychology, University of Bologna, 40127 Bologna, Italy,
2Group for Interdisciplinary Cultural Research, and3Zoology Institution, Stockholm University, 10691 Stockholm, Sweden
We show that a simple network model of associative learning can reproduce three findings that arise from particular training and testing procedures in generalization experiments: the effect of (i) ‘errorless learning’, (ii) extinction testing on peak shift, and (iii) the central tendency effect. These findings provide a true test of the network model which was developed to account for other phenomena, and highlight the potential of neural networks to study the phenomena that depend on sequences of experiences with many stimuli. Our results suggest that at least some such phenomena, e.g. stimulus range effects, may derive from basic mechanisms of associative memory rather than from more complex memory processes.
Keywords:animal behaviour; neural networks; range effects; generalization
1. INTRODUCTION
This paper deals with a general issue in the study of animal behaviour that we call path dependence. The expression refers to the fact that different histories of experiences (paths) may at first seem to produce the same behavioural effects, yet reveal important differences when further examined. For instance, two training procedures may establish the same discrimin-ation between the two training stimuli, yet produce different responses to other stimuli, because the two paths have produced different internal states within the animal. There are several reasons why path dependence is an important issue. First, it comprises many phenomena that can provide stringent tests for theories of behaviour. Second, path dependence is at the root of several controversies; for instance, whether animals encode absolute or relative charac-teristics of stimuli (Spence 1936;Helson 1964;Thomas 1993; Sarris 2003), whether learning phenomena such as backward blocking and unovershadowing imply, in addition to basic associative learning, stimulus– stimulus associations or changes in stimulus associability (Wasserman & Berglan 1998; Le Pelley & McLaren 2003;Ghirlanda 2005).
In this paper, we use a simple neural network model of basic associative learning (Blough 1975;Enquist & Ghirlanda 2005) to show how path dependence can arise from fundamental properties of associative memory. The model has two core components: (i) distributed representations of stimuli based on the knowledge of sensory processes and (ii) a simple learning mechanism that can associate stimulus
representations with the responses. We consider examples of path dependence in experiments on generalization (or ‘stimulus control’). These consist of a training phase in which animals are trained to perform a specific response to several stimuli and a test phase in which responding to a set of stimuli is recorded. The test stimuli often lie on a ‘stimulus dimension’ such as light wavelength or object size so that generalization is often described as a response gradient over the dimension. In generalization experi-ments, path dependence appears as differences in the shape of generalization gradients; different paths correspond to different training or testing procedures. We show that the model accounts for the following phenomena (see§3 for details): lack of peak shift after ‘errorless discrimination learning’, decrease of peak shift during extinction testing and the shift of generalization gradients towards the average of the test stimuli (a kind of range effect).
Although we consider laboratory experiments, it is hardly necessary to note that path dependence exists in the wild as well, where paths are the consequence of environmental events rather than being arranged by an experimentalist.
2. MODEL
(a)The neural network
Nervous systems can be seen as a flexible structure that can be programmed to generate almost any behaviour, e.g. relationships between stimuli and responses. Concretely, such programming includes both the formation of the neural network and its pattern of connectivity and the adjustment of connections between cells in the network. Neural network models provide an understanding of how such processes can ultimately produce the behaviour we see in animals (Arbib 2003; Enquist & Ghirlanda 2005). Previous work has shown that the simple neural network doi:10.1098/rstb.2006.1972
Published online
Electronic supplementary material is available athttp://dx.doi.org/10. 1098/rstb.2006.1972or viahttp://www.journals.royalsoc.ac.uk.
One contribution of 15 to a Theme Issue ‘The use of artificial neural networks to study perception in animals’.
models of associative learning can reproduce many fundamental findings of learning and generalization (Blough 1975; Enquist & Ghirlanda 2005; Ghirlanda 2005). Here, we use a standard feed-forward network with an array of input nodes connected directly to one output node (there are no hidden nodes). Stimuli are modelled as eliciting graded patterns of activity in the array of input nodes. We writeSi, the activity induced in input node i by stimulus S (iZ1,.,N). The input nodes are connected to the output node by weighted connections, the weight attached to node i being Wi. The strength or likelihood of responding to S is assumed to be an increasing function of the weighted sumrS
rSZ
X
i
WiSi: ð2:1Þ
(b)Learning
We model learning by the so-calleddrule (McClelland & Rumelhart 1985), a simple case of gradient descent algorithms (Haykin 1999) that was first derived by Widrow & Hoff (1960)and introduced to animal learning theory by Blough (1975), based on previous work by Rescorla & Wagner (1972). At each stimulus presen-tation, the algorithm prescribes a changeDWiin weight Wiaccording to
DWiZaðlKrSÞSi; ð2:2Þ
wherelis the maximum value responding toScan attain given the applied reinforcer, andamainly regulates the speed of learning (Widrow & Stearns 1985). Equation (2.2) is capable, through repeated applications, of establishing a different response to each of many stimuli, provided the corresponding patterns of activity satisfy certain requirements (‘linear separability’). We refer to the literature for technical details and other applications to behaviour theory (Blough 1975;Widrow & Stearns 1985; McClelland & Rumelhart 1986; Rumelhart & McClelland 1986; Haykin 1999; Enquist & Ghirlanda 2005). Weights are assumed to start from a value of zero (drawing weights at random from a distribution symmetrical around zero would lead to the same conclusions).
(c)Model stimuli and generalization tests
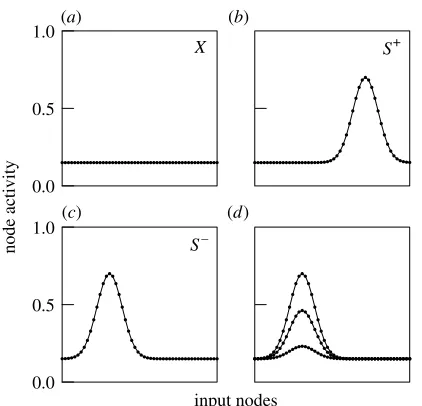
The results below do not depend on the precise details of how stimuli are modelled, as long as the following general properties hold: (i) input node activity is positive; (ii) each stimulus corresponds to a graded pattern of activity in input nodes; (iii) physically more similar stimuli correspond to more similar patterns of activity; and (iv) higher intensity of stimulation corresponds to higher input node activity. Figure 1 shows the kind of model stimuli we use in practice. Dimensions such as sound frequency, light wavelength or spatial position can be modelled by translating an activity profile like the one infigure 1bover the input array of the network. This simple scheme captures the empirical observation that a stimulus change along these dimensions causes a change in the pattern of receptor activity but not in total activity. Conversely, stimulus intensity dimensions are modelled by increas-ing or decreasincreas-ing input node activity without changincreas-ing
which input nodes are stimulated (figure 1d). We refer to Ghirlanda & Enquist (2003) and Enquist & Ghirlanda (2005) for further details. Once stimulus dimensions have been defined, a generalization test is modelled simply by presenting the network with some stimuli from the dimension and recording the corre-sponding network output.
(d)Network analysis
Neural networks can be analysed through a variety of tools (Haykin 1999), such as formal mathematics, computer simulations and visualization techniques that highlight some aspects of network organization and functioning. In this paper, we simulate the training and testing phases of generalization experiments and analyse the resulting network by plotting the weight array. The latter will usually contain both positive and negative weights, and the output to a particular stimulus will depend on the degree to which the corresponding pattern of activity overlaps with the positive and the negative weights. This, as we shall see, allows us to understand how the network responds to stimuli based on graphical representations of weight arrays and stimulus activity patterns.
3. RESULTS
(a)Errorless discrimination learning
The first step in most experimental studies of generalization is to train animals to discriminate between several stimuli. The experimenter wishes, for instance, to have animals respond to a given stimulus,
S+
0.0 0.5 1.0
X
0.0 0.5 1.0
S–
node activity
input nodes
(a) (b)
(d)
(c)
Figure 1. Examples of network input patterns used in this paper. The network input nodes are considered as a one-dimensional sense organ and each panel depicts the pattern of activity corresponding to a particular stimulus. (a) Back-ground stimuli are modelled as causing low activity in all input nodes (e.g. a dimly illuminated Skinner box). (b) A particular stimulus, e.g.SC
calledSC, and to ignore another one, calledSK. This may be achieved by instrumental conditioning, whereby responses toSC
are ‘reinforced’, e.g. with food, whereas responses toSK
are not (Pearce 1997). Details of training may vary, but it is most common to first train the desired response toSCand then to introduceSK. The animal will usually respond toSKin the first stages of discrimination training (especially ifSK
is similar toSC
), but if such responses are never reinforced, the animal will respond less and less toSK. In practice, discrimination training is continued until a criterion is met such as ‘three times more responding toSCthan toSK’ or ‘no responses to SK
in a 10 min period’.
When a generalization test is performed after discrimination learning, one may find that the stimulus which elicits most responses is notSC, but a stimulus that is displaced away from SC so as to be more different from SK
(figure 2a, dotted line). Since its discovery byHanson (1959), this phenomenon, called the ‘peak shift’, has fuelled extensive research to understand how a stimulus that was never reinforced (and in many cases, never experienced) could be more powerful in eliciting a response than a reinforced stimulus (Mackintosh 1974). It has been known, at least since the pioneering work ofBlough (1975), that simple network models can reproduce the peak shift phenomenon. We will briefly review the mechanism below, referring to Enquist & Ghirlanda (2005) for further discussion. The dotted line infigure 2bshows a peak shift obtained from a neural network simulation of a discrimination experiment. For technical details regarding this and all other simulations in the paper, we refer to the electronic supplementary material.
Figure 2a also shows a generalization gradient without a peak shift (continuous line), although the same SC and SK have been used in training. The difference is that training did not follow the standard procedure outlined above but an alternative one, ‘errorless discrimination learning’, developed by Herbert Terrace at the beginning of the 1960s. In errorless discrimination learning, SK is introduced gradually rather than abruptly. For instance, in the experiment in figure 2, Terrace (1964) trained a discrimination between a 580 nm monochromatic light (SC) and a 540 nm light (SK), beginning with a very faint 540 nm light whose intensity was pro-gressively increased until an intensity equal to SC was reached. The name ‘errorless learning’ derives from the fact that the animal responds very little toSK throughout training. Intuitively this happens because, at any given moment,SKis very similar to previously unreinforced stimuli (including, at the start of training, the experimental background), and thus has only a small probability of eliciting a response. Additionally, initialSK presentations are so brief that the animal is effectively prevented from responding.
Terrace’s finding that errorless learning prevents the peak shift has been replicated a few times, but no agreement exists as to its causes (Purtle 1973). Our aim is to explore what insight can be gained by simulating errorless learning with neural networks. We mimic Terrace’s procedure by starting with a modelSK
of low intensity (low activation of network input nodes) and progressively increasing its intensity, as shown for
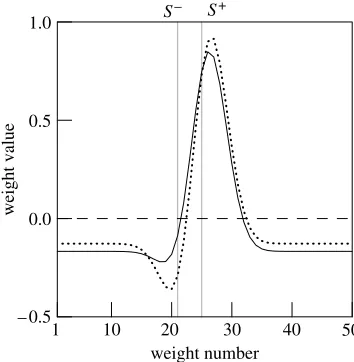
instance in figure 1d. The resulting generalization gradient (continuous line infigure 2b) peaks onSCin agreement with Terrace’s empirical result. To under-stand why this happens, we plot infigure 3the weight values obtained after both standard and errorless training. After standard training (dotted line), both positive and negative weights develop, associated respectively with parts of the input array most activated by SC
and SK
. When peak shift occurs, maximum response is observed for stimuli that are close to SC, but more distant fromSKthanSCitself. Such stimuli retain most ofSC
’s ability to excite nodes with positive weight while activating nodes with negative weights significantly less, which results in a more favourable balance between excitation and inhibition. During errorless learning, on the other hand, the input nodes most stimulated by SK
develop very small negative weights (continuous line). Thus, the gains of departing from SK
cannot offset the losses caused by departing from SC. Interestingly, this explanation is consistent with Terrace’s suggestion that errorless learning results in little inhibition being associated withSK
.
0.0 0.5 1.0
500 550 600 650
S+
S–
light wavelength (nm)
responses relative to
S
+ S
+
S–
0.0 0.5 1.0
15 25 35
stimulus position
network output relative to
S
+
(a) (b)
Figure 2. ‘Errorless’ discrimination learning. (a) General-ization gradients from two groups of pigeons trained to solve a discrimination between monochromatic lights with a standard procedure (dotted line) or ‘errorless learning’ (see text; data fromTerrace 1964). Only the gradient from the former group shows a peak shift. (b) A neural network simulation of generalization after standard (dotted line) versus ‘errorless’ (continuous line) learning yields similar results.
S+
S−
– 0.5 0.0 0.5 1.0
1 10 20 30 40 50
weight number
weight value
The reason why the weights develop as shown in figure 3can be understood by imagining what happens in the initial phases of training. The low intensity SK used at the start of errorless learning is very similar to the background stimuli to which response is low (e.g. the dark response key in Terrace’s experiment). To ensure that response to such anSKbe low, therefore, it is sufficient to adjust the weights only a little. On the other hand, at the beginning of standard training,SK
is an intense stimulus not unlike SC
and thus produces ‘errors’ in the form of high network output, while the desired response is a low output. The learning algorithm must thus decrease response toSK consider-ably, which is achieved by attaching negative weight to the input nodes most stimulated bySK
.
(b)Disappearance of peak shift in extinction
The outcome of a generalization test can be affected by different aspects of the testing procedure, e.g. its duration and what stimuli are used. The reason is, of course, that animals continue to learn during a test. Thus test results are not, as one would like, simply the result of probing the animal, but are partly due to learning caused by probing itself. The most common testing paradigm is testing ‘in extinction’, i.e. by unreinforced presentation of test stimuli. This causes a generalized decrease in response and can also change the shape of the generalization gradient. An interesting finding that we consider here is the reduction of peak shift during testing in extinction (figure 4a; see also Purtle 1973).
To model this finding, we teach the network a discrimination between SC
and SK
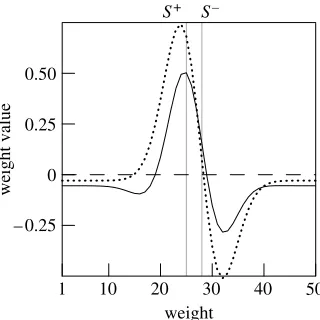
, then run a first generalization test, which shows a peak shift (figure 4b, dotted line). We then continue to test mimicking the extinction procedure, i.e. we apply thedrule after each stimulus presentation with a low target value (low l in equation (2.2)). In the generalization gradient produced after many such presentations, we find a greatly reduced peak shift. Network weights at the beginning and end of extinction testing are shown in figure 5, where it is apparent that extinction testing has reduced the difference between the positive and the negative weights which underlies peak shift. Testing in extinction has also reduced the absolute values of the weights, which results in a general decrease in network output that parallels the decrease in response as observed in the experiments.
(c)Range and frequency effects
Any set of stimuli may be, in principle, used in a generalization test. It is most common to use a range of evenly spaced stimuli roughly centred around the training ones, with the aim of getting an unbiased picture of generalization (with only partial success, as seen above). However, different kinds of tests have been used specifically to study how generalization is affected by post-training experiences. The most common manipulations include presenting some test stimuli more often than others and using only stimuli within a restricted range (for example, reviewed inThomaset al.
1992). The changes in generalization gradients brought about by such procedures may be collectively labelled as ‘range and frequency effects’ and have generated a
considerable debate about the underlying memory processes (Spence 1936; Helson 1964; Parducci 1965;Thomas 1993;Sarris 2003).
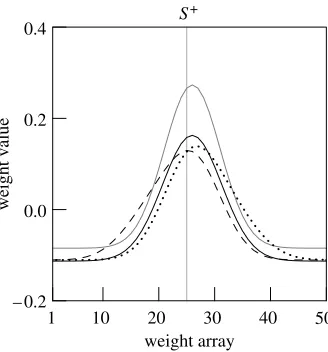
One common finding is that extensive testing causes a ‘central tendency effect’, whereby the generalization gradient appears to be shifted towards the middle of the stimulus range used in the test (figure 6a; reviewed by Thomas et al.1992). It is easy to test the network in these conditions, simply running the tests in extinction with different ranges of stimuli. The outcome of such tests is indeed a central tendency effect (figure 6b). Figure 7 shows how testing with different ranges of stimuli modifies the weight array: probing with a particular stimulus range causes a shift in the weight array towards the middle of the range.
Our results suggest that at least some range and frequency effects may arise from simple mechanisms of associative learning, while current thinking often appeals to more complex memory processes (cf. ‘adaptation level’ theory and ‘frequency-range’ theory;
0.0 0.5 1.0 1.5
(a) (b)
−4−2 0 2 4 6 S+ S–
stimulus position (cm)
responses relative to
S
+ S+S–
0.0 0.5 1.0 1.5
17 21 25 29 33
stimulus position
proportion of responses
Figure 4. Disappearance of peak shift during generalization testing in extinction (a) in animal data (from Chenget al. 1997, experiment III; pigeons were trained to discriminate two small squares 2 cm apart on a computer screen, and tested with stimuli varying in horizontal position) and (b) in the network model. Dotted lines represent the gradient just after training; continuous lines the gradient after testing. The empirical gradients are built using, respectively, the first and last few responses to each stimulus during testing in extinction (blocks 1 and 4 inChenget al.1997). Simulation parameters have been set to approximate the empirical post-discrimination gradient (dotted line in (a)), characterized by about three times more responding toSCthan toSK.
S+ S–
– 0.25 0 0.25 0.50
1 10 20 30 40 50
weight
weight value
Helson 1964; Parducci 1965; Thomas et al. 1992; Sarris 2003). The need for such additional processes is partly inferred from the belief that range and frequency effects are virtually absent in non-human animals, although it is possible to find examples in the animal literature (reviewed by Thomas 1993; Sarris 2003). Perhaps, the relative ease with which range and frequency effects appear in humans may just follow from the fact that humans learn faster (i.e. the effect of testing is seen even in relatively short tests).
4. DISCUSSION
In this exploratory study, we have used simple neural networks to test the hypothesis that path dependence phenomena arise from basic mechanisms of associative learning in distributed memory systems. We have shown that a simple network model of learning can reproduce three particular findings: the effect of errorless learning and of extinction testing on peak
shift and the central tendency effect. We chose to consider these findings for several reasons. A first one is that they provide a true test of neural network models, which were developed to account for different phenomena. We stress that we have used, without modification, a very basic model, essentially Blough’s (1975)model with the addition that stimulus represent-ations be built with knowledge of relevant sensory processes (Ghirlanda & Enquist 1999; Enquist & Ghirlanda 2005).
A second reason is that the considered phenomena have been known for many decades, yet their theory is still unsatisfactory. The effects of errorless learning and extinction testing have been repeatedly considered in the peak shift literature (Purtle 1973; Mackintosh 1974), but the theory is limited to verbal arguments such that the animals may learn ‘from the experience of being tested’ (Prokasy & Hall 1963, quoted byPurtle 1973). Range and frequency effects have received considerable attention (Thomas et al. 1992; Thomas 1993;Sarris 2003), but the extent to which they can be accounted in terms of simple associative learning is still unknown. The main theoretical difficulty posed by all these phenomena, and by path dependence in general, is that they require us to track the cumulative effect of sequences of experiences with many stimuli. This is difficult in most models (to put it mildly) and reveals one crucial advantage of neural networks: the ability to simulate arbitrary sequences of experiences and to get predictions about responding toany stimulus that can be received. Simple neural networks are also amenable, in some cases, to mathematical analysis, although we have not pursued this approach here (see Haykin 1999; Enquist & Ghirlanda 2005).
In conclusion, neural networks provide a very natural framework to study path dependence and thus increase our knowledge of how experiences shape behaviour. The neural network models are already a promising account for a large body of behavioural phenomena (Enquist & Ghirlanda 2005) and including path dependence would contribute to a unified picture of how nervous systems bring about behaviour.
REFERENCES
Arbib, M. A. 2003 The handbook of brain theory and neural networks, 2nd edn. Cambridge, MA: MIT Press.
Blough, D. S. 1975 Steady state data and a quantitative model of operant generalization and discrimination.
J. Exp. Psychol. Anim. Behav. Process.104, 3–21. (doi:10. 1037/0097-7403.1.1.3)
Cheng, K., Spetch, M. L. & Johnson, M. 1997 Spatial peak shift and generalization in pigeons.J. Exp. Psychol. Anim. Behav. Process.23, 469–481. (doi:10.1037/0097-7403.23. 4.469)
Enquist, M. & Ghirlanda, S. 2005Neural networks and animal behavior. Princeton, NJ: Princeton University Press. Ghirlanda, S. 2005 Retrospective revaluation as simple
associative learning.J. Exp. Psychol. Anim. Behav. Process.
31, 107–111.
Ghirlanda, S. & Enquist, M. 1999 The geometry of stimulus control. Anim. Behav. 58, 695–706. (doi:10.1006/anbe. 1999.1187)
S+
– 0.2 0.0 0.2 0.4
1 10 20 30 40 50
weight array
weight value
Figure 7. Weight arrays for the simulations in figure 6a. The grey line represents weights just after training, the other lines show how weights have changed after testing in extinction with three stimulus ranges. In addition to a general decline caused by the extinction procedure, we see a shift in the pattern of weights such that the largest weights move toward the centre of the probed stimulus range.
S+
0.0 0.5 1.0 1.5
(a) (b)
485 505 525 545 565
light wavelength (nm)
responses relative to
S
+
S+
0.0 0.5 1.0 1.5
17 21 25 29 33
stimulus position
proportion of responses
Figure 6. Central tendency effect. (a) Generalization gradients obtained in extinction with different ranges of test stimuli, indicated by the lines below the graph in matching style, after identical training to respond toSC
Ghirlanda, S. & Enquist, M. 2003 A century of general-ization.Anim. Behav.66, 15–36. (doi:10.1006/anbe.2003. 2174)
Hanson, H. 1959 Effects of discrimination training on stimulus generalization. J. Exp. Psychol. 58, 321–333. (doi:10.1037/h0042606)
Haykin, S. 1999Neural networks: a comprehensive foundation, 2nd edn. New York, NY: Macmillan.
Helson, H. 1964 Adaptation-level theory. New York, NY: Harper, Row.
Le Pelley, M. E. & McLaren, I. P. L. 2003 Learned associability and associative change in human causal learning.Q. J. Exp. Psychol.56B, 68–79.
Mackintosh, N. J. 1974 The psychology of animal learning. London, UK: Academic Press.
McClelland, J. & Rumelhart, D. 1985 Distributed memory and the representation of general and specific information.
J. Exp. Psychol. Gen.114, 159–188. (doi:10.1037/0096-3445.114.2.159)
McClelland, J. L. & Rumelhart, D. E. (eds) 1986 Parallel distributed processing: explorations in the microstructure of cognition, vol. 2. Cambridge, MA: MIT Press.
Parducci, A. 1965 Category judgment: a range-frequency model. Psychol. Rev. 72, 407–418. (doi:10.1037/ h0022602)
Pearce, J. M. 1997 Animal learning and cognition, 2nd edn. Hove, East Sussex, UK: Psychology Press.
Prokasy, W. F. & Hall, J. F. 1963 Primary stimulus generalization. Psychol. Rev.70, 310–322. (doi:10.1037/ h0049354)
Purtle, R. B. 1973 Peak shift: a review. Psychol. Bull. 80, 408–421. (doi:10.1037/h0035233)
Rescorla, R. A. & Wagner, A. R. 1972 A theory of Pavlovian conditioning: variations in the effectiveness of reinforce-ment and nonreinforcereinforce-ment. In Classical conditioning:
current research and theory (ed. A. H. Black & W. F. Prokasy), pp. 54–99. New York, NY: Appleton-Century-Crofts.
Rumelhart, D. E. & McClelland, J. L. (eds) 1986 Parallel distributed processing: explorations in the microstructure of cognition, vol. 1. Cambridge, MA: MIT Press.
Sarris, V. 2003 Frame of reference models in psychophysics: a perceptual–cognitive approach. In Perception beyond sensation(eds C. Kaernbach, E. Schro¨ger & H. Mu¨ ller). Mahwah, NJ: Erlbaum Press.
Spence, K. 1936 The nature of discrimination learning in animals. Psychol. Rev. 43, 427–449. (doi:10.1037/ h0056975)
Terrace, H. S. 1964 Wavelength generalization after discrimination training with and without errors. Science
144, 78–80. (doi:10.1126/science.144.3614.78)
Thomas, D. R. 1993 A model for adaptation-level effects on stimulus generalization. Psychol. Rev. 100, 658–673. (doi:10.1037/0033-295X.100.4.658)
Thomas, D. R. & Jones, C. G. 1962 Stimulus generalization as a function of the frame of reference. J. Exp. Psychol. Gen.64, 77–80. (doi:10.1037/h0043304)
Thomas, D. R., Lusky, M. & Morrison, S. 1992 A comparison of generalization functions and of reference effects in different training paradigms.Percep. Psychophys.
51, 529–540.
Wasserman, E. A. & Berglan, L. R. 1998 Backward blocking and recovery from overshadowing in human causal judgement: the role of within-compound associations.
Q. J. Exp. Psychol.51B, 121–138.
Widrow, B. & Hoff, M. E. J. 1960Adaptive switching circuits. IRE WESCON convention record, vol. 4. New York, NY: IRE.