United Kingdom ISSN 2348 0386 Vol. VII, Issue 8, August 2019
Licensed under Creative Common Page 763
http://ijecm.co.uk/
CORRUPTION, INCOME INEQUALITY,
AND POVERTY IN INDONESIA
Faris Shafrullah
Alumni of the Doctoral Program in Economics, Padjadjaran University, Indonesia rollex28@gmail.com
Abstract
The purpose of this study is to find out and analyze the influence of corruption, on income
inequality and poverty in Indonesia. The method used is a quantitative method with the use of
the Two Stage Least Square (2SLS) econometric technique. The scope of the research is 303
districts and cities in Indonesia. Using data in 2010 (cross section). Empirical findings, that high
corruption has a positive and significant influence on the spread of income inequality and
increasing poverty in Indonesia. While the profit sharing of natural resources has a negative
effect on income inequality and poverty, in other words the abundance of natural resources
causes income distribution to be better and poverty rates to decline. Similarly, investment has a
negative effect on income inequality. Meanwhile, education has a positive influence on income
inequality and has a negative effect on poverty. Per capita income has a positive effect on
income inequality. Income inequality has a negative effect on poverty. Social spending has a
negative effect on poverty. To reduce income inequality and poverty in Indonesia by reducing
the level of corruption in the implementation of the APBD in the city districts, one of them is
through increasing aspects of supervision, considering that the distance between the region and
the national capital is relatively higher than the area close to the nation's capital.
Keywords: Corruption, Income Inequality, Poverty, Education, Natural Resources
INTRODUCTION
Licensed under Creative Common Page 764 preventing, eradicating and acting against the perpetrators. The impact that was caused was extraordinary, even government officials who were supposed to be able to prevent it, but they were precisely the main actors and always allowed the incident. Corruption that occurs in the central and regional government budgets provides benefits for certain individuals or groups as the perpetrators. On the other hand, the people whose rights are taken will have an impact on increasing the level of income inequality and poverty in the area.
Iksan, (2002), the economic cost of corruption in Indonesia is very high. These high costs not only reduce the potential for economic growth, but also hamper poverty reduction, and increase income inequality in Indonesia. Indonesia's per capita income, can increase one and a half times higher than its present value, if Indonesia is able to reduce the level of corruption to the level of corruption as in Malaysia. The impact of the corruption that occurred can hamper government programs in reducing poverty, and widen the gap between the poor and rich. This condition is evident in the reality of society, where government officials suspected of corruption have a lot of assets, while in other areas, many people live in a lack of clothing, food and shelter.
According to Law Number 31 Year 1999 in conjunction with Law Number 20 Year 2001, criminal acts of corruption can be divided:
a. State loss b. Bribery bribes, c. Darkness in office, d. Extortion,
e. Cheating
f. Conflict of interest in the procurement of goods and services g. Gratification.
Tambunan, (2014), that the condition of Indonesia during the 1997/1998 economic crisis, negative economic growth, the increasing number of poor people, high crime rates, high unemployment, and the level of economic inequality increased sharply. After the economic crisis subsided, the government began to improve to restore the country's economic and social conditions. Economic growth grew again, social, economic and political conditions gradually began to be conducive. The poverty reduction program is rolled back, through a social safety net program.
Licensed under Creative Common Page 765 in order to minimize social jealousy between regions. The following is a graph of the level of income inequality in Indonesia below.
Figure 1 Income Inequality in Indonesia
Source: BPS
Based on the graph above, Indonesia's income inequality in the period 2010 to 2018 has fluctuated. For 2010, Aceh Province had the lowest income inequality of 0.300, and Papua Province had the highest income inequality of 0.410. Meanwhile the lowest level of income inequality in 2018 is Bangka Belitung Province of 0.272, and DI Yogyakarta Province has the highest income inequality of 0.422, BPS sources (2018)
Poverty in Indonesia since the old order until now shows a relatively fluctuating figure. Conditions in areas that have abundant natural resources and are minimal, the absolute poverty level is relatively increasing. This condition is compounded by the unavailability of adequate infrastructure, so that economic development is slow. The following is a graph of the percentage of the poor population below.
Figure 2 Poverty in Indonesia
Gini
Inde
x
Year
P
ove
rty
Inde
x
Licensed under Creative Common Page 766 Based on the graph above, the percentage of poverty in Indonesia in the period 2010 to 2018 is relatively declining. For 2010, DKI Jakarta Province had the lowest poverty rate of 3.48 percent, and Papua Province had the highest percentage of population living below the poverty line of 36.80 percent. In 2018, the lowest poverty rate was DKI Jakarta Province of 3.55 percent, and Papua Province was the highest, which was 27.43 percent, BPS source (2018).
Regional government spending in Indonesia in the form of direct expenditure and indirect expenditure has increased. The high budget certainly has a very high risk. Corruption actions often occur due to several reasons, one of which is the poor planning and implementation of the budget that is not economical, inefficient, and ineffective, so that it is unable to increase economic growth which ultimately is unable to reduce the level of income inequality and reduce poverty in the region. The following is a graph of the Gross Regional Domestic Product according to the expenditure below.
Figure 3 Gross Regional Domestic Product in Indonesia
Source: BPS
Based on the graph above, that Gross Regional Domestic Product in Indonesia for the period of 2010 to 2017 is relatively increasing. For 2010, Jayawijaya Regency had the lowest GRDP value of Rp.3,300,710,000, and Surabaya City had the highest GRDP value of Rp.231,204,741,400, - source, BPS (2018).
Tanzi (1995), the phenomenon of corruption is community behavior that is difficult to eradicate, has a negative impact, and distorts the role of government in the allocation of resources. Furthermore, Rose Ackerman (1999), corruption increases poverty by reducing the quality of social services for the poor, creating high incentives for capital-intensive project
GR
DP
Licensed under Creative Common Page 767 investments, and lower incentives for labor-intensive project investments. Another impact on investment like this, makes poor people have a smaller chance of generating income, so the number of unemployed and poverty rates increases.
Another influence of corruption is a negative impact on growth and investment, in line with research from Mauro (1998), Knack and Keefer (1996), corruption has an impact on the composition of government expenditure, Tanzi (1997); Mauro (1998), and also acts of corruption have an impact on the allocation of direct foreign investment, Wei (1998).
Ravallion (1997), states that high corruption can lead to high poverty rates, for two reasons. First, the evidence shows that higher growth rates are related to the level of poverty reduction, and corruption impedes the pace of poverty reduction through the transmission of economic growth. Second, income inequality has proven to be very dangerous for economic growth, where countries that have high corruption, will increase income inequality, reduce economic growth, and inhibit poverty reduction, in line with research from Alesina (1994), Persson (1994).
Furthermore, Li (2000) argues that assets owned by some rich people can use their wealth to lobby the government for profitable trading business policies, including exchange rates, and preferential treatment of taxes on their assets. This policy will result in higher returns to the rich, and lower returns to the poor, thus increasing the rate of income inequality. Large taxpayers, often kept by tax bureaucrats to be extorted. The taxpayer pays his obligations to the government in a smaller amount of value, while the difference is in the pocket of an official. In addition, assets can be used as collateral to borrow capital and invest. Therefore, inequality in asset ownership limits the poor to borrow, but for many asset owners they can increase their income throughout their lives, and for people who do not have assets, their lives will be more destitute
LITERATURE REVIEW
Corruption and Income Inequality
Licensed under Creative Common Page 768 Li (2000) stated that corruption affects the level of income of the community. In the form of an inverted U curve, corruption affects the income inequality of a country. Inequality that occurs in countries with a moderate level of corruption, is higher when compared to countries that have a low level of corruption or in countries that have a lower level of corruption.
Gupta (2002) stated that corruption has a positive influence on income inequality. The implication is to issue government policies to reduce corruption which has an impact on reducing the level of income inequality.
Brempong (2002) stated that corruption has a positive influence on income inequality in African countries. Corruption lowers the level of per capita income through a decrease in the level of productivity in African countries.
Dincer (2008) stated that corruption has a positive effect on income inequality in America. In some American states, there is a very significant imbalance, many officials are convicted of corruption.
Corruption and Poverty
Chetwynd (2003) stated that corruption is the misuse of public office for personal gain, including and not limited to embezzlement, nepotism, bribery, extortion, selling influence, and fraud. Corruption has a relationship with poverty, in line with the research of Gupta (2002), Dincer (2008), Negin (2010), Ajisafe (2016).
Tanzi (1997) stated that the driving factors for corruption are caused by two main things, namely: first, the demand made by the public to commit corruption, and secondly, the supply made by public officials to act corruptly. Requests from the public to public officials or bureaucrats to commit corruption include: 1). Regulation and autocracy. 2). Taxation system, 3). Clarity for making a decision, 4). Proposition of goods and services that are below market prices. An offer made by a bureaucrat or public official to commit corruption is influenced by: 1). Traditions from bureaucracy, 2). Low level of salaries of public officials, 3). Penalty system, 4). Institutional control, 5). Transparency from law, rules and processes; and 6). Exemplary leader. Ajisafe (2016) stated that in governance, corruption enters through government institutions to influence the budget allocation of social programs to overcome poverty. These misallocation impacts in the short and long term, thus creating permanent poverty in the country
METHODOLOGY Population and Object
Licensed under Creative Common Page 769 poverty. The year 2010 was chosen as the new base year replacing the 2000 base year. Because in 2010 there had been a change in the economic structure over the past ten years, especially in the fields of information, technology and transportation that affected the distribution pattern and the emergence of new products.
Unit of Analysis
The unit of analysis in this study is related to city districts in Indonesia. Registered regencies in Indonesia are 416 regencies, and 98 cities. The districts used as observations in this study were 238 districts and 65 cities, so the number of units of analysis became 303 municipal districts.
The method used in this study is a quantitative descriptive method using instrumental variable (IV), the Two Stage Least Square (2SLS) econometric technique, to analyze cross section data in 2010, while the research design uses two equations, namely:
The equation of income inequality uses secondary data in the form of cross section data, with Income Inequality (ketim) as the dependent variable, natural resources (sda), Investment (inv), Education (pend), Gross Regional Domestic Product (lnpdrb), Domestic Product Regional Gross Square (lnpdrb2) and ln Corruption (lnkor) as independent variables.
Poverty equation uses secondary data in the form of cross section data with Poverty (kem) as dependent variables, natural resources (sda), Education (pend), Gross Regional Domestic Product (pdrb), Income Inequality (ketim), Social Expenditure (lnbelsos) and ln Corruption (lnkor) as an independent variable.
Variable Operationalization
To facilitate understanding of the variables used, an explanation and limitation is made in the operationalization of the research variables. Operational restrictions on variables in this study, focus on the influence of independent variables on non-independent variables. Operational research variables are as follows:
Equation of Income Inequality 1. Income Inequality
Income inequality measured by the Gini ratio, is a measure of the inequality of income distribution in each district of the city in 2010. The coefficient of Gini is expressed in the form of a ratio of values between 0 and 1. A value of 0 indicates perfect equality where all values are Model of Corruption and Income Inequality Equations
Licensed under Creative Common Page 770 equal, while value 1 shows the highest inequality, that is, one person controls everything, while the other one is zero. Income inequality is symbolized by Ineq. Sources of data from the Central Statistics Agency (BPS).
2. Natural Resource Sharing
Revenue sharing for natural resources (control variable) is the value of revenue sharing of natural resources per capita in the city district in 2010, the units are in millions of rupiah. Profit sharing of natural resources is the profit-sharing value of oil and gas and non-oil natural resources originating from the area, then processed by the central government, and the end result is then transferred back to the original area according to regulations, and included as regional revenue. The sharing of natural resources is symbolized by nr. Sources of data from the Directorate General of Financial Balance, Ministry of Finance, BPS and BPK-RI.
3. Investment
Investment is a proxy of the value of Gross Fixed Capital Formation (GFCF) on the basis of current prices per capita (control variable), in the district area of the city in 2010, the unit is in millions of rupiah. Investment is symbolized by inv, and data sources from BPS.
4. Education
Education is a proxy for the average length of school (control variable), which is the average year of study in formal education by residents aged 15 years and over, in the district area of the city in 2010, and their units in the year. Education is symbolized by educ, and data sources from BPS.
5. Gross Regional Domestic Product
Gross Regional Domestic Product (control variable), is the value of GRDP on the basis of current prices per capita, in millions of rupiah in the city district area in 2010. Gross Regional Domestic Product is regional income. GRDP is presented in the form of natural logarithms and symbolized by lngrdp, and data sources from BPS.
6. Gross Regional Domestic Product Square
Licensed under Creative Common Page 771 7. Corruption
Corruption (variable of interest) proxy of the value of the Republic of Indonesia BPK findings in millions of rupiah divided by population, in urban district areas in 2010. To overcome the problem of endogenous, corruption variables are instrumented with instrumental variables (a) geographical distance of city districts to mothers provincial city, and (b) geographical distance of city districts to Jakarta. As stated by Ahmad and Hall (2012), and Kelejian et al (2013), geographical distance has pure exogenous properties, and is closely related to corruption behavior, so that geographical distance can be used as an instrumental variable for corruption. Corruption is presented in the form of a natural logarithm and symbolized by lncorr, and a source of data from the Republic of Indonesia BPK and BPS.
Poverty Equation 1. Poverty
The measure of poverty in Indonesia according to BPS, namely (1). Percentage of Poor Population or Head Count Index (P0), is the percentage of population below the Poverty Line (GK); (2). The Poverty Gap Index or Poverty Gap Index (P1), is a measure of the average income gap of each poor person to the poverty line. The higher the index value, the further the average population expenditure from the poverty line; (3). The Poverty Severity Index (P2), which provides an overview of the distribution of spending among the poor. The higher the index value, the higher the inequality of expenditure among the poor.
In this study, the poverty variable is measured by the percentage of poor people (P0), is a measure of the ability to meet basic needs, or the inability of the economy to meet basic food needs, and non-food measured by expenditure, percent, in district districts in the year 2010. Poverty is symbolized by pov, and data sources from the Central Statistics Agency (BPS).
2. Natural Resource Sharing
Licensed under Creative Common Page 772 3. Education
Education is a proxy for the average length of school (control variable), which is the average year of study in formal education by residents aged 15 years and over, in the district area of the city in 2010, and their units in the year. Average School Duration is symbolized by educ, and data sources from BPS.
4. Gross Regional Domestic Product
Gross Regional Domestic Product (control variable), is the value of GRDP on the basis of current prices per capita, in millions of rupiah in the city district area in 2010. Gross Regional Domestic Product is regional income. GRDP is symbolized by grdp, and data sources from BPS.
5. Income Inequality
Income inequality (control variable) proxy of the Gini ratio, is a measure of the inequality of income distribution in the district of the city in 2010. The coefficient of Gini is expressed in the form of a ratio between 0 and 1. A value of 0 indicates perfect equality where all values are equal, while values 1 shows the highest inequality, that is, one person controls everything, while the other one is zero. Income inequality is symbolized by team, and data sources from the Central Statistics Agency (BPS).
6. Social Expenditures
Social expenditure (control variable), is social spending in millions of rupiah, divided by the total population in the city district area in 2010. Social expenditure is a component of expenditure used by local governments to meet the demands of citizens proposed through development planning deliberations. Social expenditure is presented in the form of natural logarithms and symbolized by lnbelsos, and data sources from BPS.
7. Corruption
Licensed under Creative Common Page 773 Corruption is presented in the form of a natural logarithm and symbolized by lncorr, and a source of data from the Republic of Indonesia BPK and BPS.
Estimation Technique a. Instrumental Variable (IV)
Corruption variables which are independent variables in equations that are thought to be endogenous, and correlate with the residual equality of income inequality and poverty. The endogenicity test is carried out with Hausman test where Ho is an independent variable that is thought to be exogenous, by means of procedures: (1) regression of the independent variable that is thought to be endogenous towards instrumental variables, and residual or error regression, (2) estimating the model with instrumental variable and previous residual regression as independent variables. Rejection of Ho indicates that the independent variable is suspected to be endogenous.
There is an endogenous problem, by estimating OLS it will produce estimates that are biased, inefficient and inconsistent. To estimate efficiently and consistently instrumental variables (iv) for corruption variables where these instrumental variables must have criteria, namely: (a) strongly correlated with the variable corruption (instrument relevance), and (b) does not correlate with residuals in structural equations (instrument validity). Testing of the first criterion can be done directly, while the test for the second criterion cannot be done, considering that residuals are unobservable, Wooldridge (2002). The existence of both criteria (a) and (b) above, estimation using instrumental variables will be biased for a large number of samples, but for a small number of samples it may still be biased. Weak correlation between instrumental variables and endogenous variables in question will produce a biased estimator. If there is a correlation between instrumental variables and residuals, then the estimator will be inconsistent. In estimation with instrumental variables, R-squared will not be obtained as in the sense of Ordinary Least Square (OLS), namely "left-sided variation that can be explained by the right side". The resulting print-out R-square has no natural interpretation, Wooldridge (2002).
Licensed under Creative Common Page 774 corruption variable. Justification of the criteria for instrument validity is done on the basis of intuition or underlying theory. If there is an over-identified situation in the model, instrument validity can be tested with Ho: instrumental variables do not correlate with error terms. Acceptance of Ho indicates that the proposed variable instrument is valid, Wooldridge (2002).
The test procedure for instrument validity can only be done if the model in the condition is over-identified, i.e. by: (1) structural equation regression and residual regression; (2) the residual regression obtained from the instrumental variable and obtained R2; (3) find the value of nR2 where n is the sample size; (4) look for chi-square values with degrees of freedom in the amount of instrumental variables minus endogenous explanatory variables; (5) determine whether Ho is rejected or accepted (not rejected).
The variable distance from the city district to the provincial capital (jrkpro) and the distance from the city district to Jakarta (jrkjkt) are expected to meet the criteria as instrumental variables. The distance from the city district to the provincial capital and the distance from the city district to Jakarta are exogenous and correlated with corruption, so that they meet the criteria as instrumental variables for the corruption variable.
It is assumed that the distance of city districts to provincial capitals and the distance of city districts to Jakarta correlates with the level of corruption that occurs in city districts. Therefore, the variable distance of city districts to provincial capitals and the distance of city districts to Jakarta can be good candidates as instrumental variables for corruption in city districts, because both of these variables meet two instrumental variable criteria. The first criterion (instrument relevance), namely the instrumental variable correlated with the endogenous explanatory variable, namely the corruption variable, and the second criterion (exogeneity instrument) that is exogenous instrumental variable or does not correlate with residual or error term, Wooldridge (2002).
b. Robust Standard Errors
Licensed under Creative Common Page 775 c. Two Stage Least Square (2SLS)
The use of Two Stage Least Square (2SLS) estimation is an extension of the Ordinary Least Square (OLS) method. This Ordinary Least Square method is inefficient and cannot be used, if the instrument variable is bigger and more than the number of parameters to be estimated. The use of Two Stage Least Square (2SLS) is a combination of Ordinary Least Square (OLS) and instrumental variables so that regression results become more efficient.
RESULTS AND DISCUSSION Corruption Descriptive Statistics
Table 1 Inequality of Income and Poverty
Variable Observation Mean
Standard
Devi. Minimum Maximum
Inequality 303 0,291 0,053 0,11 0,475
Poverty 303 15,019 10,143 2,21 49,58
Natural Resources 303 0,502 2,197 0 31,984
Investment 303 8,241 9,698 0 112,243
Education 303 7,581 1,537 2,07 11
GRDP 303 29,373 42,793 0 385,396
Social Spending 303 0,114 0,234 0 1,963
Corruption 303 0,078 0,387 0 4,744
Based on Table for income inequality has an average value of 0.291, the minimum value is 0.11, and the maximum value is 0.475. The average value of poverty is 15.02 percent, the minimum value of poverty is 2.21 percent, and the maximum value of poverty is 49.58 percent. The average value of natural resource revenue-sharing per capita is Rp. 0.502 million, and the maximum value of natural resources per capita is Rp. 31,984 million. The average value of investment per capita is Rp.8,241 million, and the maximum investment value is Rp112,243 million.
Furthermore, the average value of education is 7.58 years, the minimum value of education is 2.07 years, and the maximum value of education is 11 years. The average per capita GRDP is IDR 29,373 million, and the maximum value is IDR 385,396 million.
Licensed under Creative Common Page 776 corruption score for the city district area is Rp.078 million, and the maximum corruption value per capita is Rp.4,744 million.
Income Inequality Results of Estimated Equations
The results of estimating the similarity of income inequality can be seen in the table below.
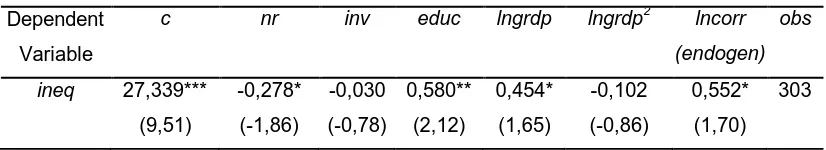
Table 2 Equation of Income Inequality
Dependent c nr inv educ lngrdp lngrdp2 lncorr obs
Variable (endogen)
ineq 27,339*** -0,278* -0,030 0,580** 0,454* -0,102 0,552* 303 (9,51) (-1,86) (-0,78) (2,12) (1,65) (-0,86) (1,70)
* significant at 10%; ** significant at 5%; *** significant at 1%; z value in parentheses.
Based on the above table, the estimation results are as follows:
a. That the distance between the capital of the city and the capital of Jakarta has a positive and significant influence on corruption, ceteris paribus. While the distance between the district capital of the city and the provincial capital did not have a significant effect on corruption (First-stage regressions).
b. Profit sharing of natural resources has a negative and significant influence on the level of income inequality which is equal to 0.278, ceteris paribus. The average increase of Rp1,000,000 profit sharing of natural resources for the regions will reduce the level of income inequality by an average of 0.278 points significantly.
c. Investment has a negative influence on the level of income inequality which is equal to 0.030, ceteris paribus. With an average enlargement of Rp1,000,000 investments in the region, it will reduce the level of income inequality by an average of 0.03 points. This result is in accordance with Matti's research (2015).
d. Education has a positive and significant influence on the level of income inequality that is equal to 0.580, ceteris paribus. The increase in the average 1 year duration of education in the region will increase the level of income inequality by an average of 0.580 points. This result is consistent with the research of Hongyi et.al (2000), Gupta et. Al (2002), Kar et. Al (2012).
Licensed under Creative Common Page 777 income inequality (Gini index) by an average of 0.454 points. This result is consistent with the research of Hongyi et.al (2000), Gupta et.al (2002), Huang, (2012).
f. The gross regional logarithm of gross regional domestic products has a negative influence on the level of income inequality that is equal to 0.102, ceteris paribus. With an average increase of 1 percent of gross regional domestic product in the area, it will reduce the level of income inequality (Gini index) by an average of 0.102 points.
g. Corruption has a positive and significant effect on the level of income inequality that is equal to 0.552, ceteris paribus. A 1 percent increase in corruption in the regions will increase the level of income inequality by an average of 0.552 points. These results are in accordance with the results of research by Hongyi et.al (2000), Gupta et. Al (2002), Dincer et. Al (2008), Dobson et.al (2012), Kar et. Al (2012), and Matti (2015 ).
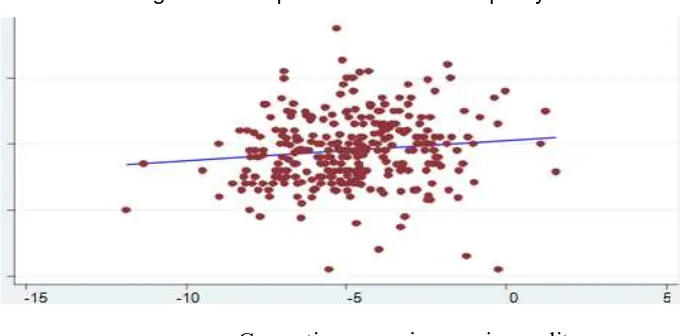
Figure 4 Corruption and Income Inequality
Poverty Results of Estimated Equations
The results of the estimation of poverty equation can be seen in the table below.
Table 3 Poverty Equation Dependent
c nr Educ grdp ineq lnsospe
lncorr
obs
Variable (endogen)
pov 0,711*** -0,012*** -0,035*** -0,002* -0,001 -0,011 0,058*** 303 (8,25) (-4,00) (-7,71) (-1,84) (-0,84) (-1,40) (5,01)
* significant at 10%; ** significant at 5%; *** significant at 1%; z value in parentheses.
Licensed under Creative Common Page 778 Based on the above table, the estimation results are as follows:
a. That the distance between the capital of the city and the capital of Jakarta has a positive and significant influence on corruption, ceteris paribus. While the distance between the capital city districts and the provincial capital is not significant to corruption (First-stage regressions).
b. Profit sharing Natural resources have a negative and significant influence on the poverty rate which is equal to 0.012, ceteris paribus. The average increase of Rp1,000,000 for natural resources for the regions will reduce poverty by an average of 0.012 percent. This result is in accordance with the research of Gupta et.al (2002).
c. Education has a negative and significant influence on poverty rates which is equal to 0.035, ceteris paribus. The increase in 1 year duration of education in the region will reduce poverty by an average of 0.035 percent.
d. Gross regional domestic product per capita has a negative and significant effect on the poverty rate which is equal to 0.002, ceteris paribus. There is an average increase of Rp1,000,000 gross regional domestic products per capita in the region, it will reduce the poverty rate by an average of 0.002 percent. This result is in accordance with Gupta et al. (2002), and Dincer et.al (2008).
e. Income inequality has a negative influence on poverty rates which is equal to 0.001, ceteris paribus. With an increase in income inequality by an average of 1 point in the region, it will reduce poverty by an average of 0.001 percent. This result is in accordance with the research of Gupta et.al (2002).
f. Natural logarithms Social spending has a negative influence on poverty rates which is equal to 0.011, ceteris paribus. An increase in the average of 1 point of social expenditure in the region will reduce poverty by an average of 0.011 percent of the average.
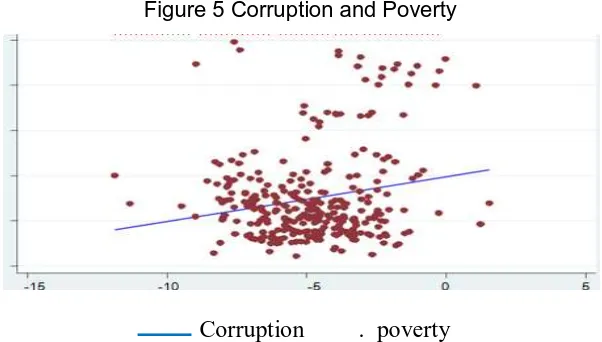
Licensed under Creative Common Page 779 Figure 5 Corruption and Poverty
IMPLICATIONS
Implications of Income Inequality Policy
1. From the results of the research it can be found that corruption in the city district has a positive and significant influence on income inequality. Based on research data that the city of Samarinda has the lowest income inequality level of 0.110 points. If corruption occurs in the city of Samarinda, then the level of income inequality increases to 0.662 points, meaning that it is already at the level of a high level of income inequality. Corruption that occurs has its own phenomenon, corruption is the sand the wheel for income distribution in Indonesia. This condition was caused by a request from regional bureaucrats and offers from the community itself. The eradication of corruption has been felt to be not optimal, in addition to the existence of institutions that have basic tasks and functions as eradication of corruption in this case the prosecutors and the police work less optimally, and are only reinforced by ad hoc corruption eradication institutions. Coordination between law enforcement agencies must be optimized to eradicate corruption, so that there are no overlapping assignments between institutions. Besides that, the role of the Supreme Audit Board as an auditing institution / auditor of the state and also as a high state institution must be appreciated and respected. Efficient and effective corruption eradication can reduce income inequality in the regions and income inequality between regions.
2. Natural resources revenue sharing funds have a significant negative effect on income inequality in the urban districts of Indonesia. Profit sharing funds for natural resources in the region, should be able to provide benefits for the welfare of the community and reduce income inequality in the region. Local governments that manage efficiently and
Licensed under Creative Common Page 780 effectively are expected to be able to provide prosperity to the regions in the form of fulfilling public health facilities and infrastructure development in the regions. The existence of a regional autonomy law is a mandate for the government to manage natural resources revenue-sharing funds more equitably, so as not to generate income inequality and its main goal is to prosper the people in the region.
3. Education has a significant positive effect on income inequality. The existence of a national education law that aims to improve the quality of education and reduce the gap between municipal districts. The condition of education reflects inequality, this is felt when integrated schools begin to stand up a lot. While the rich population can send their children to school at the school. For those who are less fortunate, they can only send their children to school that have minimal infrastructure. In addition to effective policies by the government in the education sector, it should have a direct impact on reducing education inequality in the region. Government policy in the field of education is in the form of allocating School Operational Assistance (SOA) funds for elementary schools, junior high schools and vocational schools with the same values throughout Indonesia, with the intention and purpose of reducing inequality between regions and reducing the burden on the poor in the regions. Government policy in increasing the average year of schooling in the region, with a 9-year compulsory education program. This policy must run optimally and effectively, so that the population in the area can get a minimum of 9 years of schooling, so that the quality of human resources in the region increases, and reduces inequality.
Implications of Poverty Policy
Licensed under Creative Common Page 781 number of poor people is a burden for the government to achieve greater economic development. Therefore the Decree of the People's Consultative Assembly, which mandates a clean and corruption-free state bureaucracy or organizer must be maintained.
2. Funds for sharing natural resources have a negative and significant effect on poverty. Central government policies that provide regional autonomy with full authority to local governments to manage natural resource revenue-sharing funds provide effective results,
3. Education has a negative and significant effect on poverty. Government policy in the field of education, one of which through the costs of School Operational Assistance (BOS) for elementary, junior high, and senior high schools in all city districts in Indonesia, is aimed at reducing the burden on the poor in education. This condition shows that, state administrators are very concerned about public education to reduce the number of poor people. Central government policy is synergized with regional government policies, through companion budget allocation policies in the field of education which together aim to reduce the burden on the poor, so that they can go to school, which is then absorbed by employment, which ultimately has income automatically reduces poverty. This kind of policy must continue.
CONCLUSION
The conclusions from this study are as follows:
1. Corruption has a negative impact on the level of income inequality, as well as education and GDP per capita. Meanwhile profit sharing funds for natural resources, investment and GDP per capita square have a good impact or can reduce the level of income inequality in urban districts in Indonesia. Corruption is rampant in the regions in a systematic and massive structured manner, resulting in an increase in the level of income inequality in the city district in Indonesia. Ownership of wealth assets, access to banks and financial institutions, access to health and education in the regions are only owned and controlled by a handful of people or officials in the region, resulting in inequality in the ownership of production factors, which results in increased income inequality in the city district.
Licensed under Creative Common Page 782 good impact or can reduce poverty in urban districts in Indonesia. Thus, corruption that occurs in the regions is very difficult (sand the wheel) to reduce poverty in urban districts in Indonesia. This is the burden of the city district government in determining the priority scale of its handling. This condition makes investors think and are not interested in investing in the area, there is no investment coming in so that unemployment increases, purchasing power is weak, and the number of poor people increases in the district of the city.
3. The distance between the location of the city district government office and the central government in Jakarta has a significant influence on corruption. City district government officials consider that the supervision carried out by the central government in Jakarta tends to be weak, while the frequency of supervision with direct visits to the municipal district governments is relatively rare, and only requests reports in the framework of coordination. This condition is often used by municipal district government officials to commit corruption.
4. The limitations of the research experienced that the process of collecting and completing the data of the city district took quite a long time, so that it had an impact on the writing completion period.
REFERENCES
Acemoglu, D., Robkoron, J.A, 2014, Mengapa Negara Gagal. Awal Mula Kekuasaan, Kemakmuran, dan Kemiskinan, Penerbit PT. Elex Media Komputindo, Kompas Gramedia.
Ahmad, M., Hall, S., G, 2012, Kortitution and Growth: Testing the Spatial Effect Using Weight Matrix Based on the Kortitutional Distance Concept. Munich Personal RePEc Archive.
Alesina, A, & Rodrik, D, 1994, Distributive politics and economic growth, Quarterly Journal of Economics, 108, 465-490.
Andrews, D. F., 1972, Robust Estimates of Location: Survey and Advances, Princeton University Press.
Armstrong, Harvey, and Jim Taylor, 2001, Regional Economics and Policy, 3th Edition, Blackwell Publishers Inc, Massachusetts, USA
Atmasasmita, Romli dan Kodrat Wibowo, 2016, Analisis Ekonomi Mikro Tentang Hukum Pidana Indonesia, Jakarta, Kencana Prenadamedia Group, Jakarta
---,2016, Sisi Lain Akuntabilitas KPK dan Lembaga Pegiat Anti Korupsi : Fakta dan Analisis, PT. Gramedia Pustaka Utama, Jakarta
Baltagi, Badi H, 2005, Econometric Analysis of Panel Data, 3th Edition, John Wiley & Sons Ltd, The Atrium, Southern Gate, Chichester, West Sussex PO19 8SQ, England
Baltagi, Badi H, Long Liu, 2009, A Note on the Application of EC2SLS and EC3SLS Estimators in Panel Data Models, Center for Policy Research, Surface, Syracuse University, USA
Licensed under Creative Common Page 783
---, 2003, Determinants of Economic Growth in a Panel of Countries, Journal of Economics and Finance 4, 231– 274
Barro, Robert J, and Sala-i Martin, Xavier, 2004, Economic Growth. Second Edition. MIT Press. Cambridge, Mass
Baum, Christopher F, Mark E. Schaffer, Steven Stillman, 2003, Instrumental variables and GMM: Estimation and Testing, Working Paper No. 545
Brempong, Kwabena Gyimah, 2002, Corruption, Economic Growth, and Income Inequality in Africa, Economics Governance 3: 183–209 Springer-Verlag
Buscaglia,Edgardo, 1995, Judicial Corruption in Developing Countries : Its Causes and Economic Consequences, Hoover Institution, Essays in Public Policy.
Chenery, Hollis Burnley, 1979, Structural Change and Development Policy, A World Bank Research Publication, Oxford University Press.
Chetwynd, Eric, Frances Chetwynd, Bertram Spector, 2003, Corruption and Poverty: A Review of Recent Literature, Management System International, Washington USA.
Dincer, Oguzhan C, and Burak Gunalp, 2008, Corruption, Income Inequality, and Poverty in the United States, KTHC-Knowledge, Technology, Human Capital.
Dobson, Carlyn, and Antonio Andres, 2012, Is corruption really bad for inequality ? Evidence from Latin America, The Journal of Development Studies.
Dreher, Axel and Friedrich Schneider, 2006, Corruption and the Shadow Economy: An Empirical Analysis, IZA Discussion Paper No. 1936.
Fidrmuc, Jan, 2001, Democracy in Transition Economies, Grease or Sand in the Wheel of Growth, Working Paper, Rheinische Friedrich Wilhelms Universität Bonn.
Fisman, Raymond and Roberta Gatti, 2002, Decentralization and Corruption: Evidence Across Countries, Journal of Public Economics.
Gazdar, Kaothar and MondherCherif, 2012, Institutions and the Finance-Growth Nexus: Empirical Evidence from MENA countries, ERF 18th Annual Conference, Economic Research Forum, Cairo Egypt.
Ghozali, Imam, 2005, Analisa Multivariat, BPFE, Yogyakarta.
Gray, C.W., Kaufmann, D, 1998,Corruption and Development. Finance and Development, 35:7–10
Greene, William H, 2002, Econometric Analysis, 5th Edition, Prentice Hall, New York University, Upper Saddle River, New Jersey
Groshen, Erica L, Mark E. Schweitzer, 1997, Identifying Inflation’s Grease and Sand Effects in the Labor Market, Prepared for the NBER Conference on the Costs and Benefits of Achieving Price Stability, the Federal Reserve Bank of New York
Guillaume, Pierre, Méon and Khalid Sekkat, 2005, Does Corruption Grease or Sand the Wheels of Growth? Public Choice, Springer, the University Robert Schuman of Strasbourg and the University Louis Pasteur of Strasbourg.
Gujarati, Damodar N, 2003, Basic Econometrics (Fourth Edition), McGraw-Hill.
Gupta, Sanjeev, Hamid Davoodi, and Rosa Alonso-Terme, 1998, Does Corruption Affect Income Inequality and Poverty?,IMF Working Paper.
---, 2002, Does Corruption Affect Income Inequality and Poverty? Economics of Governance, Springer-Verlag, Washington, DC, 20431, USA.
Hansen, Lars Peter, 1982, Large Sample Properties of Generalized Method of Moments Estimators, Econometrica, Vol. 50, No.4.
Hendriks, J., Keen, M., Muthoo, A, 1998,Corruption, Extortion and Evasion. Paper No. 98, University of Exeter Department of Economics.
Hillman, Arye L, 2004, Corruption and Public Finance an IMF Perspective, European Journal of Political Economy Vol. 20.
Huang, Chiung Ju, 2012, Corruption, Economic Growth, and Income Inequality: Evidence from Ten Countries in Asia, International Journal of Social, Behavioral, Educational, Economic, Business and Industrial Engineering Vol. 6.
Licensed under Creative Common Page 784
Johnston, M, 1989, Corruption, Inequality, and Change. In Ward, P. M. (ed.), Soft Touch or Hard Graft Routledge, London.
Kaufman, Daniel and Shang Jin Wei, 1999,Does “Grease Money” Speed up The Wheels of Commerce, Working Paper, National Bureau Of Economic Research, Massachusetts Avenue Cambridge.
Kelejian, H., H., Murrell, P., Shepatylo, O, 2013, Spatial Spillovers in the Development of Institutions. Journal of Development Economics.
Ketetapan Majelis Permusyawaratan Rakyat Sementara (Tap MPRS), Nomor XXIII/MPRS/1966 tentang Pembaharuan Kebijakan Landasan Ekonomi, Keuangan dan Pembangunan, tanggal 5 Juli 1966.
Ketetapan Majelis Permusyawaratan Rakyat (Tap MPR), Nomor XI/MPR/1998 tentang Penyelenggara Negara Yang Bersih dan Bebas Korupsi, Kolusi dan Nepotisme, tanggal 13 November 1998.
Klitgaard, Robert, 2005, Controlling Corruption, The Regent of the University of California.
Knack,S, Keefer,P,1996, Institutionsand Economic Performance:Cross-Country Tests Using Alternative Institutional Measures, Economics and Politics.
Lambsdorff, Johann Graf, 1999, Corruption in Empirical Research-AReview, Transparency International Working Paper.
---, 2005, How Corruption Affects Economic Development, (Corporate Governance und Korruption. Wirtschaftsethische und moralökonomische Perspektiven der Bestechung und ihrer Bekämpfung), Volkswirtschaftliche Schriften, Heft 544. Duncker & Humblot, Berlin.
Leff, Nathaniel H., 1964, Economic Development Through Bureaucratic Corruption, The American Behavioral Scientist.
Li, H., Xu, L.C., Zou, H, 2000,Corruption, Income Distribution and Growth, Economics and Politics.
Lui, Francis T, 1983, An Equilibrium Queueing Model of Bribery, Center for Economic Research Department of Economics University of Minnesota Minneapolis.
Mankiw, N Gregory, David Romer, and David N. Weil, 1992, A Contribution to the Empirics of Economic Growth, Quarterly Journal of Economics.
Marius, Sorin Sebastian Krammer, 2013, Greasing The Wheels of Change the Impact of Corruption on Firms Innovation in Transition Economies, Paper to be presented at the 35th DRUID Celebration Conference, Barcelona, Spain.
Matti, Josh, 2015, Corruption, Income Inequality, and Subsequent Economic Growth, Undergraduate Economic Review.
Mauro, Paolo,1998, Corruption and the Composition of Government Expenditure, Journal of Public Economics.
---, 2004, The Persistence of Corruption and Slow Economic Growth, Papers Vol. 51, No. 1, International Monetary Fund.
---, 2008, Corruption and Growth, The MIT Press is Collaborating with JSTOR to digitize, The Quarterly Journal of Economics.
McCann, Philip, 2001, Urban and Regional Economics, University of Reading.
Meon, Pierre-Guillaume, and Khalid Sekkat, 2005, Does corruption grease or sand the wheels of growth?, Public Choice, Springer.
Mo, Park Hung, 2001, Corruption and Economic Growth,Journal of Comparative Economics.
Negin, Vahideh, and Zakariah Abd Rashid, and Hesam Nikopour, 2010, TheCausal Relationship between Corruption and Poverty :A Panel Data Analysis, Department of Economics, University Putra Malaysia (UPM).
Nachrowi,N. D, 2006, Pendekatan Populerdan Praktis Ekonometrika untuk Analisa Ekonomi dan Keuangan. Penerbit Fakultas Ekonomi Universitas Indonesia.
Nitisastro, Widjojo, 2010, Pengalaman Pembangunan Indonesia, Penerbit Buku Kompas, Jakarta
Persson, T, &Tabellini, G, 1994, Is inequality harmful for growth? American Economic Review.
Licensed under Creative Common Page 785
Quah, Jon S.T, 1987 ,Corruption In Asia With Special Reference To Singapore: Patterns And Consequences, Asian Journal of Public Administration.
Rahman, A, G. Kisunko, dan K. Kapoor, 2000, Estimating the Effects of Corruption: Implication for Bangladesh, World Bank Working Paper, Washington. D.C.
Ravallion, Martin, 1997, Growth, Inequality, and Poverty : Looking Beyond Averages, World Bank, Elsevier Science Ltd, Great Britain.
Rose-Ackerman, Susan.1999. Corruption and Government : Causes, Consequences and Reform, Cambridge University Press.
Rosen, Harvey S, Ted Gayer, 2010, Public Finance, 9th Edition, McGraw Hill.
Romer, David, 2012, Advance Macroeconomics, 4th Edition, McGraw Hill.
Samuelson, Paul A, William D. Nordhaus, 2001, Macroeconomics, 17th Edition, McGraw Hill, New York.
Sen, Amartya, 1999, Development in Freedom, Oxford University Press.
Söderbom, Måns, 2009, Applied Econometrics Lecture 2: Instrumental Variables, 2SLS and GMM. www.soderbom.net.
Snyder, Christopher and Walter Nicholson, 2010, Microeconomics Theory: Basic Principles and Extensions, 11th Edition, South-Western Cengage Learning.
Sukirno, S, 2012, Makro ekonomi Teori Pengantar. Edisi Ketiga. Cetakan ke 21, Divisi Buku Perguruan Tinggi, PT. Raja Grafindo Persada, Jakarta.
Sutyastie S. Remi, 2001, The Strategic Role of Human Capital Investment Towards Economic Growth, Journal of the Faculty of Economic Padjadjaran University.
Svensson, Jakob, 2000, Foreign Aid and Rent-Seeking, Journal of International Economics
---, 2005, Eight Questions about Corruption, Journal of Economic Perspectives.
Shleifer, Andrei, and Robert W. Vishny, 1993, Corruption, JStor, Vol. 108, The Quarterly Journal of Economics.
Tambunan, Tulus TH, 2014, Perekonomian Indonesia, Cetakan Ketiga, Ghalia Indonesia.
Tanzi,Vito, and Hamid Davoodi,1997,Corruption, Public Investment, and Growth, IMF Working Paper, Washington.
Tanzy, Vito,1998, Corruption Around The World: Causes, Consequency, Scope, and Cure, Working Paper, International Monetary Fund, Fiscal Affairs Department.
Van Den Berg, Hendrik, 2001, Economic Growth and Development, McGraw Hill.
Van Rijckeghem, Caroline, Beatrice Weder, 2001, Bureaucratic Corruption and the Rate of Temptation: Do Wages in the Civil Service Affect Corruption, and by How Much?, Journal of Development Economics.
Vernon, J Henderson, and Ari Kuncoro, 2006, Corruption in Indonesia, Brown University and University of Indonesia.
Wei, Shang Jin, 1998, Corruption in Economic Development: Beneficial Grease, Minor Annoyance, or Major Obstacle? Harvard University and National Bureau of Economic Research.
---, 2000, Bribery in the Economies: Grease or Sand ?, The Brookings Institution, Harvard University, NBER.
White, H, 1980, Nonlinear Regression on Cross-Section Data, Econometrica.
---, 1980, A Heteroskedasticity-Consistent Covariance Matrix Estimator and Direct Tests for Heteroskedasticity,” Econometrica.
---, 1980, Instrumental Variables Regression on Cross-Section Data, Department of Economics, University of California Press,San Diego.
Wooldridge, Jeffrey M, 2001, Applications of Generalized Method Moments Estimation, Journal of Economic Perspectives.
---, 2002, Econometric Analysis of Cross Section and Panel Data, The MIT Press Cambridge, Massachusetts London, England.
---, 2012, Introductory Econometrics: A Modern Approach, Fifth Edition, South-Western5191 Natorp Boulevard Mason, USA.
Licensed under Creative Common Page 786
Yusuf, Arief, Anshory, 2005, Survey Pertumbuhan dan Ketimpangan, Lembar Kerja Ekonomi dan Studi Pembangunan, Universitas Padjadjaran.