1001
Comparative Analysis Of Mother Wavelet
Selection For EEG Signal Application To Motor
Imagery Based Brain-Computer Interface
Sanjay Ganorkar, Vrushali Raut
Abstract: Brain-computer interface (BCI) system intends to control the environment for the individual using only his thoughts bypassing muscular pathway. Electroencephalography (EEG) is non-invasive signals corresponding to underlying brain wave acting as potential input to BCI. This paper used EEG corresponding to Motor Imagery (MI) of Right hand and Left-hand movement as input to the system designed. Spectral components with a temporal resolution of signal acted as strong features in BCI and achieved by using wavelet transform. Extracting relevant features is linked with wavelet basis selection. This work proposes a new method of energy compaction in the approximate band for wavelet basis selection. Daubechies and Bio-orthogonal family, the preferred wavelets for biomedical signals, are used for band energy comparison. Experimenting verifies biBio-orthogonal wavelets bior2.8, bior3.1, bior5.5, bior6.8 and Daubechies wavelets db10, db13, db14, db15 carries more energy in the approximate band for signal under test. This paper further suggested the restriction on features extracting from µ band (8-12Hz) and β band (15-30Hz), reducing the burden on the classifier. The higher-order statistical features extracted in this work represent the dynamics of the signal. Bior6.8 and db10 emerge as the matching wavelets with a classification accuracy of 82.01% and 82.82% respectively using Support Vector Machine (SVM) for classification.
Index Terms: Band Energy Electro-Encephalography (EEG), Motor Imagery (MI), Brain-Computer Interface (BCI) —————————— ——————————
1 INTRODUCTION
A variable electrical potential on scalp corresponding to brain activities plays a vital role in the functioning of Brain-Machine Interface (BMI) or Brain-Computer interface (BCI). Thus BCI system consists of acquiring the brain activities, pre-processing it for artifact removal, feature extraction corresponding to underlying activity, classification of the extracted feature to distinguish between the activities. Corresponding brain activities which act significantly as input for BCI are Steady-State Evoked Potentials (SSVEP) and P300 these are evoked signals, whereas Motor Imagery (MI) is the spontaneous signal. An Evoked signal increases dependency on the evoking mechanism as well as proper training of the subject is required for its use. Spontaneous signals are self-modulating, user or subject has not to trained for it. Thus BCI using spontaneous signals like MI is the most widely used category. Imagining the motor movement or performing it, generate the MI signal, in both the cases mentioned above, identical modulation of EEG signal takes place[1]. This modulation corresponds to Event-Related Synchronization (ERS) in the β band(15-30Hz) over the ipsilateral side and Event-Related De-synchronization(ERD) in µ band(8-12Hz)over a contralateral side of primary motor cortex[2]. Hand movement, leg movement, and tongue movement or imagining them can act as conceivable input for modulation of brain activity pattern. Not only this even finer movement like finger movement can act as substantial input to motor imagery based BCI[3]. EEG electrodes corresponding to the motor area of the brain can collect MI signal with sufficient strength.
These signals are contaminated with noise as well interference not only from neighboring electrodes but also from Electro Cardiogram (ECG) and Electro Mayo gram(EMG) signals, eye blink, line interference, and movement artifacts, etc. These signals have a frequency range common to a signal of interest[4][5][6][7]. Due to high variability and artifact in the signal, feature extraction seems to be a crucial part of BCI from the signal processing point of view. Techniques suggested by literature are a Common spatial pattern(CSP) a technique known for statistical pattern recognition[8], Autoregressive(AR) and Autoregressive with exogenous input (ARX) are traditional techniques in BCI[9][10]. Bi-scale wavelet was used in asynchronous BCI[11][12]. Time-frequency spatial feature extraction was preferred[13], Frequency principal components analysis (fPCA) factors conform to the spectral structure of empirical data[14], Canonical correlation analysis spatial filter for identifying optimal weighted combinations of electrode signals[15]. Time domain, frequency domain as well as mixed domain features act as a possible input to the system. BCI needs feature selection as it has to deal with high dimensional input data. BCI Genetic Algorithm a heuristic search technique,[16] Principal Component Analysis a linear transformation[17][18] and DSLVQ are some of the feature selection or dimensionality reduction methods popularly used. Linear classifiers come with advantages of robustness and are less prone to overfitting. Kernel-based classifiers are classification methods that apply a linear classification in some appropriate (kernel) feature space[19]. Support vector machines (SVMs) and kernel Fisher discriminant (KFD) are kernel-based classifiers preferred in BCI as well for seizure detection[20][21]. Nonlinear classifiers are preferred for a big amount of data with less knowledge. K-nearest neighbor classifier (K-NN) preferred for two-class BCI; it does not need training[22]. Genetic algorithm-based artificial neural network (GA-ANN) used for three mental tasks-based BCI classifications[23]. This paper dealt with spectral feature extraction in correlation with time, and the suited method is wavelet transform (WT). Other most important property of wavelet basis selection available with WT helps to choose the matching function with the input signal. Wavelet selection _____________________________________
• Sanjay Ganorkar currently working as professor at electronics and telecommincation department of Sinhgad College of Engineering, Pune, India. E-mail: [email protected] • Vrushali Raut research scolar at electronics and
1002 technique proposed in this work is based on energy
compaction in the approximate band. Energy compaction is more in the approximate band for more matching wavelet. The wavelets concentrating more energy in the approximate band after applying on the signal are selected for feature extraction. Paper also dealt with feature optimization, considering signal from selected channel C4 out of 28 available channels. Optimization continued by extracting the features from the approximate band and band covering µ and β range of frequency accommodating ERD and ERS. Along with statistical features, this work proposes higher-order statistical features representing dynamics of the signal as input to the classifier in this system. SVM with kernel trick variation ranging from Gaussian, polynomial, quadratic to multilayer perceptron used to get maximum classification accuracy.
2
D
ISCRETEW
AVELETT
RANSFORM FOREEG
S
IGNALBiomedical signals like EEG are non-stationary signals. A wavelet transform is an appropriate method for time-frequency representation of such signals. By literature survey, ERD and ERS can sever as distinguishing events for motor imagery signal. Extracting features from these events keeping correlation of time and frequency (T-F) domain can boost the classification accuracy. Wavelet basis function selection for WT further increases the correlation of the signal and basis, helping for efficient representation of the signal in the T-F domain[24]. Wavelet analysis consists of a signal representing the linear combination of a set of the function obtained by shifting and dilating mother wavelet. The decomposition of signal x(t) leads to a set of coefficients called approximate coefficients aj,k and detail coefficients dj,k as in equation (1).
, . , .
( )
j k j k( )
j k j k( )
j j k
x t
a
t
d
t
(1)Where ψi,j(t) is the wavelet function and ϕj,k(t) is the scaling function, j is scaling parameter and k is translation parameters.
2.1 Methods for Wavelet Selection
Selecting wavelet basis function plays a very crucial role in signal classification; it completely relies on the similarity between the signal under test and scaled version of the base wavelet. Wavelet band filter characterized by properties like regularity, vanishing moments, and shift variance degree used for wavelet basis selection[25]. Another basis selection criteria ratio of maximum energy to Shannon entropy used for mechanical signal[26]. Quantitative approaches also suggested for wavelet basis function selection works on minimum description length (MDL) principle[27]. As suggested by David Salomon, the energy of correlated data is concentrated in the first few transform coefficients[28]. This work uses the concept that, if the correlation between the wavelet basis function and the signal under test is more than the approximation band contains maximum energy. Thus paper suggests applying wavelet on the signals to check for the concentration of energy in the approximate band for selection of matching wavelet. This work further suggested that as µ and β band accommodates the modulations due to motor imagery, they will represent specific characteristics when applied by the wavelet matching with the basic signal. This will leads to efficient classification. An empirical analysis of various wavelet functions for band energy can help in supporting this idea. Daubechies and biorthogonal wavelets are preferred by literature to be applied on biomedical
signals[29][30]. All variants of Daubechies, an orthogonal wavelet and biorthogonal wavelet with linear phase are selected for experimenting.
2.2 Feature Extraction and Feature Selection
A statistical representation of wavelet coefficients instead of wavelet coefficients corresponding to various bands characterized as strong input to the classifier. Second-order statistical features like variance standard deviation and mean when combined with higher-order statistical (HOS) feature can act as strong input to the classifier. HOS features are useful for extracting dynamics of signal and are proved for the characterization of sleep spindles in EEG signal[31]. Kurtosis is used in noise scaling more efficiently than other statistical quantities for noise estimation[32]. Higher-order statistics contain higher-order moments and non-linear combinations of higher-order moments, which are known as cumulants. In this work, Skewness and Kurtosis are two cumulants used as HOS features. Selecting the electrode of interest for motor movement and extracting features from a band of interest is an important step for feature selection as well optimisation.
3 DESCRIPTIONS OF DATABASE
Dataset used for this work provided by Intelligent Data Analysis Group, Department of Neurology, Berlin. Dataset was recorded on a normal subject without feedback session. The subject was sitting in a chair with arms resting on the table and fingers in typing position on the computer keyboard. The task provided was to press the keys with the index and little fingers. The recorded experiment consists of 3 sessions of 6 minutes each. Average typing speed was 1 key per second.
3.1 Format of the data
Data consist of 316 epochs, each epoch is of 500ms length and is ending 130ms before a keypress to avoid signal due to mechanical movement. Labeling used is 0 for left-hand movements, and 1 for right-hand movements, the Sampling frequency is 1000Hz. A Neuro-scan amplifier with Ag/AgCl electrode used for recording. The number of electrodes is 28 and placed according to the international 10/20 system. Signals recorded at 1000 Hz with a band-pass filter between 0.05 and 200 Hz[33].
4 PROPOSED SYSTEM
The system proposes wavelet decomposition of the signal and separates the band of interest. The work proceeds with the empirical analysis for wavelet basis selection by computing band energy for approximate coefficients. The wavelet accumulating more energy in approximate band is considered to be matching wavelet function. Wavelet coefficients extracted using matching wavelets are used for generating statistical and higher-order statistical features from a band of interest. The extracted features are passed to the classifier and classification accuracy is evaluated using different kernel function.
4.1 Wavelet Decomposition
1003 imagination of movement, they are frequency and time-bound.
Selecting the suitable variant of wavelet basis function matching these events can extract the important features. As the EEG signal under test is sampled at a frequency of 1000Hz and band to be separated are µ and β, Using equation (2), 6 levels for decomposition is obtained, the frequency range corresponding to each band is as specified in Table 1.
1
2
jF
s
F
j2
jF
s (2) TABLE 1WAVELET DECOMPOSITION BAND AND CORRESPONDING FREQUENCY RANGE
Decomposed sub-band
Frequency Range(Hz) D1 500-1000 D2 250-500
D3 125-250
D4 62.5-125 D5 31.25-62.5 D6 15.625-31.2 A6 0-15.625
4.2 Wavelet selection
Daubechies and biorthogonal, popular mother wavelets for biomedical signals are selected. Wavelets available in the library of MATLAB for Daubechies and used for testing are db1, db2, db3, db4, db5, db6, db7, db8, db9, db10, db11, db12, db13, db14, db15, and db16. Biorthogonal wavelets used are bior1.1, bior1.3, bior1.5, bior2.2, bior2.4, bior2.6, bior2.8, bior3.1, bior3.3, bior3.5, bior3.7, bior3.9, bior4.4, bior5.5, bior6.8. Approximate band energy is extracted by applying each wavelet on all 316 signals under test. Average approximate band energy is calculated for every wavelet as specified in table 2 for Daubechies wavelet and table 3 for biorthogonal wavelet. Based on these average values, lower limit has been set to 80% of maximum band energy and the numbers of signals having band energy above this threshold are calculated. It has been found that 90% of signals lay above the threshold. Concluding that approximate band of wavelet concentrates energy depending on its matching with the underlying signal. From table 2 it can be acknowledged that db10, db13, db14, and db15 carries maximum energy in approximate band whereas Table 3 acknowledged bior2.8, bior3.1, bior5.5 and bior6.8 carrying maximum energy in the approximate band. These variants of wavelet basis functions are selected for the process of feature extraction.
TABLE 2
AVERAGE APPROXIMATE BAND ENERGY OF DAUBECHIES WAVELETS APPLIED ON 316 TEST SIGNALS
Daubechies wavelets
Average Band Energy db1 51.20994 db2 65.18798 db3 69.74599 db4 71.78429 db5 73.28987 db6 74.33134 db7 74.6944 db8 74.58228 db9 74.9237 db10 75.25192
db11 74.96743 db12 75.0679 db13 75.32244 db14 75.55061 db15 75.38548
TABLE 3
AVERAGE APPROXIMATE BAND ENERGY OF BIORTHOGONAL WAVELETS APPLIED ON 316 TEST SIGNALS
Biorthogonal wavelets
Approximate Band Energy
bior1.1 51.20994 bior1.3 66.01561 bior1.5 71.41573 bior2.2 72.00769 bior2.4 75.81602 bior2.6 77.83013 bior2.8 78.59862 bior3.1 78.49326 bior3.3 70.9335 bior3.5 72.86749 bior3.7 74.2057 bior3.9 74.53814 bior4.4 77.86559 bior5.5 81.09622 bior6.8 81.57216
4.3 Optimized Feature extraction
After selecting the variant of wavelet basis next step is to extract the features. Motor movements are prominently observable on electrode C3 and C4, which are situated on motor-related part of the brain. Electrodes on the contralateral side are responsible for capturing ERD whereas that on ipsilateral for ERS. Thus C3 and C4 electrode can collect ERD and ERS of the signal and hence the motor-related variability. In this work signals only from channel C4 are considered. Applying wavelet transform on signals from the selected electrode with a specific wavelet and extracting statistical(mean, variance and standard deviation) as well higher-order statistical features(skewness and kurtosis) from the approximate band and the band of interest is the process coming under optimized feature extraction. Wave energy is one more feature extracted from wavelet bands of interest. Limiting the electrodes as well as limiting the features is usefull in boosting classification accuracy.
4.4CLASSIFIER AND EVALUATION MEASURES
SVM though a linear classifier can be used for nonlinear boundaries by ―kernel trick‖. It adds a little to the classifier’s complexity but is useful for mapping the data too much higher dimensionality. Out of 316 signals available, 158 alternate signals are used for training of SVM and remaining 158 used for testing. This work dealt with kernels like Gaussian (RBF), Quadratic kernel, polynomial kernel, and MLP kernel.
1004 and Multilayer Perceptron as kernel functions to obtain
classification accuracy as given in table 4. The results indicates that maximum classification accuracy obtained is 83% for db10 using MLP kernel function. Db10 also claims the maximum classification accuracy for almost all kernel functions. The variation introduced in feature of the signal by ERD and ERS is key factor for classifying the right-hand movement (RHM) and left-hand movement (LHM). This reason leads to proclaiming separate classification accuracy for left-hand movement and right-left-hand movement (RHM), if signal collected from a specific electrode. The signal from channel C4 used in this work lays on the ipsilateral side of the brain for RHM thus collect ERD for LHM and ERS for RHM.
TABLE 4
CLASSIFICATION ACCURACY FOR DIFFERENT KERNEL FUNCTION
Percent Classification Accuracy
Wavelet Function
Linea r kerne l
MLP Kernel
Quad. Kernel
Gaus. Kernel
Poly. Kerne l
bior2.8 81.71 80.88 77.56 77.56 78.67 bior3.1 77.56 80.27 74.51 77.56 77.00 bior5.5 78.39 81.16 78.67 80.05 79.50 bior6.8 80.55 82 80.62 81.16 80.37 db13 80.45 80.60 78.39 79.77 79.50 db10 81.60 83 80.60 82.32 81.80 db14 78.67 79.50 80.33 80.33 79.77 db15 77.56 75.90 74.51 77.83 76.73
5.1 Results for Daubechies wavelets
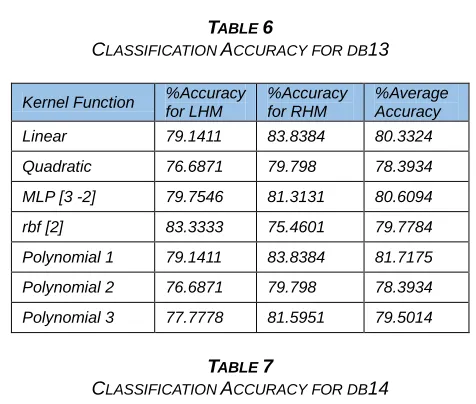
Table 5 displays the difference in classification accuracy for RHM and LHM for db10. Wavelet classified RHM accurately with 83.83% for MLP kernel, whereas it gives an average accuracy of 83%. Table 6 gives a result for db13, the classification accuracy of 83.83% obtained for RHM with a linear and polynomial kernel, whereas 81% average accuracy. Db14 gives 88.3% classification accuracy with the gaussian(RBF) kernel for RHM, but average accuracy goes down to 81.16% displayed in Table 7. Db15 displays classification accuracy of 84% with gaussian (RBF) kernel for RHM but average accuracy is not comparable as is less than 80% in Table 8. From these results, it can be concluded that accuracy for RHM is more as wavelet found more matching with ERS of the C4 channel. Finally, db10 emerges to be matching wavelet from the Daubechies family, which gives maximum average accuracy. Comparison of classification accuracy of db10 for various kernel functions is given in Fig. 1.
TABLE 5
CLASSIFICATION ACCURACY FOR DB10
Kernel Function %Accuracy for LHM
%Accuracy for RHM
%Average Accuracy Linear 80.9141 82.2929 81.6035
Quadratic 81.5951 79.798 80.6094
MLP [1 -6] 81.5951 83.8384 82.8255
Gaussian(rbf ) 79.7546 81.1634 82.3232
Polynomial 1 80.7791 82.8283 81.8037
Polynomial 2 80.9141 82.2929 81.6035
Polynomial 3 81.5951 79.798 80.6094
TABLE 6
CLASSIFICATION ACCURACY FOR DB13
Kernel Function %Accuracy for LHM
%Accuracy for RHM
%Average Accuracy Linear 79.1411 83.8384 80.3324
Quadratic 76.6871 79.798 78.3934
MLP [3 -2] 79.7546 81.3131 80.6094
rbf [2] 83.3333 75.4601 79.7784
Polynomial 1 79.1411 83.8384 81.7175
Polynomial 2 76.6871 79.798 78.3934
Polynomial 3 77.7778 81.5951 79.5014
TABLE 7
CLASSIFICATION ACCURACY FOR DB14
Kernel Function
%Accuracy for LHM
%Accuracy for RHM
%Average Accuracy Linear 76.6871 80.303 78.6704 Quadratic 77.3006 83.3006 80.6094 MLP [1 -6] 74.2331 83.8384 79.5014 Rbf [2] 70.5521 88.3838 80.3324 Polynomial 1 76.6871 80.303 78.6704 Polynomial 2 77.3006 83.3006 80.6094 Polynomial 3 78.2828 84.6626 81.1634
5.2 Results for biorthogonal wavelets
1005 77 78 79 80 81 82 83 84 85 Lin ear Qu ad ra ti c MLP [ 1 -6 ] G au ss ian (rb f ) Po ly n o m ial 1 Po ly n o m ial 2 Po ly n o m ial 3 Per ce n t Cl assi fi cation A cc u rac y Kernel Functions
Accuracy for LHM
Accuracy for RHM
Average Accuracy
FIGURE 1 COMPARISON OF CLASSIFICATION ACCURACY FOR WAVELET DB10 USING DIFFERENT KERNEL FUNCTIONS
TABLE 8
CLASSIFICATION ACCURACY FOR DB15
Kernel Function %Accuracy for LHM %Accuracy for RHM %Average Accuracy Linear 75.4601 79.2929 77.5623 Quadratic 71.7791 76.7677 74.5152
MLP [1 -6] 77.3006 74.7475 75.9003
rbf [2] 69.3252 84.8485 77.8393
Polynomial 1 75.4601 79.2929 77.5623 Polynomial 2 71.7791 76.7677 74.5152
Polynomial 3 77.3006 76.2626 76.7313
Comparative analysis of db10 and bior6.8 suggest both suitable for signal under test. Comparing with the classification accuracy obtained for other BCI database as well Berlin database used for this work, It can be stated that results are competitive and can be further improved by modifying the classifier[34][35][36].
TABLE 9
CLASSIFICATION ACCURACY FOR BIOR3.1
Kernel Function %Accuracy for LHM %Accuracy for RHM %Average Accuracy Linear 73.6196 80.8081 77.5623 Quadratic 73.2323 76.0736 74.5152
MLP [1 -2] 78.2345 82.3232 80.27885
rbf [2] 74.2331 80.303 77.5623 Polynomial
1 73.6196 80.8081 77.5623 Polynomial
2 73.2323 76.0736 74.5152 Polynomial
3 74.2331 79.2929 77.0083
TABLE 10
CLASSIFICATION ACCURACY FOR BIOR3.8
Kernel Function %Accuracy for LHM %Accuracy for RHM %Average Accuracy Linear 74.2331 85.3535 81.7175
Quadratic 75.4601 79.2929 77.5623
MLP [3 -25] 74.8466 85.8686 80.8864
rbf [24] 63.1902 89.3939 77.5623
Polynomial 1 74.2331 85.3535 81.7175
Polynomial 2 75.4601 79.2929 77.5623
Polynomial 3 76.0736 80.8081 78.6704
TABLE 11
CLASSIFICATION ACCURACY FOR BIOR5.5
Kernel Function %Accuracy for LHM %Accuracy for RHM %Overall Accuracy Linear 75.4601 80.8081 78.3934
Quadratic 77.3006 79.798 78.6704
MLP [4 -2] 80.8466 82.8283 81.83745
rbf [8] 78.5276 81.3131 80.0554
Polynomial 1 75.4601 80.8081 78.3934
Polynomial 2 77.3006 79.798 78.6704
Polynomial 3 77.2727 82.2086 79.5014
TABLE 12
CLASSIFICATION ACCURACY FOR BIOR6.8
Kernel Function %Accuracy for LHM %Accuracy for RHM %Average Accuracy Linear 81.8182 79.3006 80.5594
Quadratic 76.0061 85.2525 80.6293
MLP [1 -6] 77.9141 83.8384 82
rbf [2] 86.5031 77.2727 81.1634
Polynomial 1 75.4601 85.2828 80.37145
Polynomial 2 81.8182 79.3006 80.5594
Polynomial 3 76.0061 85.2525 80.6293
7 CONCLUSIONS
1006
FIGURE 2 COMPARISON OF CLASSIFICATION ACCURACY FOR WAVELET BIOR6.8 USING DIFFERENT KERNEL FUNCTIONS
Out of 28 Channels available, the signal from channel C4 corresponding to ERD of LHM and ERS of RHM is used for applying wavelet. Wavelet Coefficients are extracted for the signals by applying selected wavelets. Higher-Order Statistical features skewness and kurtosis are proposed with second-order statistical features for representing dynamics of the signal. Extracted features are passed to the classifier and tested for linear, Gaussian, quadratic, polynomial, and multi-layer perceptron kernel. Classification accuracy calculated with selected wavelets verifies bior6.8 and Db10 as the optimally matched wavelet. Bior6.8 and db10 give an average classification accuracy of 82.01% and 83% respectively. Classification accuracy can further be improved by upgrading machine learning used in the classifier. The proposed system will be helpful for building MI based independent BCI.
REFERENCES
[1] T. Mulder, ―Motor imagery and action observation : cognitive tools for rehabilitation,‖ J. Neural Transm., vol. 2, pp. 1265– 1278, 2007.
[2] M. P. G. Pfurtscheller , Ch. Neuper, D. Flotzinger, ―EEG-based discrimination between imagination of right and left hand movement,‖ Electroencephalogr. Clin. Neurophysiol. ELSEVIER, vol. 103, pp. 642–651, 1997.
[3] H. Cho, M. Ahn, S. Ahn, M. Kwon, and S. Chan, ―EEG datasets for motor imagery brain computer interface,‖ Gigascience, 2017.
[4] T.-P. Jung, S. Makeig, C. Humphries, T.-W. Lee, M. J. McKeown, V. Iragui, and T. J. Sejnowski, ―Removing electroencephalographic artifacts by blind source separation,‖ Psychophysiology,Cambridge Univ. Press. Print. USA., vol. 37, no. 2, pp. 163–178, 2000.
[5] K. Gramann, D. P. Ferris, J. Gwin, and S. Makeig, ―Imaging natural cognition in action.,‖ Int. J. Psychophysiol., vol. 91, no. 1, pp. 22–9, Jan. 2014.
[6] K. E. Misulis, ―Introduction to EEG,‖ EEG Signal Process., no. October 2015, pp. 1–34, 2007.
[7] K. Revett, ―On the use of rough sets for artefact extraction from EEG datasets,‖ Proc. Front. Converg. Biosci. Inf. Technol. FBIT 2007, pp. 425–430, 2007.
[8] G. Blanchard and B. Blankertz, ―BCI Competition 2003— Data Set IIa: Spatial Patterns of Self-Controlled …,‖ IEEE Trans. Biomed. Eng., vol. 51, no. 6, pp. 1062–1066, 2004.
[9] Finucane, ―A parametric feature extraction and classification strategy for brain computer interfacing,‖ IEEE Trans. Neural Syst. Rehabil., vol, no. 1, p. 13pp12-17, 2005.
[10]G. E. Birch, S. G. Mason, and J. F. Borisoff, ―Current trends in brain-computer interface research at the Neil Squire Foundation.,‖ IEEE Trans. Neural Syst. Rehabil. Eng., vol. 11, no. 2, pp. 123–6, Jun. 2003.
[11]S. G. Mason and G. E. Birch, ―A brain-controlled switch for asynchronous control applications,‖ IEEE Trans. Biomed. Eng., vol. 47, no. 10, pp. 1297–1307, 2000.
[12]A. Bashashati, R. K. Ward, and G. E. Birch, ―A new design of the asynchronous brain computer interface using the knowledge of the path of features,‖ 2nd Int. IEEE EMBS Conf. Neural Eng., vol. 2005, no. Ic, pp. 101–104, 2005. [13]N. Yamawaki, C. Wilke, Z. Liu, and B. He, ―An Enhanced
Time-Frequency-Spatial Approach for Motor Imagery Classification,‖ IEEE Trans. Neural Syst. Rehabil., vol. 14, no. 2, pp. 250–255, 2006.
[14]C. E. Tenke, ―Reference-free quantification of EEG spectra : Combining current source density ( CSD ) and frequency principal components analysis ( fPCA ),‖ Clin. Neurophysiol., vol. 116, pp. 2826–2846, 2005.
[15]P. Poryzala and A. Materka, ―Biomedical Signal Processing and Control Cluster analysis of CCA coefficients for robust detection of the asynchronous SSVEPs in brain – computer interfaces,‖ Biomed. Signal Process. Control. Elsevier 2014, vol. 10, pp. 201–208, 2014.
[16]G. E. B. Mehrdad Fatourechi , Ali Bashashati , Rabab K. Ward, ―A hybrid genetic algorithm approach for improving the performance of the lf-asd brain computer interface 1 , ‖ ICASSP, pp. 345–348, 2005.
[17]M. Naeem, C. Brunner, and G. Pfurtscheller, ―Dimensionality Reduction and Channel Selection of Motor Imagery Electroencephalographic Data,‖ Comput. Intell. Neurosci., vol. 2009, 2009.
[18]J. Kevric and A. Subasi, ―Biomedical Signal Processing and Control Comparison of signal decomposition methods in classification of EEG signals for motor-imagery BCI system,‖ Biomed. Signal Process. Control ,elsevier, vol. 31, pp. 398–406, 2017.
[19]A. Bashashati, M. Fatourechi, R. K. Ward, and G. E. Birch, ―TOPICAL REVIEW A survey of signal processing algorithms in brain – computer interfaces based on electrical brain signals,‖ J. Neural Eng., vol. 4, 2007. [20]S. Sun and J. Zhou, ―A Review of Adaptive Feature
Extraction and Classification Methods for EEG-Based Brain-Computer Interfaces,‖ Int. Jt. Conf. Neural Networks, pp. 1746–1753, 2014.
[21]M. kolekar Abhishek kumar, ―Machine Learning Approach for Epileptic Seizure Detection Using Wavelet Analysis of EEG Signals,‖ Int. Conf. Med. Imaging, m-Health Emerg. Commun. Syst. Mach., pp. 412–416, 2014.
[22]S. K. Bashar, M. Imamul, and H. Bhuiyan, ―Identification of Motor Imagery Movements from EEG Signals Using Automatically Selected Features in the Dual Tree Complex Wavelet Transform Domain,‖ Univers. J. Biomed. Eng., vol. 3, no. 4, pp. 30–37, 2015.
[23]R. Chai, S. Member, S. H. Ling, S. Member, G. P. Hunter, Y. Tran, H. T. Nguyen, and S. Member, ―Brain – Computer Interface Classifier for Wheelchair Commands Using Neural Network With Fuzzy Particle Swarm Optimization,‖ vol. 18, no. 5, pp. 1614–1624, 2014.
1007 compression using modified SPIHT Supriya O . Rajankar *
and Raj K . Bhanushali,‖ Int. J. Biomed. Eng. Technol., vol. 22, no. 3, pp. 216–232, 2016.
[25]D. M. Aleksandra Mojsilovic, Rackov, ―On the Selection of an Optimal Wavelet Basis for Texture Characterization,‖ IEEE Trans. Image Process., vol. 9, no. 12, pp. 2043–2050, 2000.
[26]M. Akbari, H. Homaei, and M. Heidari, ―An Intelligent Fault Diagnosis Approach for Gears and Bearings Based on Wavelet Transform as a Preprocessor and Artificial,‖ Int. J. Math. Model. Comput., vol. 4, no. 4, pp. 309–329, 2014. [27]M. S. L. W. K. Ngui, ―Wavelet Analysis: Mother Wavelet
Selection Methods,‖ Appl. Mech. Mater., vol. 393, pp. 953– 958, 2013.
[28]D. Salomon, Data Compression, Springer, 3rd ed. 2003. [29]Y. Kutlu and D. Kuntalp, ―Feature extraction for ECG
heartbeats using higher order statistics of WPD coefficients,‖ Comput. Methods Programs Biomed., vol. 105, no. 3, pp. 257–267, 2011.
[30]A. E. C. Chai W. Kim, Rashid Ansari, ―A Class of Linear-Phase Regular Biorthogonal Wavelets,‖ in IEEE, 1992, pp. 673–676.
[31]T. Akgül, M. Sun, R. J. Sclabassi, and S. Member, ―Characterization of Sleep Spindles Using Higher Order Statistics and Spectra,‖ IEEE Trans. Biomed. Eng., vol. 47, no. 8, pp. 997–1009, 2000.
[32]L. N. S. S. D. A. Mahanta, ―Kurtosis-based noise estimation and multiscale energy to denoise ECG signal,‖ Signal, Image Video Process. Springer-Verlag London, pp. 235– 236, 2013.
[33]B. Blankertz, G. Curio, K. Müller, N. Group, K. B. Franklin, Ù. Ö. Ó. Þ. Øo, and Ù. Ö. Ð. Òo, ―Classifying Single Trial EEG: Towards Brain Computer Interfacing,‖ Adv. Neural Inf. Proc. Syst. 14 (NIPS 01), no. c, pp. 96–98, 2002.
[34]N. Brodu, F. Lotte, and A. Lecuyer, ―Comparative study of band-power extraction techniques for Motor Imagery classification,‖ 2011 IEEE Symp. Comput. Intell. Cogn. Algorithms, Mind, Brain, pp. 1–6, 2011.
[35]S. C. Li S., ―Classification of Single Trial EEG Based on Cloud Model for Brain-Computer Interfaces,‖ Life Syst. Model. Simulation. LSMS 2007. Lect. Notes Comput. Sci. Springer, Berlin, Heidelb., vol. vol 4689., pp. 335–343, 2007.