Article
1
Analysis of factors giving the opportunity for
2
implementation of innovations on the example of
3
manufacturing enterprises in the Silesian province
4
Henryk Wojtaszek1, Ireneusz Miciuła2,*
5
6
7
8
9
10
11
12
13
14
15
16
17
18
1 Social Academy of Sciences in Warsaw; h.wojtaszek@interia.pl
2 University of Szczecin, Institute of Finance; ireneusz.miciula@usz.edu.pl * Correspondence: ireneusz.miciula@usz.edu.pl;
Abstract: The paper analyzes the actions that improve innovativeness in production enterprises in the Silesian province. Innovation is one of the elements that allows to achieve a competitive advantage. It turns out justified to research various factors that are important in improving innovativeness. The research includes selected production enterprises in the Silesian province, adopting the descriptive statistics measures and statistic tests: random sample test, chi-square independence test and the non-parametric Kruskal-Wallis test based on a survey questionnaire. As part of the most important factors determining the possibilities of innovation by manufacturing companies were detected contacts with other enterprises, R&D centers and counseling institutions, competitive position of the company and creating appropriate incentive systems.
Keywords: innovation; innovative activities; analysis of factors; production enterprises.
19
20
1. Introduction
21
At the beginning of this study the basic knowledge of innovation, competitiveness and
22
specificity of functioning of production enterprises was assumed.
23
The research objective was to conduct an analysis in terms of innovative actions undertaken by
24
production enterprises in the Silesian province. These were small, medium and large enterprises.
25
The group of respondents was composed of owners of managers of the production enterprises as
26
well as their employees. The subject of the research activities included production enterprises in
27
the Silesian province. The research area covered the Silesian province. The research period was
28
2011-2016. A total of 310 production enterprises were surveyed in that time. The main reason for
29
limitation of the surveyed population was the cost and the time-consuming nature of the project.
30
Statistical Offices, Town Halls or Country Office did not have any data on the actual status of active
31
enterprises. The reasons for lack of this information were:
32
- no consistency in the provision of information by entrepreneurs, for example in relation to
33
cessation of activities,
34
- changing formats of reporting on economic operators,
35
- intended fraudulent behaviors of entrepreneurs, e.g. operating on the grey market [1-3].
36
Data from the Central Statistical Office were regarded as the most reliable source of information in
37
the Silesian province. The population data were generated from www.gov.pl, which were updated on
38
the basis of data from the Central Statistical Office in Katowice. Therefore, the population of
39
production enterprises was composed of the enterprises classified by the Central Statistical Office in
40
section C of the Classification of Economic Activities, namely “Industrial processing”, including:
41
- Division 10 - manufacture of food products,
42
- Division 11 - manufacture of beverages,
43
- Division 12 - manufacture of tobacco products,
44
- Division 13 - manufacture of textiles,
45
- Division 14 - manufacture of wearing apparel,
46
- Division 15 - Manufacture of leather and related products,
47
- Division 16 - manufacture of wood and of products of wood and cork, except
48
furniture;
49
manufacture of articles of straw and plaiting materials,
50
- Division 17 - manufacture of paper and paper products,
51
- Division 20 - manufacture of chemicals and chemical products,
52
- Division 21 - manufacture of basic pharmaceutical products, medicines and
53
pharmaceutical preparations,
54
- Division 22 - manufacture of rubber and plastic products,
55
- Division 23 - manufacture of other non-metallic mineral products,
56
- Division 24 - manufacture of basic metals,
57
- Division 25 - manufacture of fabricated metal products, except machinery
58
and equipment,
59
- Division 26 - manufacture of computers, electronic and optical products,
60
- Division 27 - manufacture of electrical equipment,
61
- Division 28 - Manufacture of machinery and equipment n.e.c,
62
- Division 29 - manufacture of motor vehicles, trailers and semi-trailers,
63
except for motorcycles,
64
- Division 30 - manufacture of other transport equipment,
65
- Division 31 - manufacture of furniture,
66
- Division 32 - other manufacturing.
67
As of 03 April 2017, there were 36 731 manufacturing enterprises registered in the Silesian province.
68
The status of the surveyed manufacturing enterprises was active during the analysis [4–7].
69
70
2. Materials and Methods
71
10% of enterprises meeting the time and spatial criteria were selected for the preliminary
72
research. A random number generator was applied to determine which enterprises from the list are
73
included in the sample. A request for participation in the survey was sent to the selected enterprises.
74
A positive reply was received from 310 enterprises. Regarding the size of the sample (research of
75
both the enterprises and employees of the selected enterprises), high costs, time-consuming nature
76
of the research, the sample was not broadened. For the survey of employee motivation, 2 employees
77
were selected for each of the micro enterprises, 5 for small enterprises, 10 for medium-sized
78
enterprises and 20 for large enterprises, with a total sample of 911 employees [8, 9].
79
The surveying process was carried out during meetings in the production enterprises’
80
premises, through telephone and electronic interviews (receiving the filled-in survey questionnaire
81
by electronic means). One of the employed motivating elements intended to obtain a greater number
82
for employee teams in the surveyed production enterprises [10]. The research was carried out
84
between 01.10.2016 and 03.10.2017, additionally confirming the validity of data in April 2018
85
(verification of the economic activity status in the analyzed enterprises), complementing and
86
obtaining additional data from the interviews conducted with employees of the production
87
enterprises.
88
The survey questionnaires included questions allowing to obtain information about:
89
the age of the enterprise, its size and range of activities,
90
types of innovations introduced by the enterprises and barrier to implementation,
91
evaluation of the innovation levels when compared to the competition, according to the
92
respondents,
93
having an innovation unit responsible for implementation of innovations,
94
factors that motivate the employees to implement innovation,
95
employing the measures that help in implementing the innovations.
96
The main hypothesis was put forward.
97
Main hypothesis: Creating appropriate incentive systems improved the opportunity for implementation
98
of innovations in production enterprises.
99
In order to verify the main hypothesis, detailed hypotheses were put forward:
100
The type of implemented innovations depended on the size of the company, the range of its
101
activity and its age.
102
The employment size does not determine the type of implemented innovation.
103
The range of company’s activity determines the implementation of innovation [11].
104
Having an innovation unit does not depend on the size of the company.
105
The range of the company’s activities significantly determined the fact of having an
106
innovation unit [12].
107
The type of implemented innovations depended on whether a company had an innovation
108
unit.
109
The reason for not implementing any innovations is lack of development capital [13].
110
The barriers to growth faced by the surveyed enterprises depended on the size of the
111
enterprises.
112
The range of company’s operations posed a significant determinant for the barriers to growth
113
[14, 15].
114
Statistical analysis methods were used to develop the research results: descriptive statistics
115
measures and statistical tests: random sample test, chi-square independence test and non-parametric
116
Kruskal-Wallis test. The random sample test, also called the series test, verifies the zero hypothesis:
117
H0: the sample is random
118
towards the alternative hypothesis:
119
H1: the sample is not random.
120
The hypothesis verification procedure is as follows:
121
1. the determination of Me median from the sample,
122
2. assign each element of the sample with xi, according to the order of sampling
123
the test items, the symbol a, if xi <Me, or the symbol b, if xi> Me,
124
the result xi = Me can be ignored,
3. determination of the total number of k series, where a series is any sub-string of a series of a
126
and b element, having the property that all consecutive elements of the sub-string are of the
127
same type,
128
4. assuming that the zero hypothesis is true, the number of k series has a known and tabulated
129
distribution,
130
5. the rejection area is two-sided. From the distribution tables for the series numbers for the
131
presumed significance α, n1and n2 (abundance a and b) we take such critical values k1 and k2,
132
so relationships 𝑃 𝑘 ≤ 𝑘1 = 𝛼
2 and 𝑃 𝑘 ≤ 𝑘2 = 1 − 𝛼
2 can occur,
133
6. provided 𝑘 ≤ 𝑘1 or 𝑘 ≥ 𝑘2 the hypothesis of randomness of the sample is rejected,
134
whereas
135
when 𝑘1< 𝑘 < 𝑘2 there's no basis for rejecting the hypothesis of randomness of the sample.
136
Where the sample is large, i.e.𝑛1> 20 or 𝑛2> 20the above tables cannot be used because, with the
137
increase in the number of 𝑛1 and 𝑛2 the distribution of the number of series k tends to a normal
138
distribution, so that the value of the Z statistic has the following form:
139
𝑍 =
𝑘 − 2𝑛1𝑛2
𝑛1+ 𝑛2+ 1
2𝑛1𝑛2 2𝑛1𝑛2− 𝑛1− 𝑛2
𝑛1+ 𝑛2 2 𝑛1+ 𝑛2− 1
(1)
From the normal distribution tables 𝑁(0,1) a critical value is determined 𝑢𝛼to have the following
140
relationship for a predetermined materiality level α: 𝑃 𝑍 ≥ 𝑢𝛼 . If the value of the sample U
141
statistics is such that 𝑍 ≥ 𝑢𝛼, we reject the H0hypothesis, whereas when 𝑍 < 𝑢𝛼, there are no
142
grounds to reject the H0 hypothesis.
143
The chi-square independence test verifies the zero hypothesis:
144
H0: two variables are independent.
145
towards the alternative hypothesis:
146
H1: variables are dependent.
147
A verifying statistics is:
148
𝜒2= 𝑛𝑖𝑗 − 𝑛 𝑖𝑗
2
𝑛 𝑖𝑗
𝑘
𝑗 =1 𝑙
𝑖=1
(2)
where:
149
- 𝑛𝑖𝑗 - actual values
150
- 𝑛 𝑖𝑗 - theoretical values calculated according to the formula 𝑛 𝑖𝑗 = 𝑛𝑖𝑛𝑗
𝑛
151
The test statistic, assuming that the zero hypothesis is true, has the following distribution 𝜒2 with
152
(𝑘 − 1)(𝑙 − 1) degrees of freedom, where 𝑘 indicates the number of columns (number of variants of
153
the first attribute) of the analyzed cross table and l indicates the number of rows (number of variants
154
of the second attribute). The critical area of this test is the right-hand area 𝜒𝛼2;∞where 𝜒𝛼2 is the
155
critical value read from the distribution tables 𝜒2 for the predetermined significance level α.
156
The Kruskal-Wallis test is used to compare average values between groups. It is a
157
non-parametric alternative for the single-factor variance analysis, ANOVA. ANOVA single-factor
158
variance analysis can be used in the case of random samples, compliant with a normal distribution
159
requirements for the ANOVA variance analysis. These requirements are often difficult to be met,
161
especially in a situation where lack of funds does not allow to broaden the sample, or when the
162
surveyed population is small. The only requirements for the Kruskal-Wallis test are [10, 16]:
163
the dependent variable should be measured on at least an ordinal scale (it can also be
164
measured on a quantitative scale)
165
the observations in the analyzed groups should be independent of each other, which means
166
that a person remaining in one group should also be available in another comparable group.
167
The research results are presented in the paper in a graphic and table format.
168
3. Results
169
The survey covered owners and managers of 310 production enterprises operating in the
170
Silesian province. These enterprises were randomly selected from a population of all production
171
enterprises, resulting in a sample of varied enterprises, in terms of both the profile of activity and its
172
age. The obtained sample was random and was confirmed by the results of the series test 𝑍 =
173
−1,538; 𝑝 = 0,124. There were no grounds to reject the hypothesis of a random character of the
174
sample.
175
The surveyed production enterprises had existed on the market for 20.8 years on average. The
176
youngest company was 1 year old, and the oldest one was 141 years old. The standard deviation of
177
the surveyed enterprises’ age was 18.16 years, meaning that the coefficient of variation was at the
178
level of 87%. This means a vary large diversity of the surveyed enterprises. A typical company had
179
existed on the market for 2.6 - 39.9 years, thus typical enterprises were almost 94% of the sample.
180
Only 3 enterprises were younger than those typical. There were 16 older enterprises, and they
181
accounted for almost 5% of the surveyed group. The surveyed group was characterized by a right
182
asymmetry, meaning that there were more young enterprises (figure 1).
183
184
185
Figure 1. The age of the surveyed production enterprises. Source: own study based on data from
186
questionnaires.
187
The vast majority of surveyed enterprises, i.e. as much as 72.58%, were micro enterprises employing
188
up to 9 employees. Every fifth enterprise (21.94%) was a small enterprise with 10 to 49 employees.
189
Less than 5% of enterprises were medium enterprises employing from 50 to 249 employees. Large
190
companies account for only 0.65% of the surveyed manufacturing enterprises (figure 2).
191
0 5 10 15 20 25
1 3 5 7 9 11 13 15 17 19 21 23 25 27 29 31 33 35 37 39 42 86
132
A
ge
of
th
e
en
te
rp
ri
se
i
n
ye
ar
s
192
193
Figure 2. Structure of the surveyed production enterprises by employment size. Source:
194
own study based on data from questionnaires.
195
Having the data on the enterprises age and employment size, the hypothesis that the average age of
196
companies depends on the enterprise size has been verified. Results of the Kruskal-Wallis test
197
𝐻 3 = 3,757; 𝑝 = 0,289 carried out did not allow to confirm this hypothesis. No differences were
198
found between the average ages of particular groups of enterprises by size of employment. The
199
average age of micro, small and large enterprises was 17 years (figure 3). The average age of the
200
medium-sized enterprises was 20 years. The difference was not statistically significant [9,15].
201
202
Figure 3. Average age of enterprises by employment size. Source: own study based on data from
203
questionnaires.
204
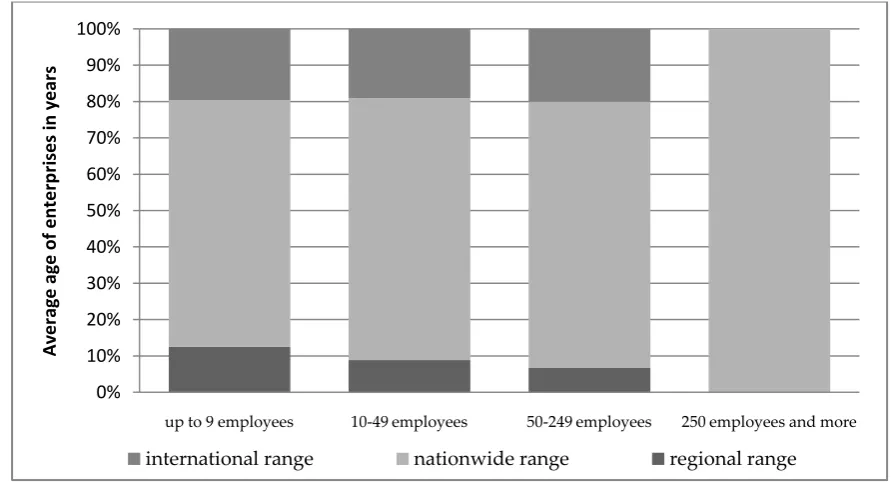
The majority of surveyed enterprises (69%) covered the area of the whole country with their
205
scope of activity. Every fifth enterprise (20%) operated on the international market. The smallest
206
group was constituted by enterprises of local range (11%).
207
The enterprise age may determine the range of enterprises operations. Longer-established
208
companies may have greater range of the operation. Results of the Kruskal-Wallis test 𝐻 2 =
209
0,934; 𝑝 = 0,627 carried out did not allow to confirm this assumption. There were no statistically
210
72% 22%
5% 1%
up to 9 employees
10-49 employees
50-249 employees
0 5 10 15 20 25
up to 9 employees 10-49 employees 50-249 employees 250 employes and more
A
v
era
g
e
ag
e
o
f e
nte
rpris
es
in
y
ea
rs
significant differences in the length of existence of enterprises by the range of their operations. The
211
average age of the enterprises operating on a regional and international market was 16 years, and
212
the enterprises operating on the national market 0 17 years.
213
The range of operations of the companies can also depend on the size of the enterprise. Larger
214
companies may need a larger range of activities. Results of the conducted chi-square independence
215
test𝜒2 6 = 2,012; 𝑝 = 0,919 did not confirm this presumption in relation to the surveyed
216
companies. The majority of micro, small and medium-sized enterprises were of nationwide range.
217
All analyzed large enterprises covered the territory of the whole country with their range. Difference
218
in enterprise structure by employment size and range of operations were not statistically significant
219
(figure 4).
220
221
222
Figure 4. Structure of enterprises by employment size and range of activity. Source: own study
223
based on data from questionnaires.
224
The success of an enterprise may depend on its competitive advantage resulting from the introduced
225
innovations. Innovations may be of various character. The majority of surveyed enterprises (58%)
226
introduced such innovations which the respondents were unable to determine the character of or
227
could not decide whether the innovations have been implemented at all. 15% of companies
228
introduced product innovations. Every tenth surveyed company introduced technological
229
innovations (10%) or process innovations (10%). Marketing innovations were introduced by 7% of
230
the surveyed production enterprises. In total, about 42% of the surveyed enterprises introduced
231
some specific innovations (figure 5).
232
233
0% 10% 20% 30% 40% 50% 60% 70% 80% 90% 100%
up to 9 employees 10-49 employees 50-249 employees 250 employees and more
A
ve
rag
e
age
o
f e
n
te
rp
ri
ses
in
year
s
234
Figure 5. Structure of surveyed enterprises by the range of activity. Source: own study based on data
235
from questionnaires.
236
The type of introduced innovations may depend on how long the company has been operating
237
on the market. Results of the Kruskal-Wallis test 𝐻 4 = 2,380; 𝑝 = 0,666 did not confirm this
238
hypothesis. There were no statistically significant differences between the average length of
239
existence of the surveyed enterprises by the type of innovations introduced. The enterprises that
240
introduced the product innovations had existed on the market for 18 years on average, similarly to
241
the enterprises that introduced the marketing innovation. The enterprises which introduced the
242
technological innovations had existed on the market for 16 years on average. The longest-established
243
companies on the market were those that introduced process innovations. Companies that did not
244
introduce any innovations or introduced some innovations of other nature had existed on the
245
market for 16 years.
246
The employment size may determine the type of introduced innovations. Results of the
247
conducted chi-square independence test𝜒2 12 = 15,066; 𝑝 = 0,238 however, they do not confirm this
248
presumption for the surveyed production enterprises. The type of introduced innovations did not
249
depend on the size of surveyed enterprises. Micro, small and medium-sized enterprises introduced
250
the process, technological, product or marketing innovations to a similar degree (figure 6).
251
252
Figure 6. Structure of enterprises by employment size and type of introduced innovations. Source:
253
own study based on data from questionnaires.
254
15%
10%
7%
10% 58%
product
technological
marketing
process
other / I don't know
0% 10% 20% 30% 40% 50% 60% 70% 80% 90% 100%
up to 9 employees 10-49 employees 50-249 employees 250 employees and more
A
ve
ra
ge
a
ge
of e
nte
rpri
se
s
in
ye
ar
s
The range of enterprise’s activity may determine the introduction of innovations. This assumption
255
made in relation to the surveyed production enterprises has not been confirmed. Results of the
256
Chi-square independence test 𝜒2 8 = 5,979; 𝑝 = 0,650 clearly indicate that there is no link between
257
the type of innovation introduced and the range of activity of the surveyed manufacturing
258
enterprises. However, they do not confirm this presumption for the investigated companies.
259
Regardless of the range of enterprise’s activity, the largest number of companies did not introduce
260
any innovations or introduced some innovations of an unspecified nature (figure 7).
261
262
263
Figure 7. Structure of enterprises by range of activity and type of introduced innovations. Source:
264
own study based on data from questionnaires.
265
Introduction of innovations may be supported by an innovation unit in some enterprises. Only 9% of
266
the surveyed enterprises had such an innovation unit (figure 8).
267
268
Figure 8. Structure of surveyed enterprises depending on whether they have an innovation unit or
269
not. Source: own study based on data from questionnaires.
270
Having an innovation unit could depend on the age of the enterprise, its size and range of
271
activity. The results of the U-Mann-Whitney test 𝑍 = −1,000; 𝑝 = 0,317 did not show any
272
differences between the average company's existence due to the fact that there is an innovation unit.
273
0% 10% 20% 30% 40% 50% 60% 70% 80% 90% 100%
local range nationwide range international range
Av
era
g
e
ag
e
o
f e
nt
erpri
se
s
in
y
ea
rs
other / I don't know process marketing technological product
9%
91% we have an innovation unit
a unit was the same, and
274
Average age of an enterprise having such a unit and not having suchamounted to 17 years (figure 9).
275
276
Figure 9. Average age of the enterprises depending on whether they have an innovation unit or not.
277
Source: own study based on data from questionnaires.
278
The surveyed manufacturing enterprises most often did not have an innovation unit regardless
279
of the size of the company (figure 10), which was confirmed by the results of the chi-square
280
independence test𝜒2 3 = 5,373; 𝑝 = 0,146.
281
282
Figure 10. Structure of enterprises by employment size and type of introduced innovations. Source:
283
own study based on data from questionnaires.
284
In the case of the surveyed enterprise, a statistically significant determinant for having an innovation
285
unit was the range of the enterprise’s activity which was confirmed by the chi-square independence test
286
results𝜒2 2 = 6,962; 𝑝 = 0,031. In most cases these were the local-range enterprises that had the
287
0 2 4 6 8 10 12 14 16 18
we have an innovation unit we don't have an innovation unit
A
ve
rag
e
age
o
f e
n
te
rp
ri
ses
in
year
s
0% 10% 20% 30% 40% 50% 60% 70% 80% 90% 100%
up to 9 employees 10-49 employees 50-249 employees 250 employees and more
A
e
rag
e
ag
e
o
f e
n
te
rp
ri
ses
in
year
s
innovation unit, and such a unit was present in the international-range companies least often. The
288
greater the range of an enterprise, the less often it had an innovation unit (figure 11).
289
290
Figure 11. Structure of enterprises by employment size and type of introduced innovations. Source:
291
own study based on data from questionnaires.
292
In the surveyed enterprises, having an innovation unit did not influence the type of innovations
293
introduced, which was confirmed by the chi-square independence test𝜒2 4 = 1,017; 𝑝 = 0,907.
294
Therefore, having an innovation unit did not improve the frequency of innovations introduction
295
among the surveyed enterprises (figure 12). The innovations were introduced regardless of works
296
carried out in the specialized units of the surveyed enterprises.
297
298
Figure 12. Structure of enterprises depending on whether they have an innovation unit or not and
299
the type of introduced innovations. Source: own study based on data from questionnaires.
300
0% 10% 20% 30% 40% 50% 60% 70% 80% 90% 100%
local range nationawide range international range
A
ve
rag
e
age
o
f e
n
te
rp
ri
ses
in
year
s
we don't have an innovation unit we have an innovation unit
0% 10% 20% 30% 40% 50% 60% 70% 80% 90% 100%
we have an innovation unit we don't hav an innovation unit
A
ve
rag
e
age
o
f e
n
te
rp
ri
ses
in
year
s
In conclusion, it should be noted that the surveyed enterprises were diverse in terms of age,
301
range of activities and size of employment. These features did not have a significant statistical
302
impact on the type of innovations introduced. The innovations were also not dependent on whether
303
an enterprises had an innovation unit or not. The age of the enterprise and its size also did not
304
impact the fact of having an innovation unit or not. However, this was statistically significantly
305
influenced by the range of the enterprise’s operation. The lower the range, the more often an
306
enterprise had an innovation unit. It should therefore be recognized that the determinant of
307
introducing innovations should be sought outside factors such as the age of the enterprise, the range
308
of the enterprise's activity, the size of the enterprise and the fact of having an innovation unit or not.
309
Therefore, the factors that decide about the innovations may include: barriers for introduction of
310
innovations in the enterprise, contacts with other enterprises, R&D centers and counseling
311
institutions, competitive position of the company.
312
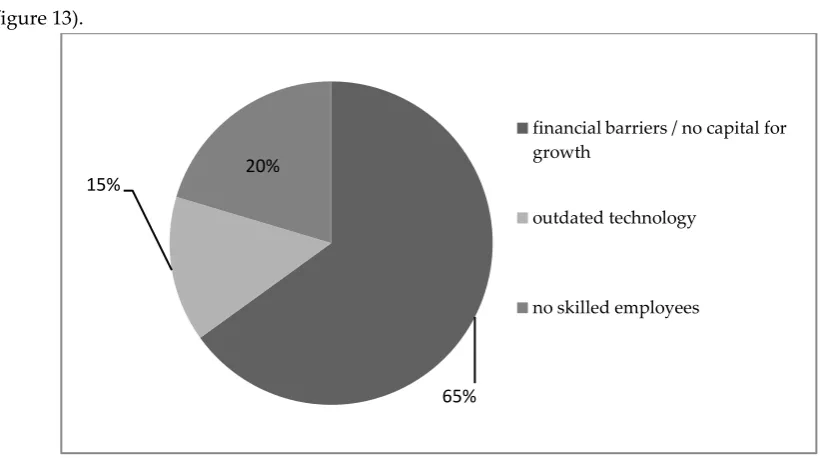
In the vast majority, the surveyed manufacturing enterprises (65%) faced a lack of capital for
313
growth, which may be reflected in issues with introducing innovations. One in five enterprises
314
reported a lack of skilled workers as a barrier to growth, while 15% reported outdated technology
315
(figure 13).
316
317
Figure 13. Structure of researched enterprises by barriers to growth. Source: own study based on
318
data from questionnaires.
319
Barriers faced by the analyzed companies did not depend on the age of the enterprises, which
320
was confirmed by the results of the Kruskal-Wallis test 𝐻 2 = 2,648; 𝑝 = 0,266. The enterprises
321
complaining of lack of capital for growth had operated on the market for 17 years on average. The
322
companies that recognized an outdated technology as the barrier to growth had existed for 14 years
323
on average, the the companies complaining about lack of skilled workers - 18 years. The differences
324
among the listed average values were not statistically significant.
325
4. Discussion and Conclusions
326
Authors discuss the results and how they can be interpreted in perspective of previous studies
327
and of the working hypotheses. The research objective was achieved by performing an analysis of
328
activities influencing innovative actions in manufacturing enterprises of the Silesian province. Small,
329
65%
15% 20%
financial barriers / no capital for growth
outdated technology
medium and large enterprises were surveyed. The group of respondents was composed of owners of
330
managers of the production enterprises as well as their employees. The subject of the research
331
activities included production enterprises in th Silesian province. The research area covered th
332
Silesian province. The research period was 2011-2016. A total of 310 production enterprises were
333
surveyed in that time. The main reason for limitation of the researched population was the cost and
334
the time-consuming nature of the project. Statistical Offices, Town Halls or Country Office did not
335
have any data on the actual status of active enterprises. The reasons for lack of this information were:
336
inconsistency in the provision of information by entrepreneurs, for example in relation to cessation
337
of activities, changing reporting formats regarding the enterprise, intended fraudulent behaviors of
338
the entrepreneurs.
339
The conducted research suggests that the average age of the enterprises did not depend on their
340
size. The enterprise age may determine the range of enterprises operations. The success of an
341
enterprise may depend on its competitive advantage resulting from the introduced innovations [17].
342
Innovations may be of various character [18]. The longest-established companies on the market were
343
those that introduced process innovations.
344
The type of introduced innovations does not depend on the size of surveyed enterprises, which
345
is confirmed by many other studies [19, 20]. Micro, small and medium-sized enterprises introduced
346
the process, technological, product or marketing innovations to a similar degree. The range of
347
enterprise’s activity does not determine the introduction of innovations. Introduction of innovations
348
may be supported by an innovation unit in some enterprises. Only 9% of the surveyed enterprises
349
had an innovation unit. Having an innovation unit could depend on the age of the enterprise, its size
350
and range of activity [21].
351
In the case of the surveyed enterprise, a statistically significant determinant for having an
352
innovation unit was the range of the enterprise’s activity which was confirmed by the chi-square
353
independence test results𝜒2 2 = 6,962; 𝑝 = 0,031. In most cases these were the local-range enterprises
354
that had the innovation unit, and such a unit was present in the international-range companies least
355
often. The greater the range of an enterprise, the less often it had an innovation unit.
356
In the surveyed enterprises, having an innovation unit did not influence the type of innovations
357
introduced, which was confirmed by the chi-square independence test𝜒2 4 = 1,017; 𝑝 = 0,907.
358
Therefore, having an innovation unit did not improve the frequency of innovations introduction
359
among the surveyed enterprises. The innovations were introduced regardless of works carried out in
360
the specialized units of the surveyed enterprises in relation to age, range of activity and
361
employment size. These features did not have a significant statistical impact on the type of
362
innovations introduced. The innovations were also not dependent on whether an enterprises had an
363
innovation unit or not. The age of the enterprise and its size also did not impact the fact of having an
364
innovation unit or not [22]. However, this was statistically significantly influenced by the range of
365
the enterprise’s operation. The lower the range, the more often an enterprise had an innovation unit.
366
It should therefore be recognized that the determinant of introducing innovations should be sought
367
outside factors such as the age of the enterprise, the range of the enterprise's activity, the size of the
368
enterprise and the fact of having an innovation unit or not. Therefore, the factors that decide about
369
the innovations may include: barriers for introduction of innovations in the enterprise, contacts with
370
In the vast majority, the surveyed manufacturing enterprises (65%) faced a lack of capital for
372
growth [23, 24], which may be reflected in issues with introducing innovations. One in five
373
enterprises reported a lack of skilled workers as a barrier to growth, which is also confirmed by
374
other studies [25]. In addition, an important factor reported in the study was (15%) outdated
375
technology. The barriers that the analyzed enterprises had to face did not depend on the age of the
376
companies.
377
378
Author Contributions: “conceptualization, H.W.; methodology, H.W. and I.M.; software, H.W. and I.M.;
379
validation, H.W. and I.M.; formal analysis, H.W. and I.M.; investigation, H.W. and I.M.; resources, H.W. and
380
I.M.; data curation, H.W. and I.M.; writing—original draft preparation, H.W. and I.M.; writing—review and
381
editing, H.W. and I.M.; visualization, H.W. and I.M.; supervision, H.W. and I.M.; project administration, I.M.;
382
funding acquisition, I.M.”.
383
Funding: “The project is financed within the framework of the program of the Minister of Science and Higher
384
Education in Poland under the name "Regional Excellence Initiative" in the years 2019-2022, project number
385
001/RID/2018/19, the amount of financing PLN 10,684,000.00“.
386
Acknowledgments: Many thanks to Professor Joanna Nowakowska-Grunt and Professor Leon Dorozik for
387
scientific support and Justyna Miciuła for administrative and spiritual support.
388
Conflicts of Interest: The authors declare no conflict of interest.
389
References
390
1. Ja-Shen, Ch.; Hung, T.T.; Russell, Ch. Co-production and its effects on service innovation. Industrial
391
Marketing Management 2011, 40(8), 1331-1346, https://dx.doi.org/10.1016/j.indmarman.2011.03.001.
392
2. Behrouzi, F.; Wong, K. Y. Lean performance evaluation of manufacturing systems: a dynamic and
393
innovative approach. Procedia Computer Science, 2011, 3, 388-395.
394
https://dx.doi.org/10.1016/j.procs.2010.12.065.
395
3. Ponds, R.; Oort, F. V.; Frenken, K. Innovation, spillovers and university–industry collaboration: an
396
extended knowledge production function approach. Journal of Economic Geography, 2009, 10(2), 231-255.
397
https://dx.doi.org/10.1093/jeg/lbp036.
398
4. Bathelt, H. Geographies of production: growth regimes in spatial perspective 1-innovation, institutions
399
and social systems. Progress in Human Geography, 2003, 27(6), 763-778.
400
https://dx.doi.org/10.1191/0309132503ph462pr.
401
5. Mohnen, P.; Hall, B. H. Innovation and productivity: an update. Eurasian Business Review, 2013, 3(1), 47-65.
402
https://dx.doi.org/10.14208/BF03353817.
403
6. Lewis, M. A. Lean production and sustainable competitive advantage. International Journal of Operations &
404
Production Management, 2000, 20(8), 959-978. https://dx.doi.org/10.1108/01443570010332971.
405
7. Ngo, L. V.; O'cass, A. Innovation and business success: The mediating role of customer participation.
406
Journal of Business Research, 2013, 66(8), 1134-1142. https://dx.doi.org/10.1016/j.jbusres.2012.03.009.
407
8. Roper, S.; Du, J.; Love, J. H. Modelling the innovation value chain. Research policy, 2008, 37(6-7), 961-977.
408
https://dx.doi.org/10.1016/j.respol.2008.04.005.
409
9. Mairesse, J.; Mohnen, P. Using innovation surveys for econometric analysis. In Handbook of the Economics of
410
Innovation, Bronwyn H.H., Nathan R., Eds.; Elsevier: Amsterdam, Holland, 2010; Volume 2, pp. 1129-1155.
411
https://dx.doi.org/10.1016/S0169-7218(10)02010-1.
412
10. Love, J. H.; Roper, S. Organizing the innovation process: complementarities in innovation networking.
413
Industry and Innovation, 2009, 16(3), 273-290. https://dx.doi.org/10.1080/13662710902923776.
414
11. Klingenberg, B.; Timberlake, R.; Geurts, T. G.; Brown, R. J. The relationship of operational innovation and
415
financial performance—A critical perspective. International Journal of Production Economics, 2013, 142(2),
416
317-323. https://dx.doi.org/10.1016/j.ijpe.2012.12.001.
417
12. Dorenbosch, L.; Engen, M. L.; Verhagen, M. On‐the‐job innovation: The impact of job design and human
418
resource management through production ownership. Creativity and innovation management, 2005, 14(2),
419
13. Veza, I.; Mladineo, M.; Gjeldum, N. Managing innovative production network of smart factories.
421
IFAC-PapersOnLine, 2015, 48(3), 555-560. https://dx.doi.org/10.1016/j.ifacol.2015.06.139.
422
14. Stern, S.; Porter, M. E.; Furman, J. L. The determinants of national innovative capacity. Research Policy,
423
2002, 31(6), 899-933. https://dx.doi.org/10.1016/S0048-7333(01)00152-4.
424
15. Peri, G. Determinants of knowledge flows and their effect on innovation. The Review of Economics and
425
Statistics, 2005, 87(2), 308-322. https://dx.doi.org/10.1162/0034653053970258.
426
16. Aguado, S.; Alvarez, R.R.; Domingo, R. Model of efficient and sustainable improvements in a lean
427
production system through processes of environmental innovation. Journal of Cleaner Production, 2013, 47,
428
141-148. https://dx.doi.org/10.1016/j.jclepro.2012.11.048.
429
17. Miciuła, I. Methods of Creating Innovation Indices Versus Determinants of Their Values. Eurasian
430
Economic Perspectives. Eurasian Studies in Business and Economics, 2018, 8(2), 357-366.
431
https://dx.doi.org/10.1007/978-3-319-67916-7_23.
432
18. Giuseppe, I.; Szopik-Depczyńska, K; Stajniak, M.; Konecka, S. Supply chain and innovation activity in
433
transport related enterprises in Eastern Poland. Logforum 2016, 12 (4), 227-236. https://dx.doi.org/
434
10.17270/J.LOG.2016.4.4.
435
19. Capel, C. Mindfulness, indigenous knowledge, indigenous innovations and entrepreneurship. Journal of
436
Research in Marketing and Entrepreneurship, 2014, 16(1),
437
63-83. https://dx.doi.org/10.1108/JRME-10-2013-0031.
438
20. Galindo, M.A.; Mendez, M.T. Entrepreneurship, economic growth, and innovation: Are feedback effects at
439
work?. Journal of Business Research, 2014, 67(5), 825-829. https://dx.doi.org/10.1016/j.jbusres.2013.11.052.
440
21. Zhao, F. Exploring the synergy between entrepreneurship and innovation. International Journal of
441
Entrepreneurial Behaviour & Research, 2005, 11(1), 25-41, https://dx.doi.org/10.1108/13552550510580825.
442
22. Zwolak, J. The Effectiveness of Innovation projects in Polish industry. Review of Innovation and
443
Competitiveness: A Journal of Economic and Social Research, 2016, 2(1), 97-110.
444
https://dx.doi.org/10.32728/ric.2016.21/6.
445
23. Kraus, S.; Richter, Ch.; Brem, A.; Cheng, Ch.F.; Chang, M.L. Strategies for reward-based crowdfunding
446
campaigns. Journal of Innovation & Knowledge, 2016, 1(1), 13-23. https://dx.doi.org/10.1016/j.jik.2016.01.010.
447
24. Miciuła, I. Financial innovations on the currency market as new instruments to risk management. Journal of
448
International Studies, 2015, 8(1), 138-149. https://dx.doi.org/10.14254/2071-8330.2015/8-1/12.
449
25. Garcia, S.; Luis, J.; Perez-Ruiz S. Development of capabilities from the innovation of the perspective of
450
poverty and disability. Journal of Innovation & Knowledge, 2017, 2(2), 74-86.