www.technology.matthey.com
JOHNSON MATTHEY
TECHNOLOGY REVIEW
Towards 3D-Electrical Capacitance Tomography
for Interface Detection
Thresholding method improves accuracy for real-world 3D process monitoring
Peter J. Clark* and Giuseppe Forte
Johnson Matthey Technology Centre, Billingham, UK, TS23 1LB; and School of Chemical Engineering, University of Birmingham, Edgbaston, UK, B15 2TT
*Email: [email protected]
Mark J. H. Simmons
School of Chemical Engineering, University of Birmingham, Edgbaston, UK, B15 2TT
E. Hugh Stitt
Johnson Matthey Technology Centre, Billingham, UK, TS23 1LB
The application of three-dimensional electrical
capacitance tomography (3D-ECT) for the in situ
monitoring of a hard boundary or interface has been investigated using imaged phantoms that simulate real-life processes. A cylinder-in-tube phantom manufactured from polyethylene (PE), a low di-electric and non-conductive material, was imaged using the linear back projection (LBP) algorithm with the larger tube immersed at varying intervals to test the ability of the technique to image interfaces axially through the sensor. The interface between PE and air is clearly imaged and correlates to the known tube penetration within the sensor. The cylinder phantom is imaged in the centre of the sensor; however, the reduction in
measurement density towards the centre of the ECT sensor results in reduced accuracy. A thresholding method, previously applied to binary systems to improve the imaged accuracy of a hard boundary between two separate phases, has been applied to the 3D-ECT tomograms that represent the PE phantom. This approach has been shown to improve the accuracy of the acquired image of a cylinder of air within a non-conductive PE tube.
1 Introduction
however, 3D tomography provides spatial information in both radial and axial planes yielding greater process insight. The compromise when applying 3D methods as opposed to 2D is increased computing time, greater complexity of hardware and requirement for advanced reconstruction algorithms.
Electrical tomography is categorised as a ‘soft-fi eld’ method. The distribution of the electric fi eld within the sensor is unknown thus forming a non-linear relationship between the measured capacitances at the boundary of the sensor and the material distribution within the sensor. ECT is a specifi c form of electrical tomography applicable to systems with a non-conductive continuum and an insulating process vessel wall. It utilises a concentric ring of uniformly spaced electrodes fi xed to the outside of a non-conductive vessel wall. The signal-to-noise ratio (SNR) of the system is dependent upon the area of each electrode therefore studies have been conducted that determine the optimal size of ECT electrodes (1). Guard electrodes are also required to prevent process materials outside the sensing zone having an effect upon the electric fi eld distribution (2). The number of electrodes used within the sensor ring is a compromise between the required size of electrode to deliver the required SNR, the diameter of the electrode array (directly related to the diameter of the process vessel) and the desired reconstructed image accuracy, with a greater number of electrodes delivering increased spatial resolution.
There are two critical parameters when designing an ECT sensor: the ratio of permittivity of continuous and dispersed phases and the thickness of the sensor liner (3). When either of these phases has a high relative permittivity there is an increased electrical fl ux defl ection at the boundary of the ECT sensor that results in the relationship between material permittivity and measured capacitance becoming non-linear, typically at relative permittivity values εmat > 15. To image these
materials a new sensor was developed that applies internal rather than external electrodes to measure the boundary inter-electrode capacitance. This system has been used to image an air/de-mineralised water phantom and a water continuous oil-in-water dispersion designed to mimic process equipment in the oil industry such as separators and extraction units (3). Whilst the confi guration of the sensor solves the boundary linearity problem, it removes the non-intrusive advantage that traditional ECT has over competing methods. In the majority of the process industries it is unlikely that a pipe or unit will be taken offl ine for electrode fi tting, and
indeed due to the hazardous nature of the chemicals used any potential for containment risk is unacceptable.
Liquid hold up within a gas/liquid packed bed has been investigated using twin-plane ECT for application within chemical reactors. Initial measurements using single plane ECT were conducted to determine liquid drainage dynamics and determine their relationship with the gas velocity and packing particle size. Extensive calibrations were performed using twin plane ECT so as to accurately map bed hydrodynamics across the dual sensing zones and the use of tracer led residence time distribution (RTD) combined with ECT analysis to obtain hydrodynamic performance data was also investigated (4).
Image refi nement of 2D tomograms of high dielectric materials using commercially available ECT equipment has previously been addressed by the present authors (5, 6). The focus of that study was to vary the threshold value and optimise the image based upon image error as a function of the threshold. Two known methods for determining image error were compared: pixel-by-pixel (PbP) (Equation (i)) and areal (Equations (ii) and (iii)):
where ePbP is the error using the PbP approach, N is the total number of pixels, μimage is the imaged pixel value of pixel i in the tomogram and μreal is the theoretical pixel value of pixel i in the real system. The areal analysis is given as two stages; the fi rst calculates the area of the image occupied by the phantom:
where Aimage is the area of the image and AC is the cross-sectional area of the circular sensor chamber. The second stage calculates the error as a ratio of the difference between the areas of the imaged and real object to the area of the real object:
where eA is the image error calculated using the areal approach and Aphantom is the area of the phantom. These two methods were compared to determine the sensitivity of image error to threshold value. The
ePbP= 100
N N
i = 1
(μimage – μreal)
μreal (i)
Aimage = AC
μimage
N μimage<t
(ii)
eA =
Aimage– Aphantom
important conclusions were: (a) the optimal threshold values calculated using each method are consistent, demonstrating robustness; and (b) the calculated image error using the areal approach is much lower as it is not constrained to the pixel resolution.
A similar study was conducted with the aim of defi ning ‘limited region tomography’ (7, 8). This is a method based upon defi ning a region to which the reconstruction is applied using a narrowband pass fi lter. The accuracy of the image is increased by limiting the image area, thereby reducing the number of unknown pixels and enhancing the resolution. This approach has so far been applied predominantly for detection of deposits and scaling in pipes, although the potential applications stretch to any purpose whereby imaging of the whole tomographic plane is not essential. However, this method is currently not a commercially available technology.
The defi nitions of 3D and ‘pseudo-3D’ tomography are confusing and often misapplied in the existing literature on this subject. Until recently there was a lack of precision hardware and capable software that could obtain full 3D-ECT data, that is to say acquire and reconstruct electrode measurements in the axial, radial and angular dimensions (assuming cylindrical coordinates). Prior to suitable commercial equipment being available, 2D tomograms were stacked to obtain ‘pseudo-3D’ images of a process. The term ‘pseudo’ is used as there are no electrode measurements across the axial plane (9).
An electrical capacitance volume tomography (ECVT) approach has been used to monitor the hydrodynamics of the drying of wet granules with the purpose of being used in the pharmaceutical industry. From the 3D data gained the granule moisture content and drying medium velocity were calculated (10).
The majority of work so far in applied 3D-ECT research has used back-projection approaches for simplicity, however there has been some work done on a volumetric 3D approach using alternative reconstruction algorithms. A neural-network multi-criterion optimisation image reconstruction technique (NN-MOIRT) algorithm has been developed that effectively applies the optimisation approach across a Hopfi eld neural network (11). The results have been compared favourably with existing reconstruction algorithms such as the iterative fi ltered back projection technique (IFBPT) and the iterative linear back projection (ILBP) algorithm. The NN-MOIRT algorithm was then applied to a three phase bubble column so as to image multi-phase fl ows and showed the enhanced
accuracy of this method for 3D-ECT applications (12). The same group then used this approach to investigate the dynamics of spiral bubble plume motion in the entrance zone of bubble columns and three-phase
fl uidised beds (13). The NN-MOIRT approach was again combined with volumetric ECT to investigate a jet of air, issued from a single orifi ce, within a poppy seed bed of internal diameter 50 mm. The ECVT results were thresholded to yield optimal images and then compared directly with magnetic resonance imaging (MRI) data showing consistency at high air
fl ow rates, although the ECVT was less sensitive than MRI to changes at lower air fl ow. Standard deviation measurements across the ECVT images gave 7 mm in the radial plane and 8 mm in the axial plane, at least an order of magnitude higher than MRI. From this it may be concluded that signifi cant further improvement is required for ECT to be considered an accurate imaging technique (14).
In another study, moving objects were imaged using 3D-ECT. Images of a rod and a ball were separately moved down the central axis and periphery of the sensor (15). A Gauss-Newton reconstruction algorithm was used, another approach that is not yet commercially available and is largely confi ned to academia, yielding an image error of approximately 10% although this increased by 2% when the imaged objects were at the sensor periphery. Interestingly, a parallel study was conducted that arrived at the same conclusion in that the image error at the wall was greater than in the centre of sensor. The reasoning for this observation is that the incidence of convergence of electric fi eld lines is greater in the sensor centre than at the periphery leading to greater measurement integrity in the centre (5). An iterative non-linear reconstruction algorithm has also been applied to 3D-ECT measurement data and compared with traditional linear back projection; suffi ce to say the non-linear algorithm showed signifi cantly improved results (16).
The academic group responsible for the previously mentioned ‘limited region tomography’ (7, 8) also investigated using a novel ECT sensor coupled with a resolution analysis method to determine the sensitivity of image error and resolution to electrode and sensor design (17). This study provides a step change in the protocols used to design 3D-ECT sensors and certainly gives greater impetus to the argument for increased use of this technology in industry.
have been few works published using a commercial instrument. 2D-ECT has so far been applied to a wide range of engineering processes, however the majority of published work has been carried out on academic instruments in either single or dual plane confi guration. Few ECT instruments are commercially available and the capability for 3D image reconstruction amongst these is very low, the main reason being a lack of image accuracy which is problematic for real-world industrial applications. Indeed the implementation of a reconstruction package into a useable graphical user interface (GUI) has only recently been published (19).
The present paper addresses this need by applying commercially available 3D-ECT technology to image a series of mobile phantoms. The phantom used is a simple cylinder-in-tube setup that demonstrates both a moving object and a hard boundary, in this case the interface between polyethylene and air. A methodology, initially developed on 2D-ECT images, that improves image accuracy using optimised binary thresholds is then applied to the 3D-ECT tomograms.
2 Materials and Methods for 3D-ECT Imaging
The objectives of this work were to determine the usefulness of ECT as an online measurement tool for interface detection within a 3D sensing zone and to
investigate the capability of a commercially available ECT instrument to deliver 3D images of a transient system including an evolving interface.
2.1 Cylinder-in-Tube Phantom Confi guration
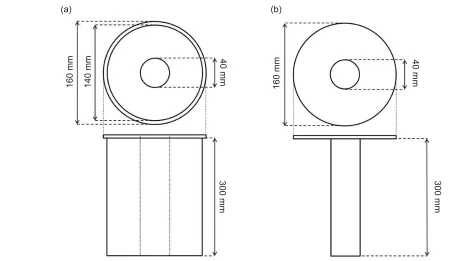
In order to show the development of a hard interface in the radial plane moving axially through the sensor a series of phantom experiments were designed. Phantoms are objects of known dimensions that simulate a desired process or system. A triple plane ECT sensor was used comprising a polyether ether ketone (PEEK) cylinder of inner diameter 156 mm with three planes of eight electrodes implanted to the outside of the wall and encased in stainless steel. A cylinder-in-tube PE phantom was used to simulate the interface. The PE tube had diameter 142 mm with an annular core of diameter 30 mm, tube wall thickness 62 mm and length 300 mm. The PE cylinder was 30 mm in diameter and 300 mm long with a fl anged base having a diameter of 160 mm. The schematics for these phantoms are given in Figure 1.
The small cylinder (Figure 1(b)) and sensor were raised above the large tube (Figure 1(a)) and imaged at penetration intervals of 1/
8 of the length of the
small cylinder. Once the whole of the large tube had been removed, the sensor was imaging just the small cylinder with a large air gap between the sensor wall
Fig. 1. Schematics for cylinder-in-tube phantom experiments: (a) thick-walled PE tube showing annulus; (b) PE cylinder with
fl ange base
160 mm 140 mm
40 mm
300 mm
160 mm
40 mm
300 mm
and the phantom. The 1/
8 penetration intervals were
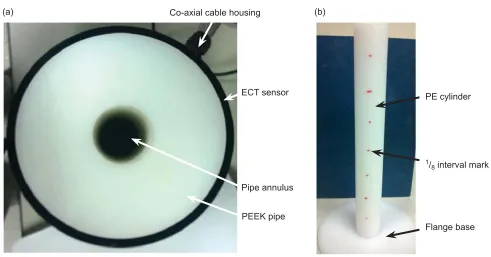
measured and marked onto the polyethylene cylinder shown in Figure 2(b).
Figure 2(a) shows the large tube housed within the
PEEK-lined ECT sensor. There is an air gap of 1 mm between the PE large tube and the wall of the sensor. As this is present during the sensor calibration it has no impact on the reconstructed ECT data. The 1/
8 intervals
of the length of the small cylinder at which the large tube was imaged are shown in Figure 2(b) as markings on the small cylinder.
2.2 ECT Setup and Confi guration
The ECT instrument used for this work was an Industrial Tomography Systems (ITS) m3c 24 input channel unit. Individual electrodes were connected from the sensor to the instrument ports using Bayonet Neill-Concelman (BNC) cables. The fi rst step in processing of electrical
tomography data is normalisation of the capacitance data according to Equation (iv):
Where Cnand C are the normalised and measured capacitance values respectively, and Ch and Cl are capacitance values from the high permittivity and low permittivity reference frames respectively. The reference frames are taken prior to measurement and for both experimental series the conditions for these are given in Table I.
The low permittivity reference frame is taken prior to the high permittivity reference frame and once both are acquired process data can be recorded. The phantom experiment was imaged for 30 frames at each of the large tube holding intervals thus building a series of images of penetration depth of the small cylinder.
Fig. 2. Individual components of cylinder-in-tube phantom: (a) thick-walled PE tube within PEEK-lined ECT sensor; (b) 40 mm diameter PE cylinder with fl anged base
Co-axial cable housing
ECT sensor
Pipe annulus
PEEK pipe
PE cylinder
1/
8 interval mark
Flange base
(a) (b)
Table I High and Low Permittivity Refer ence Frames: Material Properties for Both Phantom and Drying Bed Experimental Series
Experimental series High permittivity reference frame
a Low permittivity reference framea
material r material r
Phantom PE 2.2–2.4 Air 1.5
a
r = Relative permittivity
Cn = C– Cl
A reconstruction algorithm is required to calculate the spatially resolved material data from electrical boundary measurements. In commercial ECT equipment there has previously been just one algorithm available to use: the LBP algorithm. This is a single-step algorithm that requires less computing power due to its simplicity and delivers fast results; however the reconstructed images are inaccurate (5). It assumes a linear relationship between the capacitance and permittivity vectors as given in Equation (v):
where g is the normalised permittivity vector, ಓ is the normalised capacitance vector and ST is a linear approximation to the inverse of the sensitivity matrix,
S (20). This equation is solved by discretisation across a pixel grid containing 1024 pixels that is reduced to 812 pixels as the corners are fi lleted for circular images. Although LBP has several drawbacks, it is the most commonly used method in industry and is therefore used for reconstructing data within this paper.
2.3 3D-ECT Tomogram Image Processing
A true 3D-ECT measurement acquires charge data in both the radial and axial direction for each stimulus, yielding an output of a 3D tomogram composed of 32 × 32 × 32 voxels (corresponding to pixels in 3D space). Each voxel represents a volume portion within the sensor and is assigned a value in the interval between 0 and 1. In order to identify the geometrical shape placed in the sensor, a binary gating method is applied. This method, widely applied in MRI and in 2D-ECT, consists of dividing the tomogram into a number of zones equivalent to the number of phases. In this study one zone represents the volume occupied by the phantom and the second is composed of the surrounding gas phase (5). Once the image has been thresholded it is possible to compare it with a previously built reference to evaluate the image error. The advantage of using phantoms is that their exact geometry is known and therefore a digitalised reference image as basis for comparison for error analysis is accurate and simple to construct.
The data processing methods applied in the refi nement of 2D images have been applied also to the 3D-ECT tomogram analysis. The objective of the gating method is to fi nd the optimum threshold value to allow generation of the binary matrix that describes the object with the minimum error. A reference image
has been created to allow the comparison between the reconstructed tomograms and the real object, this image is given in Figure 3.
The PbP approach, defi ned as voxel-by-voxel in 3D tomography, compares the corresponding voxels in the reconstructed and in the theoretical images
(Figure 3) and is described by the same equation
as PbP analysis (Equation (i)). The areal approach (Equations (ii) and (iii)) is extended to the third dimension by evaluating the volume occupied by the phantom in the image, Equation (vi):
where Vimage is the volume of the image and VC is the total volume of the sensor chamber. The volumetric error is calculated by evaluating the ratio of the difference between the volumes of the imaged and the real object and the volume of the real object, Equation (vii):
where ev is the image error calculated using the volumetric-areal approach and Vphanton is the volume of the phantom.
Fig. 3. Pixelated refer ence image of fully withdrawn PE cylinder from PE tube for comparison in voxel-by-voxel analysis
g = STλ (v)
Vimage = VC
μimage
N μimage<t (vi)
ev =
Vimage– Vphantom
3 Results and Discussion
The phantom experiments use PE, with a low relative permittivity, to simulate an interface so the 3D-ECT reconstruction can be trialled using the basic LBP algorithm to ascertain its effi cacy before application to high di-electric media. Therefore these experiments are used solely to examine whether 3D-ECT is capable of monitoring an interface.
3.1 3D-ECT Reconstruction using LBP
The ECT three-plane sensor is attached to the fl anged base of the small cylinder therefore the phantom is defi ned as the large tube being inserted into the sensor
with the PE/air interface being the top of the PE large tube. The tomograms are shown in Figure 4.
The images displayed in Figure 4 are cross-section tomograms whereby the electrode measurements from the three planes of uniform electrodes are reconstructed and subsequently discretised to give 16 image planes. In pseudo-3D tomography this form of image is strongly discouraged as the lack of axial inter-electrode capacitance data nullifi es any assumptions required to use an inter-plane interpolation approach. This is not the case in 3D-ECT as inter-electrode capacitances on different planes have been measured. Figure 4(a) shows the system at full immersion, that is to say the small cylinder is fully
Fig. 4. Cross-section s liced 3D tomograms of cylinder-in-tube phantom experiment: (a) fully immersed phantom; (b) 7/ 8
immersed; (c) 3/
4 immersed; (d) 5/8 immersed; (e) 1/2 immersed; (f) 3/8 immersed; (g) 1/4 immersed; (h) 1/8 immersed; (i) fully
withdrawn
0 0.25 0.5 0.75 1.0 Relative permittivity
(a) (b) (c)
(d) (e) (f)
immersed in the large tube. The colour scheme of these charts indicate low permittivity regions as being blue and high permittivity regions as being red, however the corners of the square pixel grid are included in these reconstructed images and coloured blue. These pixels are present in all the cross-section slice tomograms, however they are not representative of the circular sensor (in 2D-ECT these are typically removed from the image) and are therefore excised from all analyses.
The large tube is withdrawn from the ECT sensor at intervals of 1/
8 penetration. It can be seen in Figure 4(b)
that a reduction in the mean conductivity across the electrode plane occurs and continues through the other images within Figure 4 as the phantom moves through the sensor. The small cylinder is present inside the cylinder at all times even as the large tube is removed from the sensing zone. The fi rst evidence of the presence of the small cylinder phantom is in Figure 4(e)
where a series of voxels in the centre of the top cross-section planes of the 3D image register an increase in the permittivity. Moving from Figure 4(e)
to Figure 4(h) it is clear this area of high permittivity
spreads down the 3D tomograms in this series. This has to be attributed to the presence of the small cylinder in the centre of the sensor, however the shape of the high permittivity region is not clear which is unsurprising given that the air gap between the cylinder and the sensor wall is 51 mm. The air gap affects the linearity assumption used in the sensitivity matrix. However, it is surprising that the small cylinder is affecting the inter-electrode electric fi eld given the size of this air gap. The images given in Figure 4 have been smoothed to a high degree that gives the impression of soft edges in the process.
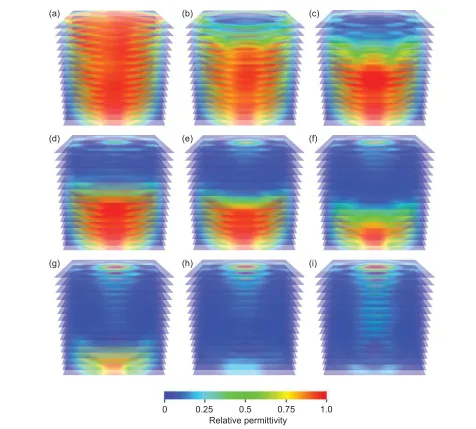
To better represent the interface between low and high permittivity phases iso-surface plots of the same experiment are presented in Figure 5. Iso-surface plots were calculated from volumetric data (given in
Figure 4) and represent constant scalar data within
a scalar 3D distribution. In the case of the phantom experiments this is represented as the interface between PE and air. Initially, in Figure 5(a), the sensor was at the equivalent of a high permittivity reference frame as the large tube was fully immersed in the sensor. The four rectangular regions at the sensor boundary are image artefacts and enclose the high permittivity region; they are able to be excised from the images but have been retained to give clarity as regards to the phase distribution. As the large PE tube was removed from the sensor the interface
was clearly shown to progress down the sensor.
Figure 5(d) shows the presence of the small cylinder
at the top of the image, indicating that although the large tube was 5/
8 immersed in the sensor and the
small cylinder occupied the centre of the void behind the interface, it was not clearly detected by the sensor.
When the large tube reached 1/
4 immersed
(Figure 5(g)) the small tube was imaged as a rounded
cone and the interface of the large tube and air was clearly present at the bottom of the sensor. The imaged shape of the small cylinder was consistent from
Figure 5(e) to Figure 5(h) and was only imaged as
a cylinder once the large tube was fully removed from the sensor in Figure 5(i). This result is symptomatic of a number of limitations of the technique in its current state: the limit of the software to drive a maximum of three planes; the reconstruction algorithm when imaging hard boundaries; and the low permittivity ratio between the two phases (air = 1,PE = 2.3). ECT therefore images the permittivity difference between phases by keeping this difference high and the ability of the instrument to detect a hard boundary theoretically increases.
3.2 Binary Image Refi nement of 3D-ECT
Tomograms
Following on from the evaluation of accuracy of 2D-ECT tomograms, a similar error analysis has been applied to the cylinder-in-tube experiment. The reference image for the voxel-by-voxel analysis was shown in Figure 3. The voxel values are extracted from the tomographic data and processed using MATLAB®
(MathWorks® Inc). The voxel-by-voxel error and the
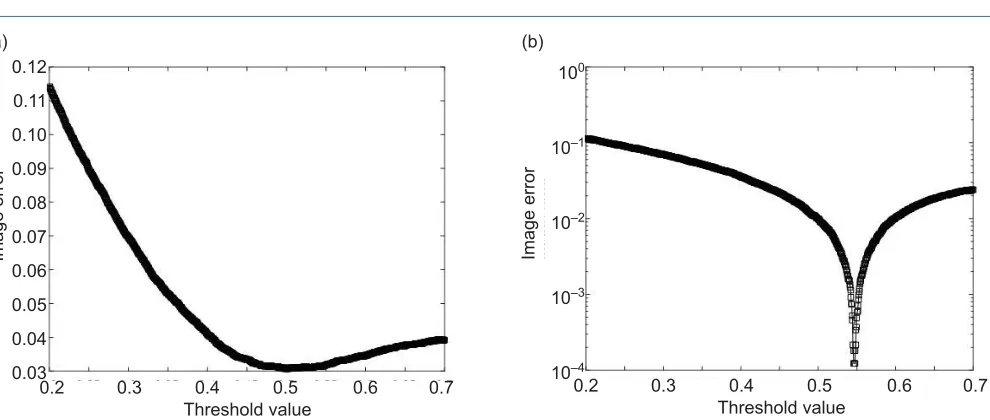
volumetric error are calculated for several values in the interval between 0.2 and 0.7 in order to evaluate the optimal value in terms of minimum error.
As shown in Figure 6 in both cases it is possible to reach very low errors and the optimum threshold value does not change substantially. It is 0.501 according to the voxel-by-voxel analysis (Figure 6(a)) and 0.547 by applying the volumetric analysis (Figure 6(b)). This characteristic is an important sign of the robustness of the reconstruction and leads to the conclusion that the results do not change substantially if the threshold value is fi xed for either error analysis methodology. In fact, using the voxel-by-voxel method to compare the errors when choosing the threshold value at the minimum of
Figure 6(a) and Figure 6(b), gives values of 0.0306
Fig. 5. Iso-surface plots of PE cylinder-in-tube phantoms: (a) fully immersed large tube phantom; (b) 7/
8 immersed; (c) 3/4
immersed; (d) 5/
8 immersed; (e) 1/2 immersed; (f) 3/8 immersed; (g) 1/4 immersed; (h) 1/8 immersed; (i) fully withdrawn
(a) (b) (c)
(d) (e) (f)
(g) (h) (i)
Fig. 6. Binary sensitivity to thresholds of 3D-ECT tomograms ofpolymethyl methacrylate (PMMA) cylinders: (a) voxel-by-voxel error analysis; (b) volumetric analysis
Image error Image error
0.12
0.11
0.10
0.09
0.08
0.07
0.06
0.05
0.04
0.03
100
10–1
10–2
10–3
10–4
0.2 0.3 0.4 0.5 0.6 0.7 Threshold value
0.2 0.3 0.4 0.5 0.6 0.7 Threshold value
analysis does not need precise geometric information relative to the position of the phantom or objects within the sensor.
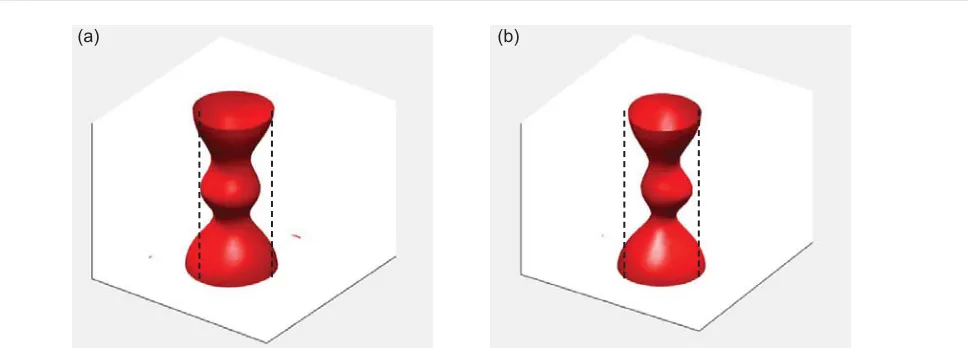
In Figure 7 the iso-surface plots display the
reconstructed interface between the phantom and the gas phase using the threshold value suggested by the voxel-by-voxel analysis (Figure 7(a)) and the volumetric analysis (Figure 7(b)).
The obtained images from both analyses are very similar with both unable to display a geometric cylindrical shape, a limitation of the spatial resolution provided by single-step reconstruction algorithms. The permittivity difference between the air and PE is approximately two thereby reducing the SNR of the measurement and leading to lower image accuracy. The data post-processing improves the image accuracy as the images in Figure 7 represent the cylindrical phantom more closely than those in Figure 5(i). To reduce image error the two available options with the current ECT instrumentation are to use an alternative reconstruction algorithm or to improve the phase permittivity difference.
4 Conclusions
This paper examines recent innovations in the fi eld of 3D electrical capacitance tomography and the application to 3D-ECT of previously used 2D-ECT post-processing methods that improve tomogram accuracy of imaged geometric phantoms. Firstly, development work of the data processing techniques applied to 2D-ECT was examined and shown to be effective, then using a similar phantom system the 3D-ECT method was used to acquire
3D tomograms and a similar analysis was adopted. It has been shown that commercially available ECT equipment has the capability to image a mobile object and yield information on the location of a hard boundary in 3D space.
The images were optimised using a previously published method whereby the threshold value of the image was optimised by correlation with image error. A voxel-by-voxel approach to calculating image error was compared with a volumetric approach demonstrating the robustness of the latter as it does not require precise geometric information to provide improved tomographic accuracy. The image accuracy of ECT is a function of the spatial resolution that is dependent upon both the software (reconstruction algorithm and data processing) and hardware (electrodes and data acquisition system (DAS)) used in the measurement. When these are improved the quality of the reconstructed images improves thereby making this method more applicable to chemical processes.
5 Acknowledgements
Peter Clark was an Engineering Doctorate (EngD) student and Giuseppe Forte is a current EngD student, both at the University of Birmingham, UK, and funded jointly by Johnson Matthey and the Engineering & Physical Sciences Research Council (EPSRC) UK.
The authors would like to thank Dr Phil Robbins, Director of Studies at the University of Birmingham, for his contributions to the binary optimisation techniques and Dr Kent Wei of Industrial Tomography Systems Plc, UK, for his assistance in data acquisition and processing.
Fig. 7. 3D-ECT iso-surface plots with applied optimal threshold value and dashed lines showing object location: (a) voxel-by-voxel threshold value = 0.501; (b) volumetric threshold value = 0.547
References
1. L. Peng, C. Mou, D. Yao, B. Zhang and D. Xiao, Flow
Meas. Instrum., 2005, 16, (2–3), 169
2. H. Xu, G. Yang and S. Wang, ‘Effect of Axial Guard Electrodes on Sensing Field of Capacitance Tomographic Sensor’, in “Proceedings of 1st World Congress on Industrial Process Tomography”, Buxton, UK, 14th–17th April, 1999, pp. 348–352
3. A. J. Jaworski and G. T. Bolton, Meas. Sci. Technol.,
2000, 11, (6), 743
4. M. Hamidipour and F. Larachi, Chem. Eng. J., 2010,
165, (1), 310
5. P. J. Clark, A. N. Tsoligkas, M. J. H. Simmons, P. T.
Robbins and E. H. Stitt, Meas. Sci. Technol., 2016, 27,
(2), 025401
6. P. J. Clark, A. N. Tsoligkas, M. J. H. Simmons, S. Blackburn and H. Stitt, ‘Detection of Phase and Other Sharp Boundaries using Electrical Capacitance Tomography’ in “Proceedings of 7th World Congress on Industrial Process Tomography”, Krakow, Poland, 2nd–5th September, 2013, pp. 799–808
7. E. Al Hosani, M. Zhang and M. Soleimani, IEEE Sens.
J., 2015, 15, (11),6089
8. M. Evangelidis, L. Ma and M. Soleimani, ‘Pipeline Inspection Using High Resolution Electrical Capacitance Tomography’, in ‘Proceedings of 7th World Congress on Industrial Process Tomography’, Krakow, Poland, 2nd–5th September, 2013, pp. 556
9. R. Wajman, R. Banasiak, L. Mazurkiewicz, T.
Dyakowski and D. Sankowski, Meas. Sci. Technol.,
2006, 17, (8), 2113
10. V. Rimpiläinen, L. M. Heikkinen and M. Vauhkonen,
Chem. Eng. Sci., 2012, 75, 220
11. W. Warsito and L.-S. Fan, Chem. Eng. Proc.: Proc.
Intens., 2003, 42, (8–9), 663
12. W. Warsito and L.-S. Fan, ‘Development of 3-Dimensional Electrical Capacitance Tomography Based on Neural Network Multi-Criterion Optimization Image Reconstruction’, in “Proceedings of 3rd World Congress on Industrial Process Tomography”, Banff, Canada, 2nd–5th September, 2003, pp. 391–396
13. W. Warsito and L.-S. Fan, Chem. Eng. Sci., 2005,60,
(22), 6073
14. T. C. Chandrasekera, A. Wang, D. J. Holland, Q. Marashdeh, M. Pore, F. Wang, A. J. Sederman, L. S.
Fan, L. F. Gladden and J. S. Dennis, Powder Technol.,
2012, 227, 86
15. M. Soleimani, C. N. Mitchell, R. Banasiak, R. Wajman
and A. Adler, Prog. Electromagn. Res., 2009, 90, 171
16. R. Banasiak, R. Wajman, D. Sankowski and M.
Soleimani, Prog. Electromagn. Res., 2010, 100, 219
17. Z. Ye, H. Y. Wei and M. Soleimani, Measurement,
2015, 61, 270
18. P. J. Clark, N. P. Ramskill, M. J. Simmons, A. York, L. F. Gladden and E. H. Stitt, ‘Validation of Electrical Capacitance Tomography Drying Measurements using Magnetic Resonance Imaging’, in 7th International Symposium on Process Tomography, Dresden, Germany, 1st–3rd September, 2015
19. K. Wei, C. Qiu, M. Soleimani and K. Primrose, Flow
Meas. Instrum., 2015, 46, (Part B), 292
20. W. Q. Yang and L. Peng, Meas. Sci. Technol., 2003,
14, (1), R1
The Authors
Peter Clark is a Process Engineer working at Johnson Matthey within Platinum Group Metal Services. Peter obtained a MEng (Hons) in Chemical Engineering at the University of Birmingham, UK, and then undertook an Engineering Doctorate within the Johnson Matthey Technology Centre, Chilton, UK, where he applied advanced characterisation tools, including but not exclusively process tomography, to a range of chemical engineering applications.
Professor Mark Simmons is Professor of Fluid Mechanics and Head of the School of Chemical Engineering at the University of Birmingham. His research interests encompass how fl ows can be utilised or exploited in processes which are used to manufacture complex multiphase products, including catalysts, foods and fast moving consumer goods (e.g. shampoos, detergents). He has applied his expertise in fl ow measurement, sensing and rheology in a variety of projects funded by EPSRC, Biotechnology and Biological Sciences Research Council (BBSRC) and industry: notably Johnson Matthey, Unilever and Rolls-Royce. Professor Simmons is a Fellow of the Institution of Chemical Engineers, has published over 100 peer-reviewed papers and has graduated over 32 PhD and EngD students.