Title
Effects of dope sonication and hydrophilic polymer addition on the properties of low pressure
PVDF mixed matrix membranes
Authors
Ikechukwu A. Ikea*; Ludovic F. Duméeb; Andrew Grotha, John D. Orbella; Mikel Dukea
a Institute for Sustainability and Innovation, College of Engineering and Science, Victoria
University, Melbourne, Victoria 8001, Australia.
b Deakin University, Institute for Frontier Materials, Pigdons road, Waurn Ponds, Victoria 3216,
Australia.
*Corresponding author: mikel.duke@vu.edu.au (M. Duke), Tel.: +61 3 99197682; fax: +61 3
99197696
Abstract
Mixed matrix membranes (MMM) made from hydrophilic fillers incorporated into poly (vinylidene
fluoride) (PVDF) are well known to have improved membrane properties and durability. However,
the contributions from two key steps in MMM fabrication: dope sonication and the addition of a
hydrophilic polymer like poly (vinylpyrrolidone) (PVP), have not been sufficiently highlighted. In
this work, a range of MMM were made by extended dope sonication and stepwise PVP addition.
The results showed that PVP, popularly referred to as a ‘pore former’, was surprisingly not
responsible for pore formation but functioned rather as a ‘pore connector’ and as an aid to particle
dispersion. While dope sonication resulted in efficient particle dispersion as may be expected, it did
not improve membrane surface wettability as the hydrophilic nanoparticles were completely locked
within the hydrophobic PVDF matrix. Sonication resulted in significant reduction in membrane
porosity but did not change the membrane thermal stability. The addition of PVP, however, significantly reduced thermal stability as well as the PVDF β-phase mass fraction. The results of this study provide valuable insights to the effects of dope sonication and PVP addition for
manufacturers and researchers developing low pressure membranes for water treatment
applications.
Keywords
2 1. Introduction
Poly (vinylidene fluoride) (PVDF) membranes are widely used in water treatment and separation
processes. The popularity of these materials derives much from their relatively good chemical,
thermal and mechanical stability [1, 2]. Furthermore, these polymers can be readily processed into
porous membranes for applications as diverse as membrane distillation, membrane bioreactor and
for direct drinking water treatment and waste water reclamation [1]. Their wide commercial
fabrication and application supports ongoing research improvements [1].
PVDF is natively hydrophobic evident from its low critical surface tension (25-28.5 dynes/cm) [2]
resulting in reduced water flux and higher membrane fouling [3] when applied in water treatment in
comparison to less hydrophobic materials such as polyacrylonitrile (critical surface tension 44
dynes/cm [2]). Significant research efforts have been committed towards improving the filtration
performance of PVDF membranes by chemical coating, plasma treatment, polymer grafting,
organic and inorganic nanoparticles blending [4-6]. Direct blending of preformed inorganic
nanoparticles has received significant attention in recent times as a convenient, low cost, scalable
and effective means to improve the filtration performance of hydrophobic polymeric membranes [2,
4, 5, 7].
When inorganic nanoparticles are incorporated into polymeric membranes to give mixed matrix
membrane (MMM), it is critical that the filler particles are properly dispersed in the polymer matrix
for optimal membrane performance. One common method of achieving good particle dispersion is
the application of sonication. Sonication can be applied to the solvent as well as to the dope in order
to achieve good dispersion of large amount of filler in the membrane [8, 9]. Another feature of
producing high quality MMMs is the addition of a hydrophilic polymer such as poly
(vinylpyrrolidone) (PVP) as a pore former [9-12]. Despite the use of these two techniques for
controlling performance of the PVDF membrane, a systematic investigation into their individual
roles in MMM formation, rather than merely introducing them as constant preparatory recipes such
as were done by Rajabi et. al [9], Liang et. al [13] and Zhang et. al [14] has not been conducted. A
better understanding of the individual effects of PVP addition and dope sonication may result in the
advancement of MMM design and optimization, benefitting commercial water treatment practice.
This work explores the independent effects of dope sonication and the addition of PVP using silica
coated iron oxide nanoparticles as the inorganic phase to advance knowledge in the design and
fabrication of MMM for water treatment applications. Iron oxide nanoparticle (IO) was chosen for
this study because of its low cost, biocompatibility, biodegradation and magnetic properties which
allows for interesting magnetic functionalisations for enhancing membrane performance [15-18]. In
co-3
precipitation or reversed co-precipitation methods [19-21] with the further ease of magnetic
separation from experimental suspension. However, due to IO significant absorptive capacity for
natural organic matter and other common pollutants in water [22-25], the long term stability of an
IO functionalised membrane under practical fouling conditions is questionable [26]. Consequently,
surface coating with silica to produce more hydrophilic silica coated IO (SIO) with less affinity for
pollutants was undertaken [27-29]. The hydrophilicity of silica is the result of the abundance of
hydroxyl groups on the material surface. In addition, due to the high free surface energy of silica
and the abundance of silanol (Si-OH) groups supplying hydrogen bonding, water molecules are
easily adsorbed and these, in combination with the silanol groups, enhances the hydrophilicity of
silica materials [30-32].
Although the in-situ generation of nanoparticles aimed at reducing agglomeration has been the
focus of a number of recent reports [33-35], the choice of using the classical addition of preformed
nanoparticles in this work stem from a number of reasons one of which is the simplicity of the
latter. Another reason is the need to avoid undue interference from the complex chemical and
physical interactions that may occur during in-situ nanoparticle generation. Furthermore, in-situ
nanoparticles generation is more restrictive in the choice of nanoparticles, polymer and solvent that
are applicable and it may be less amenable to certain hierarchical or layered nanoparticles
modification such as membrane modification with silica coated iron oxide as reported in this work.
Consequently, the classical addition of preformed nanoparticles remains a more general method for
producing and studying MMM. Another reason, peculiar to this work, for choosing the classical
method is that the addition of preformed, neat inorganic nanoparticles to a hydrophobic polymer
base is prone to poor nanoparticle dispersion [33], and is therefore suitable for the study of the
problem of agglomeration. Nevertheless, since addition of a pore former [34] and effective
dispersion of the polymer and the precursor in solvent media [33] are important for producing
integral membranes by in-situ nanoparticles generation, the results of this study is relevant to both
methods of nanoparticle incorporation.
It may be stated at this point that this research is exploratory in its aim rather than practical in the
sense that the outline and extent of phenomena/processes are sought rather than their optimal
performance conditions. Initial comprehensive development of the outline of phenomena is crucial
for further optimisation of process conditions. The research effort so far in the field of membrane
technology has been focused almost exclusively on optimising process conditions and analysing
novel additives that the full independent import of certain routine recipes were left largely
unexplored. This report intends to bridge this critical knowledge gap to provide more control for
4 2. Experimental
2.1. Materials
Iron (II) chloride from Ajax Chemical, ammonia solution (25% v/v) from Merck, tetraethyl
orthosilicate (TEOS) from Sigma, and analytical grade absolute ethanol were used for nanoparticle
synthesis. Solef 1015 PVDF from Solvay and Polyvinylpyrrolidone (PVP), MW 40,000 g/mol, from
Sigma were dried at 60 oC for the membrane fabrications. 1-methyl-2-pyrrilidonone (NMP) from
SigmaAldrich was used as solvent for the dissolution of the polymers. Analytical grade sodium
chloride (NaCl) and poly (oxyethylene) (20) sorbitanmonolaurate (Tween 20), and commercial
sunflower oil were used for emulsion preparation. Milli-QTM (type 1) water was used for all
chemical synthesis while oil-water emulsion production and all filtration test utilised ElixTM (type
2) water both from a commercial Merck Millipore Integrated Water Purification System. Elix water
had a conductivity of 6.3 µS/cm and no particle was detected when analysed by the dynamic light
scattering (DLS) technique using Malvern zetasizer nano ZS.
2.2. Particle synthesis
IO were produced by the co-precipitation method from Iron (II) chloride precursor and ammonia
solution following the method of Mahmed et al [21] with a slight modification. Briefly, iron (II)
chloride was transferred into vigorously boiling Milli-Q water at atmospheric pressure. The system
was heated and magnetically stirred over a hot plate. After dissolution of the iron (II) chloride,
ammonia solution was added drop wise resulting in the precipitation of IO which was aged for 6
hours with continuous stirring and boiling. Subsequently, the precipitate was washed in Elix water
and was magnetically separated from the washing liquid to give black IO particles. For the purpose
of silica coating to make SIO particles, the washed precipitate was transferred into a large conical
flask holding a mixture of ethanol, TEOS, ammonia solution and Milli-Q water following a
modified sol-gel process [36]. The suspension was stirred vigorously using an overhead stirrer at
room temperature for 24 h. Thereafter, the magnetic nanoparticles were separated with a bar
magnet, washed, dried at 60°C and then crushed to fine powder to give SIO nanoparticles.
2.3 Particle characterisation
The synthesized nanoparticles were analyzed by X-ray diffraction (XRD), attenuated total
reflectance Fourier transform infra-red (ATR-FTIR) spectroscopy and N2 porosimetry. XRD studies
were conducted using Panalytical X’pert Powder XRD diffractometer operated at 45 kV and 30 mA
and was employed to define the crystalline phase of the produced particles. Based on the XRD data,
the crystallite size of the IO particles was estimated using the Scherrer equation [21]:
5
where 𝜏𝜏 is the crystallite size, 𝜆𝜆 is the X-ray wavelength (1.5406 Å), 𝛽𝛽 the line broadening at half
the maximum intensity (FWHM) and 𝜃𝜃 the Bragg angle. ATR-FTIR analysis was conducted using
Perkin Elmer FTIR Spectrometer with Universal ATR Diamond/ZnSe crystals operated at an
accumulation of 16 scans and at a resolution of 4 cm-1 to identify the presence of the silica coating.
Particle size characterization was conducted via N2 porosimetry to determine Brunauer Emmett
Teller (BET) specific surface area from which the particle size was calculated using the following
expression [37, 38].
𝑑𝑑 =6000𝑆𝑆×𝜌𝜌 2
where d is the average particles diameter (nm), S the particles BET surface area (m2/g) and ρ
particles’ density (g/cm3). The derivation of Equation 2 is provided in the Supplementary Material.
The bulk density of magnetite, 5.1 g/cm3, was used as representative of IO and SIO powders in this
analysis, assuming a thin silica coating. BET measurements were conducted using Micrometrics
TriStar Surface Area and Porosity Analyser with TriStar 3000 version 6.04 analysis software.
Powders were degassed at 150 °C for 24 h for the analysis.
2.4. Membrane fabrication
Membranes were made by the well-known NIPS procedure with addition of inorganic fillers
following a slight modification of the procedures published by Rajabi et al [9] and Lai et al. [39].
Four sets of PVDF MMM, named P0, P21, P48 and Sonic, were fabricated by dissolving separately
3.75 g of PVDF powder in NMP. Various weight percent (wt.%) of SIO fillers with respect to the
mass of the PVDF were added to the dissolved polymer after the particles were sonicated in NMP
for 1 h using a probe-type sonicator (Hielscher Ultrasonic Processor UP400S) operated at an
effective power of ~10 W and working frequency of 24 kHz. The compositions of the membranes
for each set are given in Table 1. The mass of NMP used as solvent for each membrane was
approximately 5 times the total mass of solids (PVDF + SIO + PVP). This scheme of variable
solvent amount was adopted in view of the large variation in the amount of added solids in order to
eliminate any potential effect of solvent concentration on the properties of the membranes. Using a
fixed amount of solvent was such that some dope would not form membrane either due to too much
solvent or too little solvent. For the P21 and P48 sets, 0.8 g and 1.8 g of PVP was added to the
PVDF powder respectively, and stirred to dissolution at room temperature using an overhead stirrer
before the addition of the sonicated nanoparticles after which stirring was continued until the dope
appeared homogenous. The dopes were degased by connecting the flask to a vacuum pump until
bubbles had noticeably disappeared. The P0 membranes were subjected to a similar treatment as
6
particle aggregation that resulted in visible tear of the membrane during casting, membranes with
filler >10 wt.% were not synthesized for the P0 set. For the Sonic set, no PVP was added to the
PVDF powder. Fillers were sonicated in NMP for 1 h before PVDF powder was added and
sonication was continued. At intervals of 45 min, sonication was stopped and the dope stirred by
hand after which sonication was continued. This process was terminated when the dope appeared
homogeneous and free of bubbles. Clear dopes after standing for at least 1 h were cast on glass
plates and underwent phase inversion in Elixwater at room temperature. After phase inversion,
membranes were left in fresh Elix water for 24 h at room temperature before they were removed
and stored wet at 4 °C.
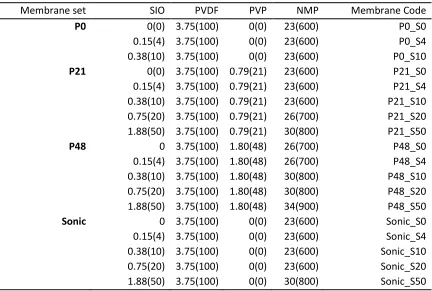
Table 1. Membrane compositions,g (wt.% with respect to the mass of PVDF).
Membrane set SIO PVDF PVP NMP Membrane Code
P0 0(0) 3.75(100) 0(0) 23(600) P0_S0
0.15(4) 3.75(100) 0(0) 23(600) P0_S4
0.38(10) 3.75(100) 0(0) 23(600) P0_S10
P21 0(0) 3.75(100) 0.79(21) 23(600) P21_S0
0.15(4) 3.75(100) 0.79(21) 23(600) P21_S4 0.38(10) 3.75(100) 0.79(21) 23(600) P21_S10 0.75(20) 3.75(100) 0.79(21) 26(700) P21_S20 1.88(50) 3.75(100) 0.79(21) 30(800) P21_S50
P48 0 3.75(100) 1.80(48) 26(700) P48_S0
0.15(4) 3.75(100) 1.80(48) 26(700) P48_S4 0.38(10) 3.75(100) 1.80(48) 30(800) P48_S10 0.75(20) 3.75(100) 1.80(48) 30(800) P48_S20 1.88(50) 3.75(100) 1.80(48) 34(900) P48_S50
Sonic 0 3.75(100) 0(0) 23(600) Sonic_S0
0.15(4) 3.75(100) 0(0) 23(600) Sonic_S4 0.38(10) 3.75(100) 0(0) 23(600) Sonic_S10 0.75(20) 3.75(100) 0(0) 23(600) Sonic_S20 1.88(50) 3.75(100) 0(0) 30(800) Sonic_S50
2.5 Membrane characterisation
Particle dispersion in the MMM was evaluated by optical and scanning electron microscopy (SEM).
For optical microscopy a small rectangular piece of each membrane was placed on a microscope
slide and imaged using Carl Zeiss Axioplan 2 optical microscope in transmission mode using a
fixed scanning objective lens (4x). For SEM, a FEI Quanta 3D FEG electron microscope was used
to observe the material microstructure at 20 kV. Cross-sectional images of membranes were
7
immersion in liquid nitrogen. All membranes were gold coated before imaging. Polymer crystalline
phase was studied by FTIR analysis under conditions already specified (Section 2.3) on samples
that were dried by exposure to ambient laboratory conditions. A quantitative estimation of the mass fraction of the β phase with respect to the α phase from the characteristic band of 763 and 840 cm-1 for α and β phases respectively was computed using [40]:
𝐹𝐹(𝛽𝛽) = 𝐴𝐴𝛽𝛽
1.26𝐴𝐴𝛼𝛼+𝐴𝐴𝛽𝛽 3
where 𝐹𝐹(𝛽𝛽)is the mass fraction of β phase in a sample of PVDF polymer and 𝐴𝐴𝛼𝛼 and 𝐴𝐴𝛽𝛽 are
absorption peaks height of the α and β phases corresponding to the characteristics wavenumbers of
763 and 840 cm-1 respectively. Thermal gravimetric analysis (TGA) was performed with Mettler
Toledo Thermal Analyser TGA/DSC 1 STARe System under nitrogen flow of 20 mL/min and
steady temperature increment of 10 °C/min until a temperature of 700 °C was reached. To
determine the concentration of pores on the skin layer or membrane surface porosity defined as the
total area of the surface pores detectable on a membrane skin layer divided by the membrane area,
the SEM images of the membrane skin layers were processed using ImageJ
(https://imagej.nih.gov/ij/). Bulk porosities (𝜀𝜀) for filler-free membranes were computed using the
following expressions [41]:
𝜀𝜀= 𝑀𝑀𝑤𝑤−𝑀𝑀𝑑𝑑
(𝑀𝑀𝑤𝑤−𝑀𝑀𝑑𝑑)+𝑀𝑀𝑑𝑑�𝜌𝜌𝑃𝑃
4
where Mwis the mass of a wet piece of membrane (after all surface water was removed using a
paper towel), Md is the mass of the same piece of membrane after drying at 60 °C for 24 h and ρP is
the density of PVDF (1.78 g/cm3) and the density of water was assumed to be 1 g/cm3[41]. N2
porosimetry analysis was conducted as specified in Section 2.3 except that each sample was
degassed at 90 °C for 24 h before analysis.
Membrane contact angles (CA) were measured using Krüss drop shape analyser – DSA25 under
room temperature of 20 °C using PTFE needle of diameter 0.69 mm. 4.0 µL droplet volume was
placed on a membrane and the CA computed using the Young Laplace fitting method. About 10 cm
long strip of each membrane was used for the wettability experiment with at least five CA
measurements taken along each strip and the results averaged. A dead end filtration test to evaluate
the membrane integrity and filtration performance was conducted using Polypropylene In-Line
holder (PP47) from Adventec as membrane module. A FMI “Q” pump (QG20) from Cerampump
operated at a constant flux of 96 Lm-2h-1 was used for the test. Transmembrane pressure was
measured using logged TPI665 digital manometer. The filtration test cycles involve membrane
compression to 180 kPa for 10 min by filtering with clean water, and then clean water ‘pre-fouling’
8
for 40 min. After each emulsion filtration, the membrane was removed from the module and the
membrane selective surface was rinsed under flowing tap water to remove reversible foulants.
Before returning the membrane to the module for the ‘post-fouling’ water permeation, the module
was rinsed with water, 0.1 M NaOH solution and water consecutively; each rinsing lasting for a
period of 40 min to remove any oil residue. The oil emulsion used as fouling solution was produced
by homogenising 0.5 g sunflower oil and 0.1 g Tween 20 and in 1 litre of Elix water using a
Unidrive X 1000 homogeniser operated at 17,500 rpm for 30 minutes [42]. Oil droplet size was
measured by the DLS technique using Malvern zetasizer nano ZS. Membrane rejection was
evaluated based on turbidity reduction as measured by Hanna Instruments Turbidimeter.
3. Results and Discussion
3.1 Particle characterisation
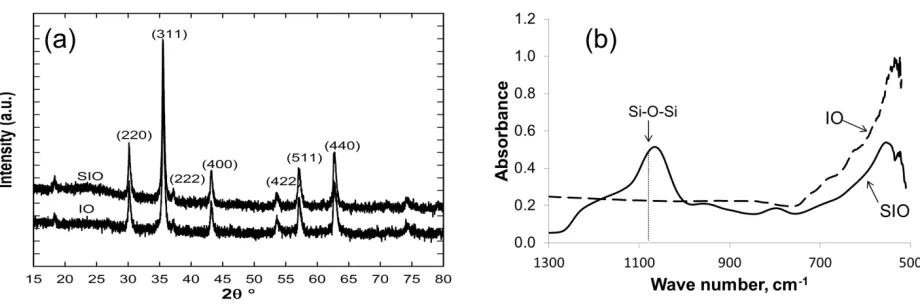
The XRD patterns for the IO and SIO powders are shown in Figure 1a. These patterns show well
developed standard Bragg peaks for magnetite (Fe3O4) or maghemite (γ-Fe2O3) at 2θ values of 30°
(220), 35° (311), 37° (222), 43° (400), 53° (422), 57° (511) and 63° (440) [21, 43, 44]. However,
the black colour of the IO powder is suggestive of Fe3O4phase rather than γ-Fe2O3 [18]. The
similarity between the two patterns in Figure 1a without a distinct broad peak between 2θ 20-25° is
indicative of minimal silica influence [21] suggestive of a thin silica shell. Using the Scherrer
Equation (Equation 1) for the (311) peak of the IO XRD pattern, the average crystallite size was
calculated as 20 nm. The FTIR spectra for IO and SIO synthesized particles are given in Figure 1b.
The major peak between 1160-1000 cm-1 is characteristic of the Si-O-Si bond [31, 45] showing the
presence of silica on SIO, while this peak as expected was not present for IO. The BET surface
areas for IO and SIO as measured from N2 porosimetry were 38 and 29 m2/g. The slightly lower
surface area for the SIO may be associated to the probable silica coating of aggregated IO particles.
Assuming a thin silica coating for SIO and using 5.1 g/cm3, the density of bulk magnetite, as
representative density value for both powders, the computed particle size using Equation 2 is 31 and
41 nm for IO and SIO respectively. The BET computed particle size of 31 nm for IO compares with
the XRD derived average particles crystalline size of 20 nm. The BET surface areas and calculated
9
Figure 1. XRD patterns (a) and FTIR spectra (b) for IO and SIO powders
Table 2. BET surface areas and particle sizes for synthesized particles
Particle BET specific surface
area (m2/g) BET derived particle size using Equation 2 XRD derived crystalline size using Equation 1
IO 38 31 20
SIO 29 41 -
3.2 Particle dispersion in membrane
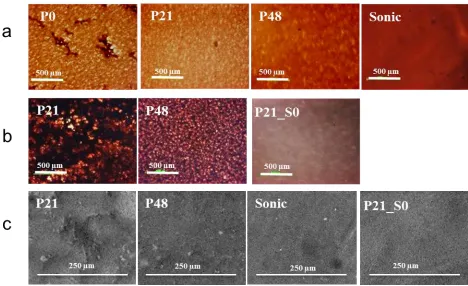
Figure 2 shows optical transmission and SEM images of representative membranes at 4 wt.% and
50 wt.% filler as well as images for the filler free P21_S0 membrane. Optical and SEM images at
other filler proportions are presented in the Supplementary Material (Figures S1 and S2
respectively). Also presented in the Supplementary Material is the SEM cross-sectional images
showing typical asymmetric pore morphology of thin skin layer and spongy substructure (Figure
S.3) [39]. In Figure 2, significant surface inhomogeneity can be observed in the P0_S4 membrane
containing no PVP suggesting severe particle aggregations. The P21 and P48 membranes with 21
wt.% and 48wt .% PVP respectively shows a more homogeneous surface feature under the optical
microscope which can be interpreted as indicating that the addition of PVP aided the dispersion of
the hydrophilic nanoparticles across the PVDF matrix. The Sonic membrane (Fig. 2a) showed very
homogenous surface features comparable with the filler-free membrane (P21_S0) (Figure 2b). The
inhomogeneity in the P21 and P48 membranes becomes more obvious at the higher filler proportion
of 50 wt.% (Figure 2b). The P48_S50 membrane appears to show better homogeneity than the
P21_S50 membrane apparently suggesting that as the concentration of PVP increased (i.e. from 21
to 48 wt.%) the hydrophilic nanoparticles were better dispersed further implying that PVP aids filler
dispersion in membranes. Light could not be transmitted through the Sonic_S50 which seems to
suggest good particle dispersion. This appears to be corroborated by the SEM image of Figure 2c
10
intense particle aggregation for the P0_S4 membrane resulted in visible tear on the membrane
during casting, thereby undermining its use as a membrane. Consequently, membranes with filler
>10 wt.% were not produced for the P0 set.
Figure 2. Optical transmission microscope images of membranes at filler proportion of 4 wt.% (a), 50 wt.% (b), and SEM images at 50 wt.% (c). Optical and SEM images for P21_S0 membrane are shown in (b) and (c) respectively.
3.2. Crystalline phase
PVDF is known to exist in about four crystalline forms [46, 47]. The β phase appears to be the most
important as it exhibits important properties such as piezo-, pyro- and ferroelectric effects and has
also been associated with enhanced mechanical strength which is important for developing durable
and integral membranes [39, 40, 48, 49]. The polar β phase has also been associated with PVDF
membranes increased affinity for polar molecules [41] and hence can be valuable in the control of
fouling by non-polar contaminants. A number of procedures have been shown to induce or enhance the formation of the β phase of PVDF including mechanical treatment and the incorporation of nanoparticles [49, 50]. Infrared spectroscopy is a common technique for characterizing the
crystalline phase of PVDF. FTIR peaks at 763, 796 and 976 cm-1, have been associated with the α
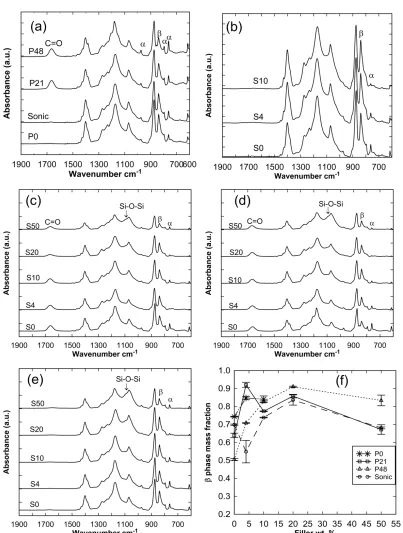
phase while peaks at 840 and 1175 cm-1 have been linked to the β phase [41, 51]. Figure 3a is the
11
well as a band at 1660 cm-1 that can be associated with C=O [52] indicative of the presence of PVP
in P21 and P48 but not in the other two membrane sets. It may be noted that peaks for the α phase
are most prominent for the P48 membrane and least expressed for the P0 membrane suggesting that
both PVP addition and dope sonication favoured the development of the α phase of PVDF. The
FTIR spectra for P0, P21, P48 and Sonic membranes are shown in Figure 3b, c, d, and e,
respectively. It can been seen that the addition of the nanoparticles decreased the peak for the α phase for all membrane sets. In fact, the peaks for the α phase practically disappeared at 20 wt.% filler for P21, P48 and Sonic sets. For the P21 set, α phase peak was also absent at 4 wt.%.
Consequently, the SIO nanoparticles appear to direct/stabilise the PVDF crystalline structure in favour of the β phase as has been previously reported for silicates [39, 53]. However, at the higher filler loading of 50 wt.%, the α phase peak is seen to reappear. This observation may be related to
significant interference with the polymer framework with diminished polymer-polymer
12
Figure 3. FTIR spectra showing characteristics peaks for α and β phases of PVDF, the Si-O-Si peak
for silica, and the C=O peak for PVP for membranes with no added filler nanoparticles (a) P0
membranes (b) P21 membranes (c) P48 membranes (d) Sonic membranes (e) and the mass fraction of PVDF β phase determined from FTIR spectra by Equation 3 (f).
Using Equation 3, the computed β phase mass fractions for the membranes under investigation are
13
significant reduction effect. The addition of 48 wt.% PVP reduced the β phase mass fraction from
0.74 to 0.50. Zhao et al. [51] has previously reported that the addition of a hydrophilic polymer,
poly(methylmethacrylate)(PMMA), favoured a particular PVDF polymorph. In their work, PMMA
was reported to increase the formation of the β phase while in this work the β phase was observed to
decrease with the addition of the hydrophilic PVP. The difference may be associated with the nature
of solvent used for phase inversion or to specific effect of the hydrophilic polymer itself [51]. However the addition of 4 wt.% inorganic filler assisted in the prevention of β phase reduction, where 0.71 remained. For the P0 and P21 membranes (Figure 3b,c), 4 wt.% filler material resulted
in a polymer film with a β phase concentration of 0.85 and 0.92 respectively. The high value of 0.92
for β phase mass fraction for P21_S4 is consistent with the absence of an α phase peak in Figure 3c.
The same amount of filler material, however, decreased the β phase for the Sonic membrane from
0.70 to 0.55. Further filler addition to 20 wt% increased the β phase for the Sonic membrane to
0.84. The β phase fraction declined at the highest filler composition of 50 wt.%, settling to between
0.67 and 0.83 for P21, P48 and Sonic. The P48 membrane maintained the highest β phase of 0.83 at
the maximum filler composition of 50 wt% indicating its crystalline phase was least affected by the
presence of significant amount of inorganic filler interfering with the PVDF polymer framework
probably due to its higher PVP content.
Figure 3f shows relatively complicated trends in the β phase mass fraction with respect to dope
sonication, nanoparticles and PVP addition demonstrating the complex interaction of the PVDF
polymer crystalline phase to membrane fabrication processes and additives. However, the complex trends of the β phase mass fraction are not limited to membrane relevant processes [49]. In fact, the trends in Figure 3f is similar to those published by Sajkiewicz et al [50] for the effects of drawing
temperatures on the proportion of β phase in PVDF samples from different suppliers and under
different rate of drawing. The β phase mass fraction was seen to increase with increasing drawing
temperature at diverse rates for these samples, peaked at some point and subsequently began to
decrease at dissimilar rates at higher drawing temperatures.
3.3. Thermal properties
Several articles published on MMM have shown that the addition of silica nanoparticles and
nanoparticle of other materials can lead to substantial improvement in thermal stability [29, 56, 57].
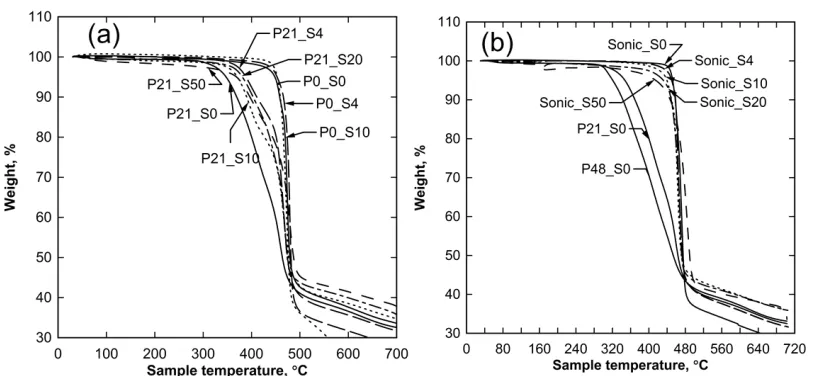
The results of the thermal stability measured by TGA are given in Figure 4. It can be seen that the
addition 21 wt.% PVP (Figure 4a) led to a significant loss in thermal stability, reducing the onset of
thermal induced weight loss for the filler-free membrane from 440 °C for P0_S0 to 310 °C for
P21_S0. Initial addition of 4 wt.% filler to P21 increased the thermal degradation temperature from
14
295 °C to 340 °C. No significant change in thermal stability was observed for the P0 set upon filler
addition up to 10 wt.%. This may be the consequence of the limited integration of the filler material
with the polymer network due to the significant filler aggregation observed earlier (Section 3.2).
The observed improvement in thermal stability for the P21 membrane due to filler addition appears
to correlate with the increase in the proportion of the β phases as identified in Figure 3. However,
unlike the β phase mass fraction trend, after the initial improvement in thermal stability with the
addition of 4 wt.% inorganic filler, subsequent increase in the amount of the inorganic particles
does not appear to have significant effect on MMM thermal stability. Nevertheless, it appears that
increasing amount of filler may have had a slight negative effect on thermal stability. However, the
lower profile for the 50 wt.% membrane may be due partly to the filler nanoparticles dehydration
since it is composed of the greatest proportion of filler material. For the Sonic membranes (Figure 4
b), the highest temperature of about 440 °C for the initial onset of thermal weight loss was measured
for the filler-free membrane identical to the P0_S0 membrane and there appears to be a gradual but
consistent reduction in thermal stability with increase in the amount of filler unlike the P0 set
suggesting better integration of the particles in the polymer network. Decreasing thermal stability of
MMM with increasing particle loading has been previously reported [39] suggesting that the
presence of the filler materials are probably physically interfering with the polymer structural
networks or are catalyzing the decomposition of the composite membrane [39, 54, 55].
It seems that while higher β phase mass fraction favours improved thermal stability, the amount of
the filler nanoparticles when considered in isolation seems to impair thermal stability.
Consequently, membranes with high filler fractions even when they possess appreciable amount of β phase shows relatively lower thermal stability. The addition of PVP appears to weaken the membrane thermal stability which can be seen by comparing the temperature for the initial onset of
thermal degradation for P0_S0 of 440 °C to the reduced values of 310 °C and 295 °C for P21_S0
and P48_S0 respectively. Since the profile for P0_S0 closely matches the profile for Sonic_S0, it
15
Figure 4. TGA weight loss profiles for P21 and P0 (a) Sonic (b) membranes. The weight loss profile
for P21_S0 and P48_S0 are included in (b).
4.4. Porosity and pore surface area
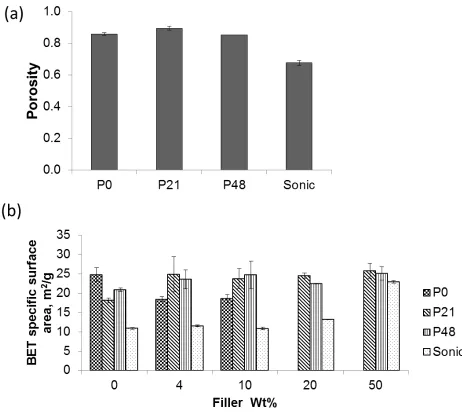
Figure 5a shows that the bulk porosity for filler-free membranes computed using Equation 4 ranged
from 68% to 90%. Since the matrix density was assumed to be the density of PVDF (1.78 g/cm3),
this equation was only applied to the filler-free membranes. From Figure 5a, P0_S0, with no added
PVP, showed a bulk porosity of 86% indicative of a porous membrane and suggestive of rapid
demixing during phase inversion [12]. The addition of 21% PVP only provided a marginal increase
in porosity to 90%. For the higher PVP content of 48%, the porosity appears to shrink to 85%. The
limited beneficial effect of the addition of PVP to the bulk porosity of membranes produced in this
work may be associated with a possible increase in dope viscosity due to the high PVP content [12].
At high PVP concentration, the increased dope viscosity has been reported to reduce the rate of
demixing or solvent/non-solvent interdiffusion during the phase inversion process resulting in a less
porous membrane [12]. In addition, during the demixing process, hydrophilic PVP polymer has
been reported to separate from the hydrophobic polymer (PVDF) and to accumulate in developing
pores and channels (PVDF-lean regions) [58], a process that is expected to reduce the overall
porosity of the membrane as was the case for P48. Sonication, in the absence of PVP, evidently
resulted in the reduction of membrane bulk porosity as the Sonic_S0 showed the lowest porosity of
68%. The result may also be associated to the effect of dope viscosity increase due to local high
temperature developed in the dope during the sonication process [59, 60] that may have increased
the rate of solvent evaporation. In addition, the intense energy of the ultrasonic energy [59] may
result in better dissolution of the PVDF polymer due to greater unfolding of the polymer molecular
16
higher viscosity of the casting dope from sonication is expected to result in limited demixing and
therefore less porous membranes [12].
BET specific surface areas for all membranes studied in this work are shown in Figure 5b. The
specific surface area ranged from 10 m2/g to 30 m2/g showing the degree of porosity within the
PVDF that is accessible by N2 molecules. Specifically, the Sonic membranes showed the least pore
surface area at all filler proportions. These results are consistent with the bulk porosity results
discussed in the previous section where sonication was seen to result in less porous membrane. In
the absence of fillers, the P0 membrane is seen to exhibit a higher BET specific surface area than
P21 and P48 membranes but in the presence of filler materials, the effect was reversed and the P0
membranes showed lower pore surface areas than the PVP containing membranes. The lower BET
surface area for P21 and P48 membranes in the absence of fillers may be explained by a possible
trapping of PVP chains in PVDF pores [58] thereby reducing the surface for N2 absorption. The
subsequent higher BET specific surface area for the PVP containing membranes in the presence of
fillers may have resulted from the contribution to the total surface area provided by the fillers due to
their relatively better dispersion in the presence of PVP (Section 4.1). However, since the fillers
also fill up matrix pores, higher filler amounts did not result in further improvement in the BET
specific surface area except for the Sonic membranes. The addition of nanoparticles could lead to
higher membrane specific surface area due to the contribution to the total surface area provided by
the nanoparticles (SIO BET specific surface area was 29 m2/g ) or it could lead to reduction in the
net surface area if the particles substantially fill up the pores of the polymer matrix [3, 61]. These
two contrary tendencies appear to influence the trend of the membrane pore surface with increasing
amounts of filler. The contribution to the specific surface area from SIO particles for the Sonic
sample may explain its sudden rise in BET specific surface area at 50 wt% filler, especially
considering that the Sonic membranes uniquely had lower surface area compared to membranes
17
Figure 5.Estimations of membrane porosity by the gravimetric technique for filler free membranes
18
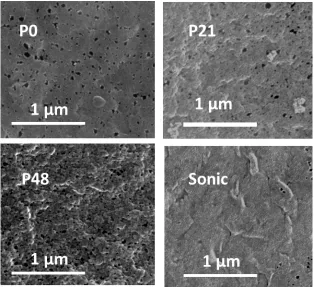
Figure 6. SEM images of the skin-layer surface of 10 wt.% membranes
The close-up SEM image of the selective surfaces of the membranes at 10 wt.% filler is given in
Figure 6. Images at other filler proportions are provided in Figure S5. The number of visible pores
on the surface of the Sonic membrane is much lower than those of the other three membranes
further indicating that sonication results in reduced membrane porosity. Consistent with the bulk
porosity and the BET specific surface areas, the SEM image indicates that significant amount of
pores can develop in a PVDF membrane in the absence of a pore former like PVP. The surface
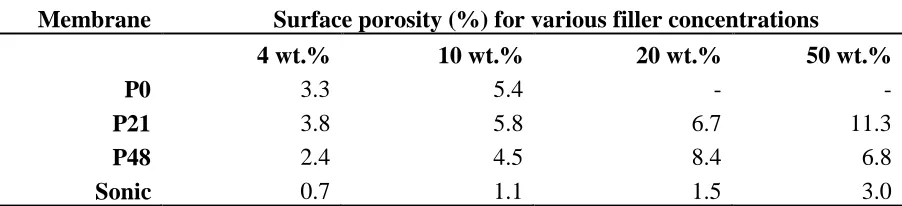
porosity for membrane skin layer computed from SEM images is shown in Table 3 as detected and
analysed by ImageJ. The surface porosity values appear to roughly follow a trend similar to the bulk
porosity of Figure 5a. However the porosity is an order of magnitude lower than the bulk PVDF,
which is expected considering the skin layer has a more dense structure to provide the membrane
with its selective function. The Sonic membrane is shown to have the lowest surface porosity
indicative of a less porous membrane while the P21 membrane appears to show the highest surface
porosity except at 20 wt.% filler. The slightly lower surface porosity value of the P48 membrane
even with respect to the P0 membrane except at 20 wt% filler once again indicates that high PVP
concentration results in less porous membrane probably due to increase in dope viscosity [12] or
due to pore filling by trapped PVP [58]. The relatively high surface porosity for the P0 membrane
can be taken to imply that in the absence of a pore former, significant amount of pores can still
develop in a PVDF membrane. However, it can be observed from Figure 6 that the presence of PVP
19
pores though with apparently rougher surface morphology. From Table 3, it appears that the surface
porosity for all membranes appear to increase with added filler with the P48_S20 membrane being
the sole exception to this trend. A possible explanation for the positive correlation between filler
amount and surface porosity is that the presence of fillers provides rigidity for the membrane such
that pore collapse or shrinkage is reduced. Another possible explanation may be the loss of more
surface hydrophilic fillers into the coagulating bath during the phase inversion process as the
amount of initial filler increased resulting in more pores in the membrane structure [62].
Table 3. Surface porosity computed from ImageJ analysis of SEM images
Membrane Surface porosity (%) for various filler concentrations
4 wt.% 10 wt.% 20 wt.% 50 wt.%
P0 3.3 5.4 - -
P21 3.8 5.8 6.7 11.3
P48 2.4 4.5 8.4 6.8
Sonic 0.7 1.1 1.5 3.0
4.5. Membrane wettability
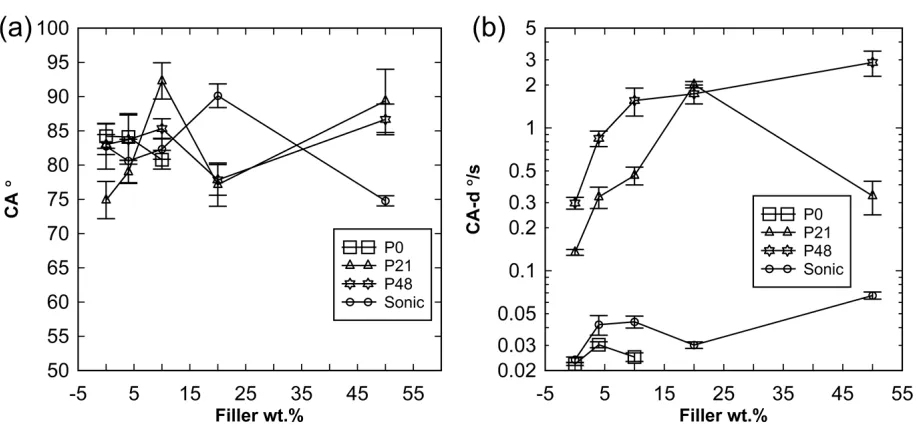
The water CA of the membranes is shown in Figure 7a. Significant fluctuations in measured CA
ranging from about 70 to 90 ° were observed for the membrane at varying filler amounts. Filler
additions appear not to have any discernable effect on the membrane CA, likely because of
interference from membrane roughness and limited filler dispersion as discussed in Section 3.2.
Particle aggregation reduces the effective amount of hydroxyl groups in direct contact with the
water drop [29, 61] and also provide an uneven and rough surface so that part of the water drop
makes no contact with the membrane but is suspended in air resulting in high CA [63]. Overall, it
can be said that the CA for all the membranes based on Figure 7a are similar irrespective of the
amount of hydrophilic additive or ultrasonic treatment. However, during the CA measurement, a
record was kept of the rate of decrease of the CA (CA-d) with time for the membranes. The trends
for this dynamic behavior are presented in Figure 7b. This result shows there is significant
difference in the interactions between the different membrane sets and water which is indicative of
varying wettability properties not captured by static CA results of Figure 7a. The P48 showed CA-d
up to about 2 °/s while the values for the P0 membranes were <0.05 °/s. The CA-d is related to the
rate of water penetration into the membrane via capillary action which have been shown to be
dependent on the effective water CA with the substrate [64]. Consequently, it can be said that the
membrane wettability or affinity for water improved considerably with the addition of PVP and
hydrophilic inorganic particles. The relative decrease in the CA-d for the P21_S50 membrane may
20
PVP is to connect the hydrophilic inorganic particles so that water molecules are attracted to
particles further away from the membrane surface [65]. Since the demixing process during phase
inversion result in an interconnected PVDF-lean and PVP-rich regions forming the membrane pore
network [58] it can be expected that the hydrophilic nanoparticles are more likely to be associated
with this PVP interconnected network [65]. In this system, water molecules on the membrane
surface can be rapidly adsorbed into the membrane, being transferred from one particle to the other
with the help of the hydrophilic connectivity provided by PVP polymer chains resulting in the great
water affinity shown by the P21 and P48 membranes but not by P0 and Sonic membranes. For the
Sonic membranes, the powerful dispersing effect of ultrasonication locked much of the hydrophilic
particles within the hydrophobic polymeric matrix restricting contact with water. During the phase
inversion process for the Sonic membranes, well dispersed hydrophilic particles on the dope
interface migrated more readily into the non-solvent polar water phase [62] and away from the
hydrophobic PVDF matrix thereby depleting surface hydrophilic particles while well-secured or
“locked” particles remained within the hydrophobic PVDF matrix. The overall effect is that the
Sonic membranes showed limited affinity for water. However, the Sonic membranes showed a
slightly higher CA-d than the P0 membranes suggesting that the better particle dispersion for the
Sonic membranes allowed for slightly more water penetration and that some amount of hydrophilic
particles remained on the membrane surface while severe particle aggregation meant that water
penetration was very low for the P0 membranes.
Figure 7. Water contact angle (CA) on membrane taken as the first stable angle before percolation
induced decrease (a) and water contact angle rate of decrease with time due to water penetration into
membrane under capillary action (CA-d) (b). Standard errors for at least five measurements are
21 4.6. Membrane integrity and filtration performance
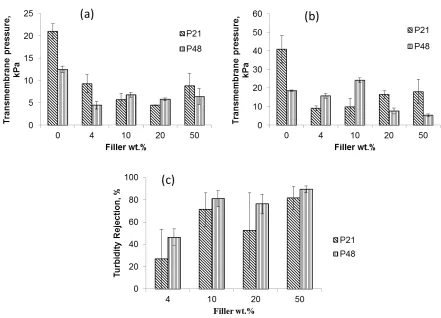
Operating under constant fluid flux of 96 L/m2/h, the transmembrane pressure (TMP) was recorded
for the evaluation of the membrane filtration performance under dead-end mode. The Sonic
membranes all resulted in very high ‘pre-fouling’ clean water filtration TMP with some TMPs
rising almost instantaneously to over 600 kPa and the tests were consequently terminated as it
exceeded the capacity of the experimental setup. Due to the already mentioned visible tear on the
P0_S4 and P0_S10, these membranes were excluded from the filtration tests. Although the P0_S0
membrane showed reasonable ‘pre-fouling’ clean water TMP of 140 kPa, it failed to achieve a
stable emulsion filtration as its TMP rose rapidly to more than 600 kPa and the filtration test had to
be discontinued. Only the P21 and P48 membranes sustained emulsion and water flux below 600
kPa. These outcomes were not unexpected as integral membranes usually benefit from both
sonication and PVP addition that were eliminated or isolated in this work. The ‘pre-fouling’ and
‘post-fouling’ water flux for the P21 and P48 membranes are shown in Figure 8. It can be seen that
the P21 and P48 membranes permeated clean water at TMP less than 30 kPa underscoring the
positive effect of PVP addition in improving water permeation consistent with their higher CA-d
values. It has also been reported that the presence of PVP results in high interconnectivity of pores
[58] as a consequence of the migration of PVP molecules to PVDF-lean water interface regions
during the phase inversion process and subsequent loss of some of the PVP molecules into the
coagulating bath leaving behind channels connecting membrane pores. The lower TMP for the P21
and P48 membranes may have benefitted from both higher pore connectivity and more hydrophilic
property due to the presence of PVP.
The average TMP for the ‘post-fouling’ constant flux of clean water for oil-emulsion fouled P21
and P48 membranes is given in Figure 8b. The greater proportion of the emulsion oil droplet sizes
ranged from about 10 to 1000 nm (Figure S6). It can be seen in Figure 8 that the addition of
inorganic fillers resulted in an overall significant reduction in the TMP when compared to the
filler-free membrane, a trend that may be associated to the hydrophilic effect of the inorganic fillers.
Improved membrane hydrophilicity due to the presence of inorganic particles resulted in decreased
capillary resistance to water flow [66]. However, the TMPs appear not to reveal a discernable trend
with regards to increasing amount of filler. Nevertheless, a consideration of the turbidity rejection
(Figure 8c) indicates that higher filler fractions seem to result in better membrane rejection.
Increasing MMM rejection with increasing inorganic amount of filler have been previously reported
[17, 57]. It was suggested that such a trend benefits from improving hydrophilicity arising from
increasing amount of filler [57]. Hydrophobic impurities in water such as emulsified oil permeate
22
results may also be indicative that large pores and defects in the MMM were apparently more
effectively blocked by the inorganic particles at higher filler fractions. The standard error for the
P21 membranes were generally very large which may be attributed to the limited homogeneity of
the membranes as previously noted in section 3.2.
Better membrane performance for the PVP containing membranes may potentially result if the
polymer were dissolved at higher temperature as a consequence of a lower viscosity dope rather
than at room temperature as was done in this work. However, one of the specific interests of this
study was to explore the particular effects of PVP addition; future work may study how temperature
enhances the PVP contribution to the membrane integrity. The rejection values for the filler-free
membranes were not given because only limited permeate could be collected as the membrane
fouled extensively and the test had to be terminated.
Figure 8. Transmembrane pressure at constant water flux of 96 L/m2/h for clean membranes (a), oil
emulsion fouled membrane (b), and membrane turbidity rejection (c)
The effects of PVP addition and dope ultrasonication on hydrophilic nanoparticles dispersion, pore
development and pore connectivity which ultimately determine the membrane wettability and water
23
Figure 9. The effects of dope sonication and PVP addition on some of the properties of PVDF
MMM showing pore developments due to nucleation of the polymer lean phase but limited
connectivity (a); severe nanoparticle aggregation due to the hydrophilic nanoparticles
incompatibility with the hydrophobic PVDF (b); pore connectivity arising from PVP migration to
the polymer lean phase during phase inversion and subsequent loss of some of the PVP molecules
into the coagulating bath leaving behind connecting channels (c); limited hydrophilic nanoparticle
dispersion arising from the bridging effect of the hydrophilic PVP (d); good nanoparticle dispersion
but limited interconnection between particles and diminished pore development as a consequence of
24 5. Conclusions
Based on the results of this study, the following conclusions have been drawn on the effect of PVP
addition and dope sonication on the properties of PVDF MMM:
1. Dope sonication is a very effective means of dispersing hydrophilic fillers within hydrophobic
polymer matrix although limited particles dispersion can be achieved by the addition of a
hydrophilic polymer like PVP.
2. In the absence of inorganic fillers, the PVDF β-phase decreased by 6% upon sonication and by
32% when 48 wt.% of PVP was added. However, at 4 wt.% filler, the highest β-phase mass fraction
of 0.92 was recorded for the P21 membrane while the β-phase for the Sonic membrane reduced to
its lowest value of 0.55 demonstrating membrane crystallinity dependence on dope treatment.
4. PVP addition is shown to result in significant reduction in temperature for the initial onset of
membrane thermal degradation from 440 °C to 295 °C upon addition of 48 wt.% PVP. For PVP
containing membranes, the initial addition of inorganic filler led to substantial improvement in
thermal stability. Sonication did not appear to affect the thermal stability of the membrane but the
addition of fillers to the Sonic membranes resulted in a steady but gradual reduction in the
temperature for the onset of initial thermal degradation.
5. In the absence of PVP, the addition of even large amount of inorganic filler material provided
only minimal improvement in membrane hydrophilicity for the Sonic membrane. However, in the
presence of PVP, the membrane water affinity was enhanced considerably resulting in rapid water
adsorption into the membrane. It is seen that dynamic CA which relates to the rate of CA decrease
rather than static CA is a good measure of membrane wettability.
6. Dope sonication in the absence of PVP results in tight membranes with very low permeation for
water. The presence of both PVP and inorganic filler resulted in the constant flux permeation of
water at low TMP. Increasing filler amount was seen to result in better turbidity rejection.
Consequently, dope sonication and PVP addition are useful methods to provide more control over
PVDF MMM integrity, homogeneity, crystallinity, thermal stability, porosity and permeability for
water treatment applications. The results of this study provide new data for optimizing MMM
design for water treatment applications.
6. Acknowledgments
The authors acknowledge the financial support provided by Victoria University to Ike Ikechukwu
25
Bao Lin at Deakin University for his assistance in acquiring the SEM images. Thanks also to Dr
Jianhua Zhang and Dr Marlene Cran from Victoria University for their kind suggestions.
References
[1] G.-d. Kang, Y.-m. Cao, Application and modification of poly(vinylidene fluoride) (PVDF) membranes – A review, Journal of Membrane Science, 463 (2014) 145-165.
[2] F. Liu, N.A. Hashim, Y. Liu, M.R.M. Abed, K. Li, Progress in the production and modification of PVDF membranes, Journal of Membrane Science, 375 (2011) 1-27.
[3] S.J. Oh, N. Kim, Y.T. Lee, Preparation and characterization of PVDF/TiO2 organic–inorganic composite membranes for fouling resistance improvement, Journal of Membrane Science, 345 (2009) 13-20.
[4] C. Zhao, X. Xu, J. Chen, F. Yang, Effect of graphene oxide concentration on the morphologies and antifouling properties of PVDF ultrafiltration membranes, Journal of Environmental Chemical Engineering, 1 (2013) 349-354.
[5] X. Zhang, Y. Wang, Y. You, H. Meng, J. Zhang, X. Xu, Preparation, performance and adsorption activity of TiO2 nanoparticles entrapped PVDF hybrid membranes, Applied Surface Science, 263 (2012) 660-665.
[6] A. Cui, Z. Liu, C. Xiao, Y. Zhang, Effect of micro-sized SiO2-particle on the performance of PVDF blend membranes via TIPS, Journal of Membrane Science, 360 (2010) 259-264.
[7] L. Yan, S. Hong, M.L. Li, Y.S. Li, Application of the Al2O3–PVDF nanocomposite tubular ultrafiltration (UF) membrane for oily wastewater treatment and its antifouling research, Separation and Purification Technology, 66 (2009) 347-352.
[8] A. Bottino, G. Capannelli, A. Comite, Preparation and characterization of novel porous PVDF-ZrO2 composite membranes, Desalination, 146 (2002) 35-40.
[9] H. Rajabi, N. Ghaemi, S.S. Madaeni, P. Daraei, M.A. Khadivi, M. Falsafi, Nanoclay embedded mixed matrix PVDF nanocomposite membrane: Preparation, characterization and biofouling resistance, Applied Surface Science, 313 (2014) 207-214.
[10] A. Pagidi, R. Saranya, G. Arthanareeswaran, A.F. Ismail, T. Matsuura, Enhanced oil–water separation using polysulfone membranes modified with polymeric additives, Desalination, 344 (2014) 280-288.
[11] H. Basri, A.F. Ismail, M. Aziz, Polyethersulfone (PES)–silver composite UF membrane: Effect of silver loading and PVP molecular weight on membrane morphology and antibacterial activity, Desalination, 273 (2011) 72-80.
[12] E. Saljoughi, T. Mohammadi, Cellulose acetate (CA)/polyvinylpyrrolidone (PVP) blend asymmetric membranes: Preparation, morphology and performance, Desalination, 249 (2009) 850-854.
[13] S. Liang, K. Xiao, Y. Mo, X. Huang, A novel ZnO nanoparticle blended polyvinylidene fluoride membrane for anti-irreversible fouling, Journal of Membrane Science, 394-395 (2012) 184-192. [14] S. Zhang, R. Wang, S. Zhang, G. Li, Y. Zhang, Treatment of wastewater containing oil using phosphorylated silica nanotubes (PSNTs)/polyvinylidene fluoride (PVDF) composite membrane, Desalination, 332 (2014) 109-116.
[15] Z.-Q. Huang, F. Zheng, Z. Zhang, H.-T. Xu, K.-M. Zhou, The performance of the PVDF-Fe3O4 ultrafiltration membrane and the effect of a parallel magnetic field used during the membrane formation, Desalination, 292 (2012) 64-72.
26
[17] Z.-Q. Huang, K. Chen, S.-N. Li, X.-T. Yin, Z. Zhang, H.-T. Xu, Effect of ferrosoferric oxide content on the performances of polysulfone–ferrosoferric oxide ultrafiltration membranes, Journal of Membrane Science, 315 (2008) 164-171.
[18] R.M. Cornell, U. Schwertmann, The Iron Oxides: Structures, Properties, Reactions, Occurences and Uses, 2nd Edition ed., WILEY-VCH Verlag GmbH & Co. KGaA, Weinheim, 2003.
[19] A.P.A. Faiyas, E.M. Vinoda, J. Joseph, R. Ganesan, R.K. Pandey, Dependence of pH and surfactant effect in the synthesis of magnetite (Fe3O4) nanoparticles and its properties, Journal of Magnetism and Magnetic Materials, 322 (2010) 400 - 404.
[20] T. Ahn, J.H. Kim, H.-M. Yang, J.W. Lee, J.-D. Kim, Formation Pathways of Magnetite Nanoparticles by Coprecipitation Method, The Journal of Physical Chemistry C, 116 (2012) 6069−6076.
[21] N. Mahmed, O. Heczko, A. Lancok, S.-P. Hannula, The magnetic and oxidation behavior of bare and silica-coated iron oxide nanoparticles synthesized by reverse co-precipitation of ferrous ion (Fe2+) in ambient atmosphere, Journal of Magnetism and Magnetic Materials, 353 (2014) 15 - 22. [22] G.U. Semblante, S.D.R. Tampubolon, S.-J. You, Y.-F. Lin, T.-C. Chang, F.-C. Yen, Fouling reduction in membrane reactor through magnetic particles, Journal of Membrane Science, 435 (2013) 62-70.
[23] S.D.R. Tampubolon, G.U. Semblante, S.-J. You, Y.-F. Lin, Application of magnetic γ-Fe2O3 to reduce membrane fouling, Journal of the Taiwan Institute of Chemical Engineers, (2013).
[24] B.I. Harman, H. Koseoglu, N.O. Yigit, M. Beyhan, M. Kitis, The use of iron oxide-coated ceramic membranes in removing natural organic matter and phenol from waters, Desalination, 261 (2010) 27-33.
[25] P. Sabbatini, F. Yrazu, F. Rossi, G. Thern, A. Marajofsky, M.M. Fidalgo de Cortalezzi, Fabrication and characterization of iron oxide ceramic membranes for arsenic removal, Water Research, 44 (2010) 5702-5712.
[26] L. De Angelis, M.M.F. de Cortalezzi, Ceramic membrane filtration of organic compounds: Effect of concentration, pH, and mixtures interactions on fouling, Separation and Purification Technology, 118 (2013) 762-775.
[27] A.L. Ahmad, M.A. Majid, B.S. Ooi, Functionalized PSf/SiO2 nanocomposite membrane for oil-in-water emulsion separation, Desalination, 268 (2011) 266-269.
[28] H. Wu, B. Tang, P. Wu, Optimizing polyamide thin film composite membrane covalently bonded with modified mesoporous silica nanoparticles, Journal of Membrane Science, 428 (2013) 341-348. [29] L.-Y. Yu, Z.-L. Xu, H.-M. Shen, H. Yang, Preparation and characterization of PVDF–SiO2 composite hollow fiber UF membrane by sol–gel method, Journal of Membrane Science, 337 (2009) 257-265.
[30] L.T. Zhuravlev, The surface chemistry of amorphous silica. Zhuravlev model, Colloids and Surfaces A: Physicochemical Engineering Aspects, 173 (2000) 1–38.
[31] L. Peng, W. Qisui, L. Xi, Z. Chaocan, Investigation of the states of water and OH groups on the surface of silica, Colloids and Surfaces A: Physicochemical and Engineering Aspects, 334 (2009) 112-115.
[32] J.T. Yates, Water interactions with silica surfaces: A big role for surface structure, Surface Science, 565 (2004) 103-106.
[33] X. Li, A. Sotto, J. Li, B. Van der Bruggen, Progress and perspectives for synthesis of sustainable antifouling composite membranes containing in situ generated nanoparticles, Journal of Membrane Science, 524 (2017) 502-528.
[34] J.S. Taurozzi, H. Arul, V.Z. Bosak, A.F. Burban, T.C. Voice, M.L. Bruening, V.V. Tarabara, Effect of filler incorporation route on the properties of polysulfone–silver nanocomposite membranes of different porosities, Journal of Membrane Science, 325 (2008) 58-68.
27
[36] H. Xu, N. Tong, L. Cui, Y. Lu, H. Gu, Preparation of hydrophilic magnetic nanospheres with high saturation magnetization, Journal of Magnetism and Magnetic Materials, 311 (2007) 125-130. [37] AZoNano, Sizing Nanoparticles - Determining the Particle Size of Nanomaterials by Micromeritics, in: M.I. Corporation (Ed.), 2013.
[38] S.A. Kirillov, Surface area and pore volume of a system of particles as a function of their size and packing, Microporous and Mesoporous Materials, 122 (2009) 234-239.
[39] C.Y. Lai, A. Groth, S. Gray, M. Duke, Preparation and characterization of poly(vinylidene fluoride)/nanoclay nanocomposite flat sheet membranes for abrasion resistance, Water Research, 57 (2014) 56-66.
[40] B. Mohammadi, A.A. Yousefi, S.M. Bellah, Effect of tensile strain rate and elongation on crystalline structure and piezoelectric properties of PVDF thin films, Polymer Testing, 26 (2007) 42-50.
[41] A.L. Ahmad, N. Ideris, B.S. Ooi, S.C. Low, A. Ismail, Morphology and polymorph study of a polyvinylidene fluoride (PVDF) membrane for protein binding: Effect of the dissolving temperature, Desalination, 278 (2011) 318-324.
[42] H. Ju, B.D. McCloskey, A.C. Sagle, Y.-H. Wu, V.A. Kusuma, B.D. Freeman, Crosslinked poly(ethylene oxide) fouling resistant coating materials for oil/water separation, Journal of Membrane Science, 307 (2008) 260-267.
[43] W. Kim, C.Y. Suh, S.W. Cho, K.M. Roh, H. Kwon, K. Song, I.J. Shon, A new method for the identification and quantification of magnetite-maghemite mixture using conventional X-ray diffraction technique, Talanta, 94 (2012) 348-352.
[44] F. Yazdania, M. Edrissia, Effect of pressure on the size of magnetite nanoparticles in the coprecipitation synthesis, Materials Science and Engineering B, 171 (2010) 86 - 89.
[45] R. Hofman, J.G.F. Westheim, I. Pouwel, T. Fransen, P.J. Gellings, FTIR and XPS Studies on Corrosion-resistant Si02 Coatings as a Function of the Humidity during Deposition, Surface and interface analysis, 24 (1996) 1-6.
[46] L. Priya, J.P. Jog, Polymorphism in Intercalated Poly(vinylidene fluoride)/Clay Nanocomposites, Journal of Applied Polymer Science, 89 (2003) 2036–2040.
[47] X. Wang, X. Wang, L. Zhang, Q. An, H. Chen, Morphology and Formation Mechanism of Poly(Vinylidene Fluoride) Membranes Prepared with Immerse Precipitation: Effect of Dissolving Temperature, Journal of Macromolecular Science, Part B, 48 (2009) 696-709.
[48] C.Y. Lai, A. Groth, S. Gray, M. Duke, Enhanced abrasion resistant PVDF/nanoclay hollow fibre composite membranes for water treatment, Journal of Membrane Science, 449 (2014) 146-157. [49] D.R. Dillon, K.K. Tenneti, C.Y. Li, F.K. Ko, I. Sics, B.S. Hsiao, On the structure and morphology of polyvinylidene fluoride–nanoclay nanocomposites, Polymer, 47 (2006) 1678-1688.
[50] P. Sajkiewicz, A. Wasiak, Z. Goclowski, Phase transitions during stretching of poly(vinylidenefluoride), European Polymer Journal, 35 (1999) 423-429.
[51] X. Zhao, S. Chen, J. Zhang, W. Zhang, X. Wang, Crystallization of PVDF in the PVDF/PMMA blends precipitated from their non-solvents: Special “orientation” behavior, morphology, and thermal properties, Journal of Crystal Growth, 328 (2011) 74-80.
[52] M. Avram, Infrared Spectroscopy: Applications in Organic Chemistry, Robert E. Krieger Publishing Co., Inc, New York, 1978.
[53] D. Shah, P. Maiti, E. Gunn, D.F. Schmidt, D.D. Jiang, C.A. Batt, E.P. Giannelis, Dramatic enhancements in toughness of Polyvinylidene fluoride nanocomposites via nanoclay directed crystal structure and morphology, Advanced Materials, 16 (2004) 1173-1177.
[54] A. Karatrantos, N. Clarke, R.J. Composto, K.I. Winey, Entanglements in polymer nanocomposites containing spherical nanoparticles, Soft Matter, 12 (2016) 2567--2574.
[55] R. Mangal, S. Srivastava, L.A. Archer, Phase stability and dynamics of entangled polymer-nanoparticle composites, Nature communications, 6 (2015) 7198.
28
[57] Y. Zhang, J. Zhao, H. Chu, X. Zhou, Y. Wei, Effect of modified attapulgite addition on the performance of a PVDF ultrafiltration membrane, Desalination, 344 (2014) 71-78.
[58] I.M. Wienk, R.M. Boom, M.A.M. Beerlage, A.M.W. Bulte, C.A. Smolders, H. Strathmann, Recent advances in the formation of phase inversion membranes made from amorphous or semi-crystalline polymers, Journal of Membrane Science, 113 (1996) 361-371.
[59] N. Pokhrel, P.K. Vabbina, N. Pala, Sonochemistry: Science and Engineering, Ultrasonics sonochemistry, 29 (2016) 104-128.
[60] B. Banerjee, Recent developments on ultrasound assisted catalyst-free organic synthesis, Ultrasonics sonochemistry, 35 (2017) 1-14.
[61] R.A. Damodar, S.J. You, H.H. Chou, Study the self cleaning, antibacterial and photocatalytic properties of TiO2 entrapped PVDF membranes, J Hazard Mater, 172 (2009) 1321-1328.
[62] W. Chen, Y. Su, L. Zhang, Q. Shi, J. Peng, Z. Jiang, In situ generated silica nanoparticles as pore-forming agent for enhanced permeability of cellulose acetate membranes, Journal of Membrane Science, 348 (2010) 75-83.
[63] D.J. Shaw, Introduction to colloid and surface chemistry, Butterworth & Co. (Publishers) Ltd, London, 1980.
[64] E.W. Washburn, The dynamics of capillary flow, The Physical Review, 17 (1921) 273-283. [65] S. Bonyadi, T.S. Chung, Flux enhancement in membrane distillation by fabrication of dual layer hydrophilic–hydrophobic hollow fiber membranes, Journal of Membrane Science, 306 (2007) 134-146.