Financial Support for Families with Children:
Options for the New Integrated Child Credit
Mike Brewer
Michal Myck
Howard Reed
Institute for Fiscal Studies
(An E.S.R.C Research Centre)
Copy-edited by Judith Payne
Published by
The Institute for Fiscal Studies 7 Ridgmount Street London WC1E 7AE Tel: +44-20-7291 4800 Fax: +44-20-7323 4780 Email: mailbox@ifs.org.uk Internet: http://www.ifs.org.uk
© The Institute for Fiscal Studies, January 2001
ISBN 1-873357-99-0
Printed by
KKS Printing The Printworks 12–20 Rosina Street
Preface
An early and shortened version of this paper was submitted to the House of Commons Social Security Select Committee for its enquiry into the integrated child credit. Data from the Family Resources Survey and the Households Below Average Income datasets were made available by the Department of Social Security, data from the British Household Panel Survey were supplied by the ESRC Data Archive and data from the Programme of Research into Low-Income Families were used with the permission of the Policy Studies Institute. None of these institutions bears any responsibility for the interpretation of the data in this Commentary. The authors wish to thank James Banks, Andrew Dilnot and Alissa Goodman for useful discussion and comments on the issues and on previous drafts. Any errors that remain, though, and all opinions expressed, are those of the authors.
Contents
Executive summary
1. Introduction
2. Creating an integrated child credit from the current systems for financial support for children
2.1 The current system of financial support for children
2.2 Moving from the current system of financial support for children to an integrated child credit
2.3 An illustrative integrated child credit based on the current structure
3. Why do governments support families with children? The economics of financial support for children
3.1 Why do governments support families with children? 3.2 What is the best way to achieve these aims?
3.3 Where are children in the income distribution?
3.4 The history of financial support for children in the UK
3.5 Systems for directing financial support to families with children in other developed countries
4. How should we judge the success of an integrated child credit? 4.1 Objectives for the integrated child credit
4.2 How does the current system rate when assessed on these criteria? 4.3 How would an integrated child credit meet these objectives?
5. The structure of an integrated child credit
5.1 What should the maximum level of integrated child credit be for each child?
5.2 How should the integrated child credit be tapered with extra income? 5.3 The treatment of income and capital
5.4 Modelling options for an integrated child credit
6. The administration of an integrated child credit 6.1 Dynamics of family structure and incomes
6.2 The administrative design of taxes and benefits 6.3 Some options for an integrated child credit
7. Other design issues: joint assessment, wallet-to-purse classification and classifying the integrated child credit
7.1 Joint assessment
7.2 Who should receive financial support for children?
7.3 Why an employment tax credit for people without children? 7.4 Is the integrated child credit a benefit or a tax credit?
8. Conclusions
Appendix: The dynamics of family circumstances
Executive summary
The government wants to bring together the different strands of financial support for children in working families’ tax credit (WFTC), income support and the children’s tax credit to create an integrated and seamless system of financial support for children. This new integrated child credit will be a radical reform of the tax and benefit system, affecting nearly all the 7 million families with children in the UK. The government has set broad objectives for the new credit, but few practical details have been released.
Governments all over the world direct resources to families with children to achieve equity – horizontal and vertical – and efficiency goals. The horizontal equity argument leads governments to direct resources towards poor households, taking account of their composition, whether or not they have children. The vertical equity and efficiency arguments both give rationales for directing additional resources to children. The context in the UK is that families with children are more concentrated at the bottom of the income distribution than families without children. Lone parents tend to have lower incomes than couples with children, and large families have lower average incomes – even before equivalisation – than smaller families.
Designing the integrated child credit is a great opportunity to rationalise the existing mechanisms for supporting families with children that have evolved over decades. The government has set objectives for the integrated child credit; these are not met well by the current system of support. But other goals are met well at present, such as providing a safety net, reducing the hassle of applying for support for better-off families and not making large payments that have to be recovered later. The integrated child credit should also be assessed against these broader objectives.
Introducing an integrated child credit could cost around £1 billion a year, with the gains concentrated on poorer families. This is because families on income support currently receive less for each child than some families receiving WFTC, and the government wants a seamless system of support for out-of-work and low-paid families. The move to joint assessment in an integrated child credit could create losers amongst better-off families; a credit where no one lost through the full joint assessment would cost a further £650 million a year. Depending on the exact parameters, the integrated child credit could bring together around £9 billion a year of financial support and be claimed by around 6 million families.
1. Introduction
The government announced in March 2000 that it wanted to ‘… bring together the different strands of support for children in the WFTC, Income Support and the Children’s Tax Credit to create an integrated and seamless system of financial support for children’ (HM Treasury, 2000b).
The integrated child credit is a potentially radical reform of the tax and benefit system that will affect almost all of the 7 million families with children in the UK. Together with the pension credit and the new employment tax credit, it represents part of a move by the current Labour Government to blur the boundaries between the tax and benefit systems, to transfer responsibilities for traditional means-tested benefits from the Department of Social Security to the Inland Revenue, and to extend joint assessment to a large number of families who have, since 1990, managed their financial dealings with governments as individuals. It will also mean that, after 30 years of a benefit system that treated people differently depending on whether they work or not, out-of-work families will soon be treated in the same way as low-paid families, at least in respect of the financial support for their children.
The government has set out some broad objectives for a new integrated child credit. But few practical details on how the credit will operate have been released. The most detailed publication to date on the possible structure of a credit (in HM Treasury (2000b)) contained only illustrations of how an integrated child credit would look if it were based on the current structure of financial support for families with children. No doubt this paucity of detail is partly to allow the government to seek views on the operational details; it also reflects the fact that the integrated child credit is a long-term reform: it would not be implemented until 2003 at the earliest.
But as the integrated child credit represents a radical reform of the tax and benefit system for families with children, and the government has given itself a long time to get it right, it is important to realise that there are many options for almost any of the major parameters of the integrated child credit. For example, how should the credit relate to family size and family income? what should the period of assessment and length of award be? how responsive should the credit be to changes in needs or income? should it be cumulative or non-cumulative? and how should it treat different sorts of income and capital? Few of these issues are new, but as the present tax and benefit system has evolved piecemeal, they are not often examined simultaneously from first principles, and certainly not since the Fowler reviews in the mid-1980s that led to the 1988 social security reforms. The introduction of the integrated child credit represents an ideal time to do just that.
There are many questions raised by the integrated child credit, and we only look at what we think are the most important.1 In this Commentary, we discuss the following:
1 Other studies of the integrated child credit include a comparative international study part-funded by the Joseph
• What the current structure of financial support for families with children looks like, and how the government could carve up the existing system to separate out the ‘adult’ and ‘child’ components of financial support (Chapter 2).
• Why governments all over the world direct extra resources to families with children (Chapter 3). We consider the economics of financial support for children, look at where children are in the income distribution and examine evidence on the cost of children. We also review the history of financial support for children in the UK and look at some recent international reforms.
• What objectives the government has set for an integrated child credit, and what other criteria we might use to evaluate options and judge its eventual success (Chapter 4).
• How the integrated child credit could be structured to meet the costs of children in different sorts of households (Chapter 5). We look at how it could vary with the number of children and family income, and what level it should be set at. We calculate the aggregate cost and analyse the distributional impact of some options.
• Issues around the administration of the integrated child credit (Chapter 6). Some of the most important design parameters for an integrated child credit will be its responsiveness to changes in income and family circumstances. As the integrated child credit is replacing three very different systems of financial support for children, some parameters will inevitably have to change. We review what is known about short-run changes in family circumstances, as any integrated child credit will need to be responsive and sensitive enough to deal with the constant changes in people’s family lives and work situations, and we outline some illustrative options of how sufficient responsiveness and sensitivity might be achieved.
• The implications of other design features, such as the decision to assess the integrated child credit on joint income, why it matters to whom the integrated child credit is paid, why the government wants to have tax credits for people without children, and how the integrated child credit will score in the National Accounts (Chapter 7).
2.
Creating an integrated child credit from the current systems for
financial support for children
This chapter describes the current system of financial support for children and shows one way in which it could be restructured to form an integrated child credit. We present this simple reform before going on, in future chapters, to explore more radical alternatives.
2.1 The current system of financial support for children
From April 2001, there will be four ways that the government directs financial support to children:2
• child benefit – a flat-rate, non-means-tested, non-taxable benefit for each child – is the core of financial support for children;
• means-tested benefits for families where no one works – income support and income-related jobseeker’s allowance – contain extra child premiums for each child and a family premium for any family with children;
• in-work benefits for low-income families where one adult works 16 hours or more a week – working families’ tax credit and disabled person’s tax credit – contain child credits for each child;
• a new tax credit for all families who pay income tax – the children’s tax credit – is worth up to £442 in 2001,3 and is phased out where there is a higher-rate taxpayer in
the family. It will be worth less than £442 to families who would pay less than £442 income tax a year (gross incomes of less than £7,500) and to families where any partner pays higher-rate tax (corresponding to gross incomes of over £33,935 or more in 2001). The credit will not vary with the number of children.
Table 2.1 shows the rates of these instruments from April 2001, assuming they are not altered in the 2001 Budget.4 Clearly, the actual rates will be different by 2003, when the
integrated child credit is due to be introduced.
Table 2.2 shows how many families may benefit from each strand of support. But these four systems overlap: almost all families will receive simultaneous support from two systems, and some will receive three.5 For example:
2 Section 3.4 outlines the development of financial support for children in the UK. Battle and Mendelson (2001)
contains more details on the UK’s current system.
3 The Chancellor suggested in the 2000 Pre-Budget Report that it could rise to £520 in April 2001.
4 Hereafter, we use WFTC to refer to both working families’ tax credit and disabled person’s tax credit for parents, and
income support to refer to both income support and income-related jobseeker’s allowance.
5 In Chapter 6, we look at some of the dynamics of family circumstances that mean that, over the period of a year,
Table 2.1. Transfer payments for families with children from April 2001
Weekly payments
Child benefit
First child £15.50
Subsequent children £10.35 per child
Income support
Adult premium £53.05 (lone parent)
£83.25 (couple)
Family premium £14.50
Child allowance £31.45
WFTC
Basic credit £54.00
(+ £11.45 30-hour premium)
Child credit £26.00
Children’s tax credit
Maximum value £8.50
Notes: IS and WFTC values are for children aged under 17; higher rates apply for children under 19 and in
full-time education. CB rates apply for all dependent children (i.e. under 17 and under 19 and in full-time education). Families must have a child under 16 to claim the CTC.
• All families with children can receive child benefit alongside one or more of income support, WFTC and the children’s tax credit.6
• WFTC and income support are nearly mutually exclusive because of the conditions on the number of hours worked, but some families in transition from having some adults in work to having no adults in work could temporarily receive both income support and WFTC. Almost no family would receive income support and benefit from the children’s tax credit at the same time.
• Families receiving WFTC will generally also benefit from the children’s tax credit from April 2001.
Table 2.2. Families receiving financial support for children, 1999–2000
Number of families Number of children
Child benefit 7,025,000 12,700,000
Income support 1,230,000 2,400,000
Jobseeker’s allowance
(income-related) 136,000 286,000
WFTC 989,000 2,010,000
Children’s tax credit about 5 million about 8 million
Notes: CB, IS and JSA estimates are for Great Britain, WFTC and CTC for the UK. JSA and WFTC
estimates relate to February 2000.
Sources: CB, IS, JSA and WFTC figures from appropriate Quarterly Statistical Enquiries (Department of
Social Security and Inland Revenue). CTC estimate from HM Treasury (2000b).
6 Families on income support do not see any increase in their income from receiving child benefit, but they still have to
2.2 Moving from the current system of financial support for children to an integrated child credit
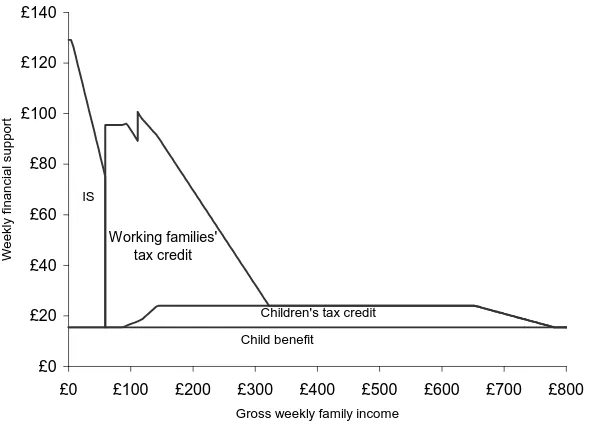
The government has said that it will ‘… bring together the different strands of support for children in the Working Families’ Tax Credit (WFTC), Income Support (IS) or Job Seekers Allowance (Income Related) and the Children’s Tax Credit to create an integrated and seamless system of financial support for children paid direct to the main carer, building upon the foundation of universal Child Benefit’ (HM Treasury, 2000b). Figure 2.1 shows the transfer payments from these four transfer mechanisms from April 2001, when the children’s tax credit is introduced. The figure shows the total value of income support and WFTC awards, not just the amount payable in respect of having a child. The figure assumes a couple family with one child and one earner; the equivalent picture for a lone parent would be identical apart from a lower total income support payment.
Figure 2.1. Financial support for a family with one child from April 2001 (£ p.w.)
£0 £20 £40 £60 £80 £100 £120 £140
£0 £100 £200 £300 £400 £500 £600 £700 £800
Gross weekly family income
Weekly financial support
Child benefit Children's tax credit
Working families' tax credit
IS
Source: Authors’ calculations from the IFS tax and benefit model, TAXBEN. The figure assumes that the
family qualifies for WFTC at a weekly wage of £59.20, corresponding to 16 hours of work at the national minimum wage.
entitled to the basic credit and a child credit of WFTC. But in HM Treasury (2000b), the government treats the basic credit as an ‘adult-related payment’ because it has also announced that, from 2003, low-income adults without children will be able to claim an in-work tax credit through an employment tax credit (discussed more in Chapter 7).7 So
Figure 2.2 shows the current system broken up into adult and child payments, having split WFTC in the way suggested in HM Treasury (2000b) and assuming that the new employment tax credit is equal in value to the current basic credit in WFTC.8
Figure 2.2. Financial support for a family with one child from April 2001, split into ‘adult’ and ‘child’ components (£ p.w.)
£0 £20 £40 £60 £80 £100 £120 £140
£0 £100 £200 £300 £400 £500 £600 £700 £800
Gross weekly family income
Weekly financial support
Child benefit
Children's tax credit
WFTC - child
WFTC - adult
IS - a
IS - c
IS - f
IS - income support: - a - adult - c - child - f - family premium
Source: Authors’ calculations from the IFS tax and benefit model, TAXBEN. The figure assumes that the
family qualifies for WFTC at a weekly wage of £59.20, corresponding to 16 hours of work at the national minimum wage.
Under these assumptions, and from April 2001, ‘child-related support’ for the first child will vary from £15.50 for the richest families to £45.95 for the poorest, but will reach £50 for some families on WFTC.9 We have also shown the system with the adult-related
payments reduced before the child-related payments as income rises: this is, of course, arbitrary, and we could just as well have presented a figure showing the opposite.
7 Just to demonstrate that no study of the tax and benefit system is simple, disabled person’s tax credit – which is
similar to working families’ tax credit except that it is available to people with disabilities who are in work, whether or not they have children – has a higher ‘basic credit’ for families with children than it does for single people without children.
8 We maintain this assumption throughout the Commentary.
9 The poorest do not receive the greatest amount of financial support because the government allows for the fact that,
2.3 An illustrative integrated child credit based on the current structure
The government has released very few details of how an integrated child credit could be structured and operated, so Figure 2.3 shows how an integrated child credit could be constructed from the current levels of transfer payments for families with children.10 We
have assumed that the total value of the integrated child credit together with child benefit is equal to £50 a week – the maximum amount payable for children at present (under the breakdown above). Above 16 hours a week, a family would no longer be entitled to jobseeker’s allowance or income support and would claim employment tax credit instead. But the integrated child credit would still be paid at the same level (or: ‘a seamless payment across the welfare to work divide’ (HM Treasury, 2000b)).
Figure 2.3. How an integrated child credit might be formed from the current system of financial support for a family with one child (£ p.w.)
£0 £20 £40 £60 £80 £100 £120 £140
£0 £100 £200 £300 £400 £500 £600 £700 £800
Gross weekly family income
Weekly financial support
Child benefit Integrated child
credit Employment
tax credit IS
Source: Authors’ calculations from the IFS tax and benefit model, TAXBEN. The figure assumes that the
family qualifies for the new employment tax credit at a weekly wage of £59.20, corresponding to 16 hours of work at the national minimum wage.
The government has said that child benefit will remain separate from the integrated child credit. There is no reason why an integrated child credit could not also include child benefit, so that all child-related payments were made through one mechanism that would apply to all families with children in the UK. This could further increase transparency and reduce administration costs for government. On the other hand, child benefit is a popular and well-recognised benefit, with almost full take-up. As well as wishing to avoid the political disadvantages of appearing to abolish a popular benefit, the government may want to use and retain the child benefit records as an almost-complete register of families that could claim the integrated child credit.
Some key features of the new integrated child credit system, if it mirrored the current structure of financial support, would be as follows:
• There would be a core part of the integrated child credit payable to all families with children with (gross) incomes below around £33,935, regardless of how many children they have, corresponding to what is now the children’s tax credit. Better-off families would receive less or none.
• Lower-income families receiving the full integrated child credit award would receive an extra £36.35 a week for each child beyond the first (£10.35 in child benefit and £26 in the integrated child credit); better-off families would receive less than that for children beyond the first.
• Lower-income families (below around £13,000 a year) would receive the same value of integrated child credit whether they were out of work or in low-paid work.
3.
Why do governments support families with children? The
economics of financial support for children
‘Children are not simply a private luxury. They are an asset to the community, and the community can no longer afford to leave the provision for their welfare solely to the accident of individual income.’
Eleanor Rathbone, The Case for Family Allowances, 1940.
In this chapter, we look at why almost all governments direct cash resources to families with children. As the quotation above illustrates, this is not a new debate. It is possible to distinguish between equity (as in fairness) and efficiency arguments for supporting families with children.
The efficiency argument is that society cares about the well-being of all children as they represent future productive members of society. There are two equity arguments. Pursuing horizontal equity means trying to reduce the inequality in living standards between households of different compositions. But governments may also have vertical equity goals which mean that they treat households with different compositions differently. We discuss the role of equivalence scales in helping governments make comparisons of living standards between different sorts of households, and the implications of equivalence scales for structuring financial support for children (Section 3.2). We then illustrate the position of children in the income distribution and recent trends in child poverty in the UK (Section 3.3). Having examined these issues, we sketch out the history of financial support for children in the UK (Section 3.4) and highlight an important recent study that has compared the systems for supporting children in four countries (Section 3.5). This will provide some context before we analyse options for the new integrated child credit in subsequent chapters.
3.1 Why do governments support families with children?
Economists usually distinguish arguments for any form of government intervention into those concerning efficiency and those to do with equity. We can do the same for financial support for children:
• The horizontal equity argument is about redistribution: most governments
redistribute money from the richest households to the poorest households because they want to achieve a fairer distribution of living standards or income (however that may be measured).11 But it would not be sensible, when governments measure living
standards and compare incomes, simply to take money from the households with the highest incomes and give it to those with the lowest without taking account of the composition of those households. Smaller households will generally need fewer
11 We are simplifying the equity arguments for government intervention here. Governments are presumably interested
resources to achieve a certain standard of living than larger households, such as those with children. This horizontal equity argument is not exclusively a rationale for directing resources to families with children; it is a rationale for directing resources to poorer households, having taken account of the composition of the households.
• The vertical equity argument is that governments may have a desire to redistribute money to families with children through some other value judgement about the value of children and parenting.12 This will represent a redistribution between people at
different stages of their lives, as families with children have not always had children and do not remain families with children for ever.
• The efficiency argument is that society has an interest in the outcomes for all children over and above the parents’ own interest (or that there are externalities attached to the outcomes for children). There is strong evidence13 that children who
grow up in low-income families are more likely than better-off children to be unemployed, to be low-skilled, to be unhealthy, to commit crime and to be a teenage parent in adulthood. Most of these outcomes will impose costs on society in future years in forgone taxes and extra spending on health, law and order, and social security.
So the horizontal equity argument leads governments to direct resources towards poor households, whether or not they have children, but taking account of their composition. If governments do pursue horizontal equity goals, then families with children benefit both because families’ consumption needs increase and because their ability to do paid work falls as they have children.14 The vertical equity and efficiency arguments both give
rationales for doing more than reducing inequality in living standards having controlled for the composition of the household. The vertical equity case appeals to some unquantifiable pro-parenting sentiment; the efficiency argument is that governments are more worried about the lasting effects of low incomes on children than on adults.
3.2 What is the best way to achieve these aims?
Any government that sets out to achieve these equity and efficiency goals will encounter several issues of practical policy. First, is directing income towards low-income families with children the best way to improve the outcomes or the well-being of children? Second, how should the government best measure the costs of children in order to redistribute income fairly and thereby meet any possible equity aims?
12 Theoretically, increasing the cash given to adults for their children should also increase the birth rate. Certainly, there
are international examples of countries using the tax and benefit system to give incentives to have large families (for example, the French Allocations Familiales are non-means-tested transfers where the amount per child is an increasing function of the number of children). But we do not think that this is an important issue in the UK at this time, and do not discuss it further here.
13 See, for example, Hobcraft (1999), Gregg and Machin (2000a and 2000b), Hills (1999) and Bradshaw and Barnes
(forthcoming).
3.2.1 How closely does children’s well-being relate to family income?
One problem that confronts all governments that want to help children is that governments cannot directly affect children’s own incomes, nor can they even be sure that increasing incomes in families with children will help children’s well-being. In fact, although there is a great deal of evidence that links deprivation as an adult to growing up in a low-income family when a child (see references in footnote 13), there is little UK evidence yet on what impact increasing incomes through extra government transfers has upon children’s well-being. Even if low incomes are linked with adverse outcomes, it need not be the case that increasing family income will improve these outcomes – there may be some hidden factor that is producing the apparent causation (for example, parental characteristics may lead to both higher parental incomes and better child outcomes).
Two recent studies show how the link between family incomes and child poverty may be more complex than first thought. One looked at patterns of spending on over 1,000 children.15 It showed that children in low-income households have broadly similar
amounts of money spent on them as children in higher-income households, but parents in low-income families were much more likely to go without essentials – even regularly skipping meals in some cases – than parents in higher-income families. Another study,16
which looked at poverty defined in terms of a lack of necessities, showed that the link between living in a low-income household and being in poverty was weaker for children than for adults (in other words, children in low-income households were less likely to go without essentials than adults in low-income households).
Both these results suggest that parents tend to protect their children from the effect of low incomes by making sacrifices themselves. If this is happening, then increasing the amount of money going to low-income families with children may help the parents more than the children. As we discuss in Chapter 7, we can expect some improvements in children’s outcomes by redirecting financial support for children to the main carer, rather than the main earner, in couple families. But a proper evaluation of increased financial support for children as an anti-poverty measure would ideally need to compare it with schemes that gave non-financial help to families with children.
This discussion also helps explain why governments provide a great deal of support and assistance for parents and children through public services as well as through income transfers. For example, families with children tend to use the NHS more than families without children, and childcare, nursery schools and education all benefit parents and children more than families without children. It is beyond the scope of this paper, though, to attempt to identify the total value of government help for children: in subsequent chapters, we will focus on the appropriate level of financial transfers through the tax and benefit system, taking the current provision of public services to families with children as given. But it is important to realise that giving parents money is not the only way to help children.
15 See Middleton, Ashworth and Braithwaite (1997).
3.2.2 Measuring the cost of children
We said above that it would be naïve for a government that wanted to achieve greater equality simply to redistribute from large households to small households. This is because a large household needs more income to reach a given standard of living than a smaller household. Without adjusting household incomes, one-person households might seem poorer than, say, four-person households. Social scientists have developed techniques that allow incomes of different-sized households to be compared. This process of adjusting incomes is called equivalisation, as the ‘equivalence scales’ that are estimated allow the living standards of families of different types to be brought into equivalence. Equivalence scales can therefore help governments better identify which households are poor, given their composition, and structure the form of redistribution through the tax and benefit system.
Equivalence scales seek to tell us how the ‘economic well-being’17 of a household varies
with the composition of the household. For example, an equivalence scale provides an answer to the question ‘how much extra resources does a household with a child need to enable it to reach the level of economic well-being it would have without the child?’ (or ‘how much extra resources does a household with a child need before we can say that it is better off – in welfare terms – than an otherwise-equivalent household without a child?’).
A variety of approaches have been used by social scientists to estimate equivalence scales, but one crucial and common weakness of studies that focus on the extra resources needed by families with children is that they tend to treat children merely as a drain on family resources. They therefore do not acknowledge that the majority of those who have children have taken a decision to become parents, and no doubt derive enormous satisfaction from that. There are two broad methods of estimating equivalence scales:
• Some studies attempt to construct a basket of goods and services that would be needed by households of different compositions, and then calculate the differences in costs between these baskets. This is known as the ‘budget standards’ method.
• Another approach is to say that the cost of an extra household member (such as a child) is the amount of money that the newly expanded household would need to achieve the same level of welfare or economic well-being as an otherwise-equivalent household. This method dates back to 1895 and was first used by Engel, and it has been used a great deal by economists since then.
A recent example of the budget standards method that looked at families with children is given in Parker (1999). A survey of studies that used the second, utility-based, method to look at the costs of children is given in Banks and Johnson (1993). Each approach has its strengths, but each has an important limitation.
The drawback of the budget standards methodology is that researchers have to set in advance what criteria they are going to use to define a ‘minimum’ basket of goods and
services. For example, does the minimum relate to physical needs such as clothing, heat and food, or does it include items needed for normal child development and social inclusion? Is the basket an absolute measure that does not change in composition over time, or is it defined relative to the average standard of living? The method therefore calculates the costs of a hypothetical basket of goods which may not be what parents actually buy; this could be seen as an advantage or a disadvantage.
The second, ‘utility-based’, methodology assumes that researchers can measure something that closely approximates ‘economic well-being’. The most common method is to assume that the proportion of total household expenditure spent on food (or food plus other necessities) is a good indicator of well-being, with a higher proportion of total income spent on necessities indicating a lower level of well-being, since rich households generally spend a smaller proportion of their budget on food and necessities than poorer households. But this is an untestable assumption. Also, as we noted above, this method cannot allow for the fact that most families with children chose to have children, presumably because they derive pleasure from being parents, so it cannot make a perfect comparison between two households’ welfare or happiness.
There is an enormous literature, with little consensus, on how to estimate equivalence scales and the results of such studies. There have been fewer examples of the budget standards methodology. But it is possible to make some broad generalisations of the results:
• ‘utility-based’ methods find that a family’s first child seems to cost more than subsequent children (in other words, there seems to be a fixed cost to having children) (see Banks and Johnson (1993, Table 5.3));
• there is good evidence that older children cost more than younger children (see Banks and Johnson (1993, Tables 2.2, 2.3, 2.4 and 5.3), Middleton, Ashworth and Braithwaite (1997) and Parker (1999)).
A related exercise is to look at what parents actually spend on their children: a recent example is given in Middleton et al. (1997). This study found that children had an average of £57 a week spent on them in 1995, £52 of which came from parents. This amount increased with the age of the child, although not by much. Parents on income support spent around 10 per cent less a week on their children than the average for all parents, but this was still far more than the child allowances in income support at the time of the survey and represented a greater proportion of total family income than the average for all families. However, it would be wrong to use these figures as a firm guide as to what the level of government financial support for children should be. Parents choose what they spend on their children, limited, of course, by their income. The fact that the poorest parents spent between £45 and £50 a week on children does not tell us what children cost, as we do not know whether those parents were spending enough – however that is to be defined – on their children.18
18 Although, as we noted above, parents in the poorest families seemed to be making sacrifices in order to be able to
Successive UK governments have used a semi-official equivalence scale – the McClements scale – in publications such as the Department of Social Security’s
Households Below Average Income (HBAI) for a number of years. Because it is used by UK
governments, it tends to be used by academics working on similar issues. But this does not mean that there is any agreement over whether McClements is the right scale.19 The
government’s position is that it will continue to use McClements, but the reasons seem more about the benefits of using a consistent equivalence scale over time and the fact that many of the headline income distribution statistics do not change markedly under different equivalence scales, than they are to do with whether McClements is a good equivalence scale.20
Table 3.1. The McClements equivalence scale
Before housing costs After housing costs
First adult 0.61 0.55
Second adult (spouse) 0.39 0.45
Second adult (other) 0.46 0.45
Third adult 0.42 0.45
Other adults 0.36 0.40
Child aged 0–1 0.09 0.07
Child aged 2–4 0.18 0.18
Child aged 5–7 0.21 0.21
Child aged 8–10 0.23 0.23
Child aged 11–12 0.25 0.26
Child aged 13–15 0.27 0.28
Child aged 16 or over 0.36 0.38
Source: Department of Social Security, 2000a, Appendix 4.
The McClements scale expresses equivalence scales as ratios compared with a reference household.21 The reference household is a (cohabiting or married) couple with no
children, and this has a weight of 1. The weight of any other household gives the ratio of income that is needed, on average, to achieve a similar level of welfare. To calculate the total weight for any other household, the weights of all the individuals in that household are added up. The weights are shown in Table 3.1.22 For example, on the
‘before-housing-costs’ scale, a household consisting of a lone parent with one child aged 3 has a weight of 0.79, and a household of four unrelated adults has a weight of 1.85. This implies that a lone parent with a child aged 3 needs, on average, 79 per cent of the income of a couple with no children to achieve the same standard of living, and a
19 See, for example, Coulter, Cowell and Jenkins (1992), Banks and Johnson (1994), McClements (1977 and 1979) and
Muellbauer (1979a and 1979b).
20 We are drawing our own inferences from the arguments in Appendix 4 in Department of Social Security (1998 and
2000a).
21 Equivalence scales need not be ratios – they could be expressed as absolute amounts of income or as ratios that vary
with income in a non-parametric way (see Banks and Johnson (1993) for some examples of all of these).
22 There are different weights for ‘before-housing-costs’ income and ‘after-housing-costs’ incomes. This is because a
adult household needs 85 per cent more than the couple with no children.23 Two features
of the McClements scale – which we shall return to in Chapter 5 – are that it gives more weight to older children than to younger children and that it assumes that the first child costs no more and no less than the second or third child.
As we said above, the McClements scale is used by the government to calculate income inequality statistics. It was also used to structure the payments in supplementary benefit (the precursor to income support – see Section 3.4), but there is no link now between it and the structure of financial support for the poorest children. This is shown in Table 3.2, which compares the current rates of income support with the McClements scale for different families. It expresses the maximum award of income support for a particular family as a fraction of that received by a cohabiting or married couple with no children. This sort of analysis does not help us assess whether income support payments are sufficient to cover families’ needs; it only helps us assess the structure of income support payments. As people on income support can claim separate help with housing costs, we use the ‘after-housing-costs’ McClements scale. For example, a lone parent with one child aged 3 receives 19 per cent more in income support payments than a couple with no children. But the McClements scale suggests that that family type would need only 73 per cent of the income of a couple to achieve the same standard of living.
Table 3.2. Comparing McClements weights with income support payments
Family type Maximum income support
award relative to couple with no children
McClements weights (after housing costs)
Single adult 0.64 0.55
Couple with no children 1.00 1.00
Couple with one child aged 3 1.55 1.18
Couple with one child aged 3
and one child aged 9 1.93 1.41
Couple with one child aged 9
and one child aged 17 1.94 1.61
Lone parent with one child aged 3 1.19 0.73
Lone parent with one child aged 3
and one child aged 9 1.57 0.96
Lone parent with one child aged 9
and one child aged 17 1.58 1.16
Notes: IS and JSA rates from April 2001. Adults aged 25 or over.
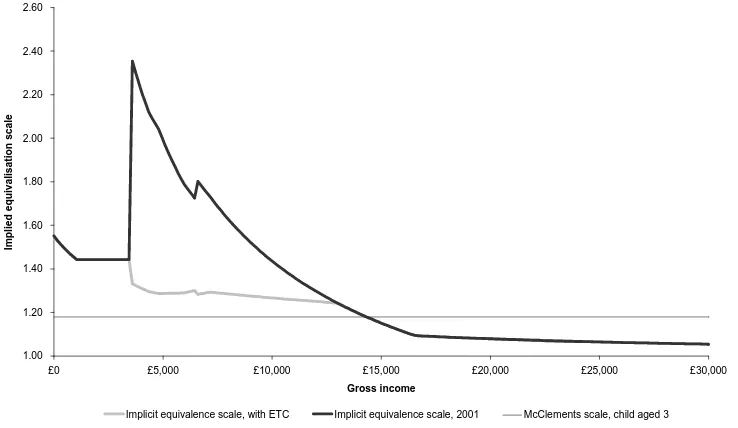
But we have not made an entirely fair comparison in Table 3.2. The McClements scale is implicitly an average of the weights across the population, and we have shown the comparison with financial support for children for the poorest families. Figure 3.1 expands the calculations by showing the ratios of income after tax and benefits of a couple with one child to that of a couple without children under the tax and benefit systems in 2001, and assuming an illustrative employment tax credit for families without
23 When the government calculates inequality statistics in HBAI, it performs this calculation in reverse, by dividing a
children equal to the basic credit in WFTC. It shows that, from April 2001, a couple with children with no gross income (and therefore on income support or jobseeker’s allowance) would have a net income about 55 per cent higher than a couple without children. The same family on a gross annual income of £6,000 would have 89 per cent more net income than a couple without children, and on £20,000, only 8 per cent more. The massive jump in the ratio at around £3,000 represents the generosity of WFTC. This relative generosity to families with children (or relative meanness to families without children) would be reduced if there were an employment tax credit for those without children, as shown by the grey line in Figure 3.1.
Figure 3.1. The equivalence scales implicit in the UK tax and benefit system in 2001 and after an illustrative employment tax credit for those without children
1.00 1.20 1.40 1.60 1.80 2.00 2.20 2.40 2.60
£0 £5,000 £10,000 £15,000 £20,000 £25,000 £30,000
Gross income
Im
p
lied
eq
u
ival
isat
io
n
s
cale
Implicit equivalence scale, with ETC Implicit equivalence scale, 2001 McClements scale, child aged 3
Notes: Figure shows ratio of income of a couple with one child to that of a couple without children after tax
and benefits under the tax and benefit system in 2001, and with an employment tax credit available to people without children at the same rate as the basic credit in WFTC. The family qualifies for WFTC at an annual income that represents 16 hours of work a week at the minimum wage.
Taken together, Table 3.2 and Figure 3.1 show that, although the government is using the McClements scale to adjust household incomes in the inequality statistics in HBAI, it is not explicitly using it to structure financial support for children (although the McClements scale is an average across all families). Compared with the relative weights in McClements, it is directing more resources at younger children, the first child and poorer families.
3.3 Where are children in the income distribution?
Arguments about why governments may choose to help children are backed up by evidence from the UK (as well as other countries) which suggests that families with children predominate at the bottom of the income distribution – even after government transfers. The distributions of income for families with children, for working-age families without children and for pensioners are shown in Figure 3.2. There are around 29 million families in Great Britain:24 around 7.8 million are pensioner families, 7.0 million are
families with children and the other 13.5 million are working-age families without children.
Figure 3.2. Income distribution for families with children, for pensioners and for families without children
Equivalised household income Without children With children Pensioners
0 154.2 500 1000
.006
Notes: Figure shows the estimated income distribution for families based on equivalised household income
before housing costs. Our estimate of 60 per cent of median household income is shown at £154.20 a week. The figure is drawn as a kernel density, which is like a smoothed histogram showing the proportion of families at each level of income. The area under each curve is equal to 1.
Source: Authors’ calculations from HBAI 1998–99 dataset.
All three distributions are skewed, in that there is a long ‘tail’ of high-income households. But families with children (and pensioners) are more concentrated in the bottom end of the income distribution than families without children. The figure also shows that the peak of the income distributions for both pensioners and families with children is close to 60 per cent of median income – one of the government’s low-income indicators – showing that there are a lot of families with children around the poverty line.
There is a striking difference between the income distribution for couples with children and that for lone parents, as Figure 3.3 shows: lone parents are more concentrated around the poverty line than couples with children.25
Figure 3.3. Income distribution for couples with children and for lone parents
Equivalised household income Lone parents Couples with children
0 154.2 500 1000
.008
Notes and Source: See Figure 3.2.
Looking within all families with children, Figure 3.4 shows how families with one or two, three, or more than three children are distributed across the 10 income deciles.26 For
example, around 45 per cent of families with four or more children have incomes that place them in the poorest 10 per cent of all families in the UK, compared with 8 per cent of families with one or two children. Alternatively, the median family for each of these three family types is in a very different part of the income distribution: the median family with one or two children is in decile 6 of the income distribution, the median family with three children is in decile 4, but the median family with four or more children is in decile 2.27
However, the income comparisons in Figures 3.2–3.4 were calculated using equivalised household income, which – as we discussed earlier – reduces the incomes of large households compared with the reference household of a couple with no children. Figure 3.5 presents the proportion of families of different sizes in the unequivalised income
25 These figures use equivalised incomes, and lone parents tend to have smaller households than couples with children,
so if we drew the unequivalised income distribution, it would show an even greater inequality between lone parents and couples with children.
26 We have ranked all families (with or without children) by household income, and then split the income distribution
into 10 equal-sized groups of around 3 million families.
27 For example, there are as many families with four or more children with incomes lower than that of the median
Figure 3.4. Proportion of families with different numbers of children in each equivalised income decile
0% 10% 20% 30% 40% 50%
Poorest 2 3 4 5 6 7 8 9 Richest
Equivalised income deciles
Proportion of families
One or two children Three children More than three children
Note: Deciles were calculated from net weekly household equivalised income. Source: Authors’ calculations based on Family Resources Survey 1998–99.
Figure 3.5. Proportion of families with different numbers of children in each unequivalised income decile
0% 5% 10% 15% 20% 25% 30%
Poorest 2 3 4 5 6 7 8 9 Richest
Unequivalised income deciles
Proportion of families
One or two children Three children More than three children
Note: Deciles were calculated from net weekly household unequivalised income. Source: Authors’ calculations based on Family Resources Survey 1998–99.
households – showing that the equivalisation process tends to move families with children down the income distribution. But the relative position of families of different sizes is similar in both the equivalised and unequivalised distributions: in the unequivalised income distribution, families with four or more children are heavily concentrated in deciles 4–6, families with three children are fairly evenly distributed across deciles 4–10, but families with one or two children are more likely to be found in the top four deciles than any other.
So Figures 3.4 and 3.5 together show that large families are worse off in a welfare sense than families with one or two children both because they have lower average disposable incomes – perhaps because of constraints on the amount of paid work the parents can do – and because the equivalence scale gives them a higher weight (crudely, they have more mouths to feed).
3.3.1 Child poverty in the UK
The proportion of children in relatively low-income households rose dramatically through the 1980s and early 1990s, from 15 per cent in 1980 to 30 per cent in 1990, and has remained consistently high since then (see Figure 3.6, which shows the proportion of children in households with less than 60 per cent of median income since 1968). On a relative measure of child poverty, the UK has one of the highest child poverty rates in the developed world (see UNICEF (2000)). There is also evidence that children are more likely to be in households with persistently low incomes – which probably have a more substantial affect upon children’s well-being then temporary periods of low income – than working-age adults or even pensioners (see Department of Social Security (2000a)
Figure 3.6. Child poverty in the UK
0% 5% 10% 15% 20% 25% 30% 35% 40%
1968 1973 1978 1983 1988 1993 1998
Percentage of children
Children in households with less than 60% median income (after housing costs)
Note: Graph shows the proportion of children in households with less than 60 per cent of median income
after housing costs, one of the government’s poverty indicators (see Department of Social Security (2000b)).
Source: Derived from Family Expenditure Survey data used in Dickens and Ellwood (2000). Similar data are
or Hill and Jenkins (1999)). The analysis is different if we look at the number of children in households with absolute low incomes (for example, the proportion living in households with less than half the 1979 mean household income), but even on that definition, families with children have seen less improvement in real incomes than families without children over the past few decades (see Gregg, Harkness and Machin (1999)).
3.3.2 The effect of recent Budgets on families with children
One of the objectives set by the government for the integrated child credit is ‘to facilitate public debate about the appropriate level of support in the context of the Government’s commitment to abolish child poverty’ (HM Treasury, 2000b). The reforms since 1997 that have directed extra resources to families with children have been progressive, with substantially larger increases – in cash and percentage terms – going to poorer families than to rich families. For example, families in the poorest decile gained over 8 per cent of net income, compared with 2 per cent for families in the middle of the income distribution and less than 1 per cent for the richest families (see Figure 3.7). The only change that has benefited all families has been the increase in child benefit for the eldest child: the other reforms – WFTC, children’s tax credit and increases in means-tested benefits – have all been targeted at a particular part of the income distribution. The government estimates – and independent analysis broadly confirms (see Piachaud and Sutherland (2000)) – that the first-round effect of the tax and benefit reforms will be to reduce the number of children in poverty by around 1 million.
Figure 3.7. The distributional impact of child-related reforms since 1997
0% 2% 4% 6% 8% 10%
Poorest 2 3 4 5 6 7 8 9 Richest
Income deciles
% change in income
Note: The simulation includes the changes in IS and CB, the WFTC reforms and the introduction of the
CTC, but does not include other reforms that have been introduced since 1997. Some of these have had additional impact on income of families with children (such as reforms to income tax and National Insurance: see Myck (2000)). The simulation does not show the effect of abolishing the married couple’s allowance as that affected married couples with and without children equally.
There are a number of ways that the introduction of an integrated child credit could affect child poverty:
• The introduction of a seamless system of financial support may ease the transition from being out of work to being in work, and that may increase the proportion of mothers who work.
• The payment of financial support for children to the mother tends to be associated with better outcomes for children (we discuss this more in Chapter 7).
• The government may increase the real value of financial support for children as it introduces the integrated child credit. It has said already that it hopes that the introduction of an integrated child credit will encourage a debate about the level of financial support for children in the context of its commitment to abolish child poverty.
3.4 The history of financial support for children in the UK
Having set out the broad principles of why governments direct financial support to families with children, it is worth looking at the history of financial support for children in the UK tax and benefit system. Table 3.3 gives a concise timeline.
Extra tax allowances for families with children were introduced in 1909, although these only benefited the very small proportion of the population that then paid income tax. The first national scheme to direct support to families with children began in the late 1940s, with the introduction of family allowance – a means-tested, taxable benefit paid to families with two or more children. In 1977, family allowance was replaced by the flat-rate, non-taxable, child benefit, and the child tax allowances were phased out over the next two years. This change was to ensure that non-taxpayers were not missing out on financial support for children and also reflected a desire to pay support to the main carer. Extra targeted supplements for children living in out-of-work families began in the national assistance (1948) and supplementary benefit (1966) systems – the previous unemployment assistance payments did not vary with family size – and continued in income support (1988). In-work benefits for low-income families with children began in 1971 with family income supplement, replaced in 1988 by family credit and in 1999 by working families’ tax credit. The table shows that, for many decades, past governments have used a mixture of means-tested benefits, support through the tax system and universal payments.
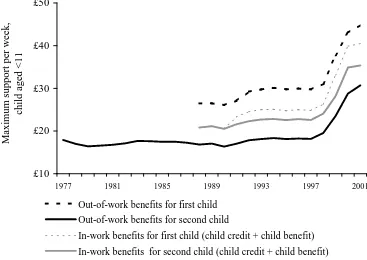
The changing real value of support for children aged under 11 is shown in Figure 3.8. The real value of the child allowance in supplementary benefit and income support hardly changed between 1977 and 1997, but it has risen by over two-thirds since then (this is the amount that out-of-work families get for the second and subsequent children, shown by the solid black line). The real value of the equivalent for low-income working families is slightly higher than the value for out-of-work families, reflecting the loss of
Table 3.3. Timeline of financial support for children in the UK, 1900–2001
1900s–1950s 1960s–1970s 1980s 1990s onwards
Universal,
non-means-tested payments Child benefit introduced (1977) Higher rate for eldest child introduced (1991)
Support through the tax
system families with children (1909) Larger tax allowances for
Child tax allowances introduced (1948)
Child tax allowances abolished
(1977–79) Individual system of income tax introduced (1990)
Children’s tax credit replaced married couple’s and related
allowances (2000–01)
Means-tested benefits Unemployment Assistance
Board Act (1934)
National assistance (NA) and family allowance introduced
(1948)
Supplementary benefit (SB) replaced NA (1966)
Family allowance abolished (1977)
Income support (IS) replaced
SB (1988) IS for couples with children and Jobseeker’s allowance replaced
adults without children (1996)
Rates of child premiums equalised for all children under
16 (1998–2000)
In-work benefits Family income supplement
(FIS) introduced (1971) Family credit (FC) replaced FIS (1988) Working families’ tax credit replaced FC (1999)
Rates of child credits equalised for all children under 16 (1998–
Figure 3.8. The changing real value of financial support for children
£10 £20 £30 £40 £50
1977 1981 1985 1989 1993 1997 2001
Maximum support per week,
child aged <11
Out-of-work benefits for first child
Out-of-work benefits for second child
In-work benefits for first child (child credit + child benefit)
In-work benefits for second child (child credit + child benefit)
Notes: Y-axis shows support for children (assumed aged under 11), averaged over the financial year,
deflated using the all-items RPI. For out-of-work benefits, data do not include the value of free school meals. For in-work benefits, the value is child credit plus child benefit. Support through the tax system is not shown.
Source: Authors’ calculations.
free school meals (shown by the solid grey line).28 The dashed grey line represents the
value of child-related support for the first child for low-income working families, and shows the effect of the higher rate of child benefit for the first child. The dashed black line shows the value of support for the first child in out-of-work families: these families see no gain from child benefit but do benefit from changes in the family premium in income support.
The two black lines can be interpreted as the extra amount of financial support received by out-of-work families for the first (dashed line) and subsequent (solid line) children. The two grey lines, though, do not include the basic credit in family credit, and so underestimate the total additional financial support received by low-income working families when they have children.
3.5 Systems for directing financial support to families with children in other developed countries
Having seen the complexity of the UK’s system of financial support for children – with the mixture of means-tested benefits, non-means-tested benefits, tax credit and tax
28 The pre-1988 family income supplement is not directly comparable to the post-1988 systems and is therefore not
Box 3.1. Three other countries’ systems for financial support for children
In Australia, a single family tax payment is paid to all but the richest 10–15 per cent of families. About half of the recipients receive the payment at a top rate, most of the rest at a single lower rate. Families with only one earner get more; this supplement is higher for those with children under five. The system, introduced in 2000, is the product of years of reform and simplification. People on low and middle incomes receive stable payments for their children, but other benefits and taxes for people on lower incomes are redistributive, with high withdrawal rates as income rises. Australia has, through the tax and benefit system, managed to limit the growth in inequality after taxes and benefits, while avoiding high marginal deduction rates on payments for children.
In Canada, a federal child tax benefit is paid directly to the great majority (soon it will be about 90 per cent) of families. Only the poorest – on below 46 per cent of average family income – get the maximum rate, but the withdrawal rates are very low: 2.5 per cent of income for families with one child and 5 per cent for other families. This federal benefit is progressively replacing provincial social assistance payments for low-income households. By making benefits to children available to a large majority of families, Canada is aiming to promote social cohesion. The administration of the benefit through the income tax system is intended to reduce stigma.
The US has no single benefit to support families with children. Taxpayers get a tax allowance of $2,750 per child and a non-refundable credit against income tax liability of $500 per child, and may get a larger personal allowance. Families with children on low earnings are eligible for the earned income tax credit. There is no universal equivalent of the income support safety net, but states give various forms of assistance to non-working parents and to those participating in welfare-to-work programmes. This system puts great emphasis on encouraging and rewarding work, but less on relieving poverty. It has worked reasonably well in times of plentiful jobs, but has not yet been tested (since the big 1996 welfare reform) in a downturn or recession.
Sources: Battle and Mendelson, 2001; Hirsch, 2000.
allowances – it can be appreciated that making comparisons across countries is not simple. But there are lessons to be learnt from other countries that have attempted to reform their systems of financial support for children using similar strategies in recent years. A recent study part-funded by the Joseph Rowntree Foundation looked at three other countries with systems and recent developments most similar to the UK’s. The results are summarised in Box 3.1.29
29 The most recent definitive EU comparison dates from 1996 (Ditch et al., 1998). MISSOC (1999) details social
4.
How should we judge the success of an integrated child credit?
As we saw in Chapter 3, the structure and administration of the current system of financial support for children are a result of the evolution of different channels of assistance over several decades. The government now aims to correct what it sees as the weaknesses of the current design through the introduction of the integrated child credit. However, the current system has evolved to ensure that particular objectives are met, and there is a strong case for making sure that these are also achieved by the integrated child credit.
We discuss below some general principles that we would expect the tax and benefit system to seek to adhere to, and we assess how well these are met in the current system of financial support for children. The discussion highlights some desirable features of the current system that we think the government will want to preserve in a new system of assistance. Later, we will analyse concrete options for an integrated child credit in the next two chapters: in Chapter 5, we discuss the structure of the current system and possible structure of an integrated child credit, and Chapter 6 looks at the details of payment administration. By the structure, we mean how the integrated child credit relates to family structure and family income. By administration, we mean parameters such as how entitlement is assessed, the frequency of payments, the period of award and the means of payment.
4.1 Objectives for the integrated child credit
The government saw the overlap between taxes and benefits – the fact that some families both pay taxes and receive means-tested benefits – as a sign of failure in the tax and benefit system and as a rationale for reform when it introduced WFTC (see HM Treasury (1998)). Designing the integrated child credit afresh certainly gives the government a great opportunity to rationalise the rules in the existing mechanisms for directing financial support to children, which have each evolved individually over time to achieve their different objectives. On the other hand, there may well have been good reasons why the tax system and safety-net benefit systems have evolved separately. This point has been long recognised: Dilnot, Kay and Morris (1984) argue that it is an advantage to have people who both pay tax and receive benefits because it ‘may be desirable to award benefits on a basis which discriminates more carefully between different types of households than is appropriate for tax credits’.
well-targeted mechanisms for providing financial support for children to just one covering all families in the UK.
The government has said that an integrated child credit will provide (see HM Treasury (2000b)):
i. ‘a more transparent system of support for children, helping parents understand what they can expect to receive, and facilitating public debate about the appropriate level of support …;
ii. ‘a portable and secure income bridge spanning welfare and work to improve work incentives …;
iii. ‘a common framework for assessment and payment, where all families will be part of the same system, rather than dealing with low-income families through the benefits system while giving tax allowances to the better-off. Awards would be assessed on the joint income of couples;
iv. ‘a system where support for children is paid to the main carer …;
v. ‘efficiency gains for Government, and reduced hassle for parents, from moving away from a system where support for children is delivered through four different mechanisms’.
The other, more general, objectives that we think should apply to all parts of the tax and benefit system are:
a) ensuring the existence of a safety-net system, by getting payments to those in greatest need with minimal delay;
b) preserving work incentives, by ensuring both that work pays financially and that marginal withdrawal rates for families in work are not too high;
c) guaranteeing fairness (or equity) between families of similar resources and needs;
d) reducing unnecessary government expenditure, by targeting money on those that need it most, and avoiding fraud;
e) minimising administrative costs, particularly with the aim of ensuring take-up rates as high as possible;
f) avoiding over-payment to parents who may have difficulties in repaying it.
4.2 How does the current system rate when assessed on these criteria?
Below, we discuss to what extent the broad objectives above are met by the current system of financial support for children.