Response of Native Vegetation of the Central
Great Plains to Applications of Corral
Manure and Commercial Fertilizer
G. E. KLIPPLE AND JOHN L. RETZERlRange Conservationist, Agricultural Research Service, U. S. Department of Agriculture, Fort Collins, Colorado; and Soil Scientist, Rocky Mountain Forest and Range Experiment Station, Forest Service, U. S. Department of Agriculture, Fort Collins, Colorado
Production of palatable herb-
age by native vegetation on the
central Great Plains is low. For
example, average production by
palatable grasses from 1940 to
1956 on the Central Plains Ex-
perimental Range2, Nunn,-Colo-
rado, was less than 600 pounds
air dry per acre. Preliminary
trials conducted on the Northern
Great Plains have indicated that
yields could be increased by the
application of corral manure and
commercial fertilizer to the na-
tive range vegetation.’ The re-
sponse of the vegetation on the
Central Great Plains to such
treatments is reported herein.
In southern
Saskatchewan,
Canada, y i e 1 d s of short-grass
vegetation were
more
than
doubled for a 6-year period by a
single application of corral ma-
nure at the rate of 12 tons per
acre (Clark et al., 1943). Annual
rainfall on the study area aver-
aged 12 inches, an amount com-
parable with that at the Central
Plains Experimental Range. Re-
1
Formerly with the Rocky Mountain Forest and Range Experiment Sta- tion, Forest Service, Fort Collins, Colorado.2 Operated by Crops Research Divi- sion, AgricuZturaZ Research Service, in cooperation with the Forest Service, U. S. Department of Agri- culture. Formerly operated by the Rocky Mount,ain Forest and Range Experiment Station, Forest Service, in cooperation with the Soil Con- servation Service, U. S. Department of Agriculture.
peated applications of corral ma-
nure at 2-, 3-, and 4-year inter-
vals increased yields
of blue
grama (Bouteloua gracilis) by
250 to 300 percent, while western
wheatgrass
(Agropyron smithii)yields averaged 150 percent of
the yields from untreated vege-
tation.
Applications of nitrate and
phosphate to native vegetation
on the Great Plains region-of
southern Canada were discussed
by Clark and Tisdale (1945).
Nitrates increased yields 32 to
36 percent but did not increase
the protein content significantly.
Phosphates did not increase
yields but did increase the phos-
phorus content of the herbage.
Significant increases in yields
of dry herbage, chiefly western
wheatgrass, were obtained from
annual topdressings of nitrogen
on native range at 2 rates during
a 6-year study in central North
Dakota (Rogler and Lorenz,
1957). Average annual precipi-
tation at this location was near
18 inches for the period of study.
Materials and Methods
Fertility studies were estab-
lished in northeastern Colorado
in 1951, 1952, and 1953 on the
Central Plains Experimental
Range operated by the Agricul-
tural Research Service in coop-
eration with the U. S. Forest
Service. The study area of ap-
proximately 40 acres had a uni-
form stand of native vegetation.
It was located in a 600-acre pas-
239
ture that had been used for sev-
eral years as a holding pasture
for cattle. This pasture had been
grazed for about a week each
spring and fall. Stocking rates
were relatively high, and the
utilization had averaged nearly
40 percent by weight of the an-
nual production of blue grama
and buffalograss (Buchloe dacty-
Zoides) each year.
The density and composition
of the native vegetation on Aug-
ust 1, 1952, are given in Table 1.
Blue grama made up more than
88 percent of the total vegeta-
tion cover. Buffalograss, second
among the grasses, furnished
only 1.74 percent of the total
cover. Two browse species, four-
wing saltbush
(Atriplex cune- scens)and plains pricklypear
(Opuntiu
polyucunthu)each pro-
vided more of the ground cover
than did buffalograss. Scarlet
globemallow
(Sphuerulceu coc- cineu),a palatabl e perennial
forb, was the only other species
that furnished 1 percent more of
the total cover.
G. E. KLIPPLE AND JOHN L. RETZER
Table 1. Average density and percentage composition of vegetation on range fertility study area, Augusi 1, 1952.
-_______
Botanical group and species ___-- -______ ..__ Density Percent
Composition Percent
-- ___~- --~
Grasses and -grasslike plants: Blue grama
Buffalograss Needle-and-thread Red three-awn Sand dropseed Threadleaf sedge Western wheatgrass
Total Forbs:
Goosefoots
Pale evening-primrose Russian thistle Scarlet globemallow Slenderbush eriogonum Tansyleaf aster
Total Browse:
Broom snakeweed Fourwing saltbush Plains pricklypear
Total
All vegetation
fine sandy loam or loamy fine sand that is highly calcareous. These Ascalon soils are sandy and absorb water readily. They also release a large percentage of water to growing plants. They are well suited to growing grass in this dry climate, where much of the rain falls in high-intensity small storms of less than 0.75 inch.
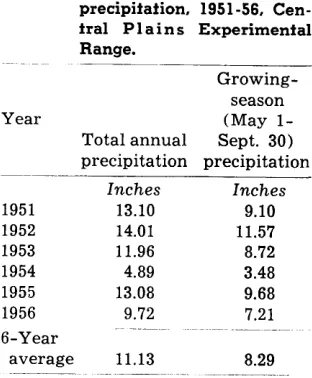
Climatic conditions during these fertility trials were nor- mal except for the acute drought of 1954. The 6-year (1951-56) av- erage annual precipitation was 11.13 inches (Table 2). The 18- year (1939-56) average for the same area was 11.67 inches.
Well-rotted cattle manure was topdressed on a 6-acre area at the rate of 10 tons to the acre in the summer of 1951. As deter- mined by standard laboratory analyses the manure contained 85 pounds of total nitrogen, 92 pounds of available phosphoric acid, and 84 pounds of water- soluble potash per acre.
8.10 88.23
0.16 1.74
0.04 0.44
0.08 0.87
0.02 0.22
0.01 0.11
0.03 0.33
___~
8.44 91.94 _
0.02 0.22
0.06 0.65
0.03 0.33
0.10 1.09
0.03 0.33
0.05 0.54
-______
0.29 3.16
0.04 0.43
0.20 2.18
0.21 2.29
0.45 4.90
9.18 100.09
On April 27, 1952, seven com- mercial fertilizers were top- dressed without replication on plots 8 by 50 feet. They were nitrogen (N) , potassium (K) , phosphorus (P) , and the com- binations NPK, NK, NP, and PK. A 12-foot border strip separated the plots. The rates per acre were 67 pounds of nitrogen in ammonium nitrate (NH~NO:I) , 100 pounds of phosphorus in phosphoric oxide (PROS), and 150 pounds of potassium in potas- sium chloride (KCl). These plots were not grazed until 1957.
On April 15, 1953, five ferti- lizer treatments (N, NP, NPK, P, and K), and two check treat- ments were established in two replications each on plots 10 feet wide by 300 feet long. The ferti- lizers were drilled into the na- tive soil to a depth of 3 inches. The empty drill was run through the sod on one set of check plots, while the other set was un- treated. The application rates in pounds per acre were N, 80; P,
100; and K, 200. These plots were protected from grazing through 1956.
Yield measurements were ob- tained from the manured and the untreated native range areas in 1952, 1953, and 1956. The drilled fertilizer and check plots were sampled for yields in 1953 and again in 1956. The vegetation on each of the treated and check plots was examined by the square-foot-density method in early September 1956; 20 sample plots of 25-square feet area were used for each of the 10 fertility and grazing management treat- ments.
Observations and Resulfs Vegetation Growfh
Growth of vegetatior varied widely from vear to year during these trials. The manure was ap- plied too late in 1951 to influence vegetation growth that year, but in 1952 the growth of the short grasses was more luxuriant on the manured area than on the untreated native range. The mid- grass species did not respond to the manure treatment.
The plots topdressed with commercial fertilizer in 1952 showed no observable differ- ences in volume of growth that year. The vegetation on plots re- ceiving nitrogen retained a green color about 10 days longer than
Table 2.
Year
Growing- season
(May l- Total annual Sept. 30) precipitation precipitation
Inches Inches
13.10 9.10
14.01 11.57
11.96 8.72
4.89 3.48
13.08 9.68
9.72 7.21
1951 1952 1953 1954 1955 1956 g-Year
average 11.13 8.29
._____ ~__
RESPONSE OF NATIVE VEGETATION TO FERTILIZER 241
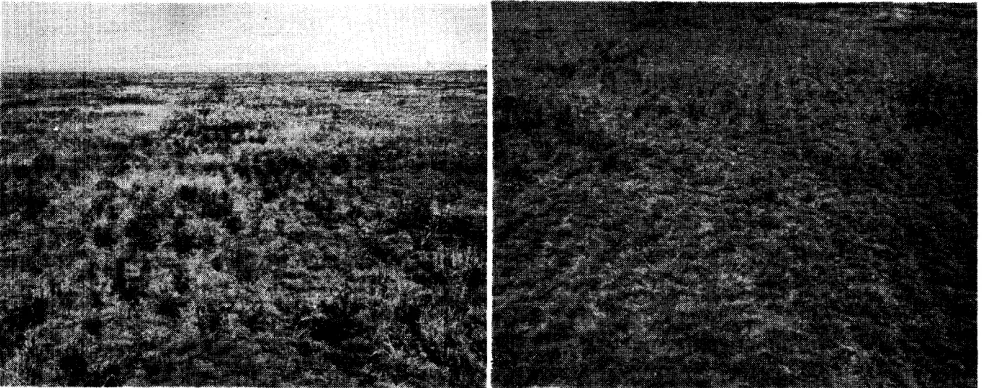
FIGURE 1. Left: Plot with nitrogen drilled into native sod in 1953. Right: Plot drilled only in 1953. Photographed in 1956.
that on other plots. The short grasses on the manured area stayed green approximately a week longer than they did on the nitrogen-treated plots.
The vegetation on the ma- nured land began growth about 2 weeks earlier in 1953 than that on the untreated range. The cattle held in the pasture dur- ing the first week of May con- gregated on the manured area and made heavy use of the old and new growth of forage grasses; whereas, the” adjoining untreated range was only lightly grazed during the same period. Part of both the manured and the untreated range were fenced during the summer of 1953 to ex- clude grazing.
Vegetation on the plots top- dressed with nitrogen in 1952 and on those drilled with nitro- gen in 1953 had a decided burned appearance by the last week of July 1953. One-half inch of rain fell on July 30, and 2% inches were received in a high-intensity storm on August 21. Blue grams and buffalograss greened up promptly after the August storm and produced some new leaf growth on all plots. New growth was more luxuriant on the nitro- gen plots than on other plots. A fair crop of blue grama seed- stalks also developed on the nit-
rogen plots but not on other plots. Western wheatgrass and needle-and-thread (Stipa com- ata) had matured before the August storm and made no ap- preciable new growth that fall under any treatment.
The spring of 1954 was very dry. Cool-season species such as western wheatgrass and needle- and-thread did not produce new shoots. Old-growth vegetation was grazed from the unfenced study area. Blue grama and buffalograss root crowns pro- duced a few new shoots on the manured range, but new growth was not found on any other part of the study area in 1954. Old vegetation remaining from the 1953 crop stood on the protected areas all summer and fall with- out apparent disintegration. Much of this old growth disap- peared during the high-velocity windstorms early in 1955.
There was no grazing on the plots in the spring of 1955, and new growth was late. Live plants of western wheatgrass and needle-and-thread were found only occasionally. Many of the root crowns of blue grama and buffalograss appeared to be dead. The areas of apparently dead vegetation were more extensive on the manured than on the un- treated area. The plots treated
with commercial nitrogen in 1953 appeared to have less dead vegetation than the check plots. The nitrogen plots produced a crop of blue grama seedstalks in the fall of 1955, following heavy rains in late August and mid- September, but yield samples were not obtained.
Abundant growth of annual forbs, especially Russian thistle (SaZsoZa kali var. tenuifolia) and s u m m e r-cypress (Kochia scop- aria) developed in 1955 on all the plots. This forb growth was much heavier on the manured area than on the untreated na- tive range. The growth of an- nuals was taller on the nitrogen plots but somewhat less dense than that on some of the other plots among the fertilizer treat- ments.
Observation in 1956 showed changes from 1955. The mortal- ity of short grasses from 1955 to 1956 on all the nitrogen plots ap- peared to be more severe than it had been from 1953 to 1955. The grasses on the check plots and potassium plots had little if any new mortality, and those on the phosphorus plots appeared to have made some recovery.
242 G. E. KLIPPLE AND JOHN L. RETZER
dropseed (Sporobolus cryptandms)
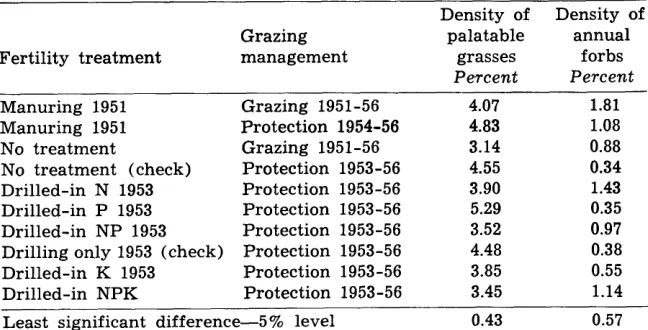
of the grasses was not materi- ally greater than that on the untreated plots (Table 3) . Den- sity and growth of annual forbs on the nitrogen plots were greater than on the phosphorous, potassium, or check ‘plots (Fig- ure 1). Competition from grasses on the phosphorus and check plots may have reduced the growth of annual forbs. This does not hold, however, for com- parison between the potassium and the nitrogen plots. The 1956 vegetation cover on the plots treated with nitrogen in 1953 was definitely poorer than it was on all other plots except the grazed untreated range. Protection from grazing 1953 to 1956 helped the grasses to maintain their stand on both the manured and the un- treated native range.
Drought Effects
The acute drought of 1954 caused a heavy mortality of some grasses and perennial forbs, and increases in the density of an- nual forbs, (Tables 1 and 3). These drought reactions varied among the different fertility treatments. Application of nitro- gen and potassium increased the mortality of grasses over that suffered from applications of manure and phosphorus unac- companied by nitrogen.
Nitro-
Table 3. Densiiies of palatable grasses1 and annual forbs in 1956 following manuring in 1951 and drilled-in fertilizer in 1953.
Density of Density of
Grazing palatable annual
Fertility treatment management grasses forbs
Percent Percent
Manuring 1951 Grazing 1951-56 4.07 1.81
Manuring 1951 Protection 1954-56 4.83 1.08
No treatment Grazing 1951-56 3.14 0.88
No treatment (check) Protection 1953-56 4.55 0.34 Drilled-in N 1953 Protection 1953-56 3.90 1.43 Drilled-in P 1953 Protection 1953-56 5.29 0.35 Drilled-in NP 1953 Protection 1953-56 3.52 0.97 Drilling only 1953 (check) Protection 1953-56 4.48 0.38 Drilled-in K 1953 Protection 1953-56 3.85 0.55
Drilled-in NPK Protection 1953-56 3.45 1.14
Least significant difference-5% level 0.43 0.57 IBlue grama plus very small amounts of needle-and-thread and sand
gen and manure stimulated the production of annual forbs sev- eral years after the applications were made.
Individual species also reacted differently to the fertility treat- ments during the drought period. Buffalograss and western wheat- grass practically disappeared from all the plots. Blue grama suffered an average loss of one- half its density 1952 to 1956, but the density losses varied signifi- cantly among the fertility and grazing treatments. Needle-and- thread lost density on the grazed, untreated range; on manured plots, both, grazed and protected 1954-56; and on protected plots with drilled-in N and NP. It in- creased in density on untreated range protected 1953-56 and on plots that received drilled-in P,K and NPK in 1953. Scarlet globemallow lost density on all plots but it was much less severe on the protected plots treated with NP and NPK in 1953.
Herbage Yields
The 1952 yields from the short grasses were 1,235 pounds of air- dry herbage per acre on the ma- nured range and 805 pounds on the untreated range. This 430- pound difference was highly sig- nificant. The midgrasses did not respond to the manure treat- ment. Their combined yield was
only 28 pounds per acre on the manured range and 38 pounds on the untreated range.
Yield samples were clipped August 31 and September 1, 1953 and in mid-September 1956 from all of the fertility and check plots. Short-grass yields and
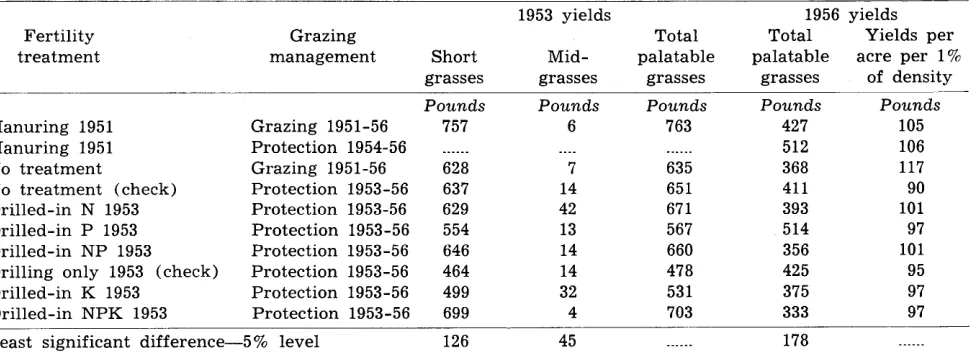
midgrass yields were sampled separately in 1953, but they were not separated in 1956 owing to the very small yields from mid- grasses. Significant increases in short-grass yields over those of the drilled check plots were ob- tained in 1953 from all drilled-in fertilizer applications containing nitrogen (Table 4). The short- grass yield from untreated plots also was significantly larger than the yield from the drilled check plots, indicating that the drilling was unfavorable. The fertilized plots did not outyield the un- treated check plots, but the yield of short-grass herbage from the grazed manured plots was sig- nificantly larger than the yield from the grazed untreated plots. Midgrass yields were erratic and showed no specific effects from fertilization.
Yields from the palatable grasses were smaller in 1956 than in 1953. Differences among yields from the several treat- ments, however, were significant again in 1956. The yields per unit area of grass density were not widely dispersed and they indi- cate little carryover of fertility effects from 1953 to 1956. Differ- ences in density of palatable grasses influenced the variation in yields.
Effecfs on Nufrienf Confenf of Herbage
Protein and phosphorus defi- ciencies are critical nutritional factors in mature blue grama forage. Composite samples of mature blue grama herbage were
RESPONSE OF NATIVE VEGETATION TO FERTILIZER 243
Table 4. 1953 and 1956 yields of air-dry herbage per acre from palatable grasses by feriilify and grazing freaf- menfs, and yields per acre per 1 percent of densify of palatable grasses in 1956.
1953 yields 1956 yields
Fertility Grazing Total Total Yields per
treatment management Short Mid- palatable palatable acre per 1%
grasses grasses grasses grasses of density
Pounds Pounds Pounds Pounds Pounds
Manuring 1951 Grazing 1951-56 757 6 763 427 105
Manuring 1951 Protection 1954-56 ______ _.__ ___._. 512 106
No treatment Grazing 1951-56 628 7 635 368 117
No treatment (check) Protection 1953-56 637 14 651 411 90
Drilled-in N 1953 Protection 1953-56 629 42 671 393 101
Drilled-in P 1953 Protection 1953-56 554 13 567 514 97
Drilled-in NP 1953 Protection 1953-56 646 14 660 356 101
Drilling only 1953 (check) Protection 1953-56 464 14 478 425 95
Drilled-in K 1953 Protection 1953-56 499 32 531 375 97
Drilled-in NPK 1953 Protection 1953-56 699 4 703 333 97
Least significant difference-5% level 126 45
tions of phosphorus and calcium content. The protein content of herbage from the nitrogen plots (7.9 percent, dry basis) was only slightly higher than that of herb- age from the untreated range (7.1 percent). This indicated no effect from nitrogen fertilization on the protein content of the ma- ture herbage after 3 years from treatment. The protein content of herbage from the manured range (10.7 percent) and that from phosphorus-treated plots
(10.9 percent), however, were definitely greater than that of the herbage from the. untreated range. The protein content of herbage from the nitrogen-phos- phorus plots (9.4 percent) was intermediate between that of herbage from the nitrogen plots and the phosphorus plots.
Herbage from the manured plots was lowest in phosphorus content (0.13 percent) and that from the nitrogen-treated plots (0.16 percent) was next to the lowest. Herbage from the phos- phorus-treated plots had no higher phosphorus content (0.18 percent) than that from the un- treated range (0.19 percent). The phosphorus-calcium ratios for these five samples were in the narrow range of 1: 2.2 to 1: 3.2.
Discussion and Conclusions These fertility trials indicate
that in the central Great Plains region ranch-produced manure can be applied to short-grass ranges with favorable results. Heavy applications of commer- cial fertilizer increased yields less than 100 pounds of air-dry herbage per acre under the con- ditions of this study. Fertilizer applications are not economically feasible with such small in- creases in herbage production. Applications of commercial fer- tilizers to native ranges, there- fore, are not recommended for areas of the Central Plains that receive low precipitation such as that received by the study area.
Summary
Manure and several commer- cial fertilizer treatments were applied to a good stand of native short-grass vegetation on the Central Plains Experimental Range in northeastern Colorado during 1951, 1952, and 1953. The longtime average annual rain- fall for the study area is about, 12 inches. The rainfall during the study period was comparable to the longtime average, except for an acute drought, in 1954. General observations were made each year from 1952 to 1956, and plot records of density and herb- age production were taken in 1952, 1953, and 1956. Fodder
______ 178 _---__
analyses of the mature blue grama herbage from plots that had received four of the fertility treatments and from the un- treated plots were made in 1956.
Manuring was the most effec- tive treatment. It increased herb- age yields 15 to 50 percent. Yields from plots treated with commer- cial fertilizers seldom exceeded those from the untreated native range. Commercial nitrogen ap- plied in 1953 had little, if any, ef- fect upon the protein content of blue grama herbage produced in 1956. Manure and phosphorus treatments improved the protein content of blue grama herbage. Manure and nitrogen reduced the phosphorus content, but phos- phorus fertilization gave little increase in the phosphorus con- tent of the herbage.
LITERATURE CITED
CLARK, S. W. AND E. W. TISDALE. 1945. The chemical composition of native forage plants of southern Alberta and Saskatchewan in re- lation to grazing practices. Can- ada Dept. Agr. Tech. Bul. 54. Pub. 769. pp. 44-45.
, E. W. TISDALE AND N. A. SKOGLUND. 1943. The effects
of climate and grazing practices on short-grass prairie vegetation. Canada Dept. Agr. Tech. Bul. 46. pp. 50-51.