© The Authors, published by EDP Sciences. This is an open access article distributed under the terms of the Creative Commons EPJ Web of Conferences 214, 02013 (2019) https://doi.org/10.1051/epjconf/201921402013 CHEP 2018
Virtual Reality and game engines for interactive data
visu-alization and event displays in HEP, an example from the
ATLAS experiment
Riccardo Maria Bianchi1,∗, Claire Adam Bourdarios2, Michael Hovdesven3, and Ilija Vukotic3,∗∗, on behalf of the ATLAS Collaboration
1University of Pittsburgh,US
2LAL, Univ. Paris-Sud, CNRS/IN2P3. Orsay,FR 3University of Chicago,US
Abstract. Interactive 3D data visualization plays a key role in HEP experi-ments, as it is used in many tasks at different levels of the data chain. Outside
HEP, for interactive 3D graphics, the game industry makes heavy use of so-called “game engines”, modern software frameworks offering an extensive set
of powerful graphics tools and cross-platform deployment. Recently, a very strong support for Virtual Reality (VR) technology has been added to such en-gines. In this talk we explore the usage of game engines and VR for HEP data visualization, discussing the needs, the challenges and the issues of using such technologies. We will also make use of ATLASrift, a VR application developed by the ATLAS experiment, to discuss the lessons learned while developing it using the game engineUnreal Engine, and the feedback on the use of Virtual Reality we got from users while using it at many demonstrations and public events.
1 Introduction
Most High Energy Physics (HEP) experiments are built underground or in confined and re-stricted areas. They are not accessible most of the time, not only by the public but also by the physicists themselves, especially while taking data. Recent Virtual Reality (VR) technologies ease the development of 3D environments with a high degree of resolution, letting developers create highly immersive experiences. Thus, these technologies can be used to create accurate visualization tools, to let the public and the scientists access and visit, although virtually, the experiments and the experiments’ sites.
In this paper we present the most recent additions to the ATLAS experiment [1] VR application ATLASrift [2], in terms of features and content. Moreover, we summarize the advantages and disadvantages of using a modern game engineto create an immersive VR experience for HEP; in particular, we will discuss the lessons learned while developing and deploying ATLASrift.
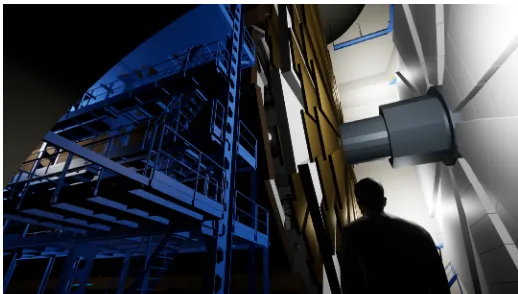
Figure 1.The ATLASrift “Experiment” level: a view of a side of the virtual experimental site from the cavern’s floor and the end-caps of the ATLAS detector.
2 ATLASrift — An immersive and interactive world
The ATLASrift [2] project started in 2015, to create a VR experience of the detector and the experimental site of ATLAS. ATLASrift—whose name is based on the name of one of the first VR devices that were available to the market, Oculus Rift [3]—, lets the user visit the ATLAS detector and the experiment’s site in an immersive and interactive way, with first person point-of-view perspective.
It has been used in public outreach events, in science fairs, and in events organized by the institutes participating in the ATLAS Collaboration around the world. It has also been used for public relations and in events with funding agencies and governments’ representatives.
Along the years, new content and features have been added to ATLASrift, mainly for data visualization—display of event data and optimized rendering of physics objects—and for outreach—posters and videos with educational content.
ATLASrift lets users visit ATLAS by offering three environments—or levels, using the
terminology used by game engines—for the user to freely explore: the “Experiment” level, the “Control Room” level, and the “Globe” level.
In the “Experiment” level, the first developed, the user can “fly” around and inside the detector (see Figure 1), besides visiting the whole underground experiment’s cavern and its annexes (shafts, service halls, passageways, scaffolds, etc.); the user can also enable or disable
the view of the different parts of the ATLAS detector, or make them transparent, to be able to
selectively view the different sub-systems (inner detector, calorimeter, muon chambers, etc.).
In this level, a new feature has recently been added. In different points of the cavern, or in the
service halls, blue spheres which act as switches have been placed. When the user gets close to them, a panoramic view is activated, which shows a 4πpicture of the environment taken from the place where the sphere was placed in the virtual world. In that way, users can look at what looks like a photographic rendering of the site around them, without the need for the developers to build a realistic 3D view of the place. Figure 2 shows a blue sphere in a service tunnel, which activates the panoramic view of the computer racks.
Recently, two new levels have been added. The “Control Room” level offers a very
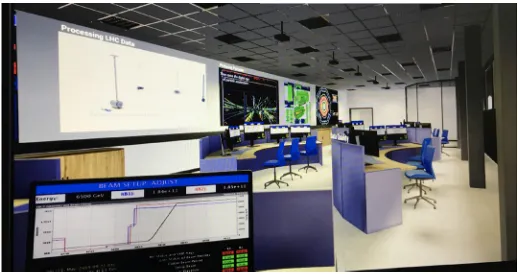
real-istic reconstruction of the ATLAS control room (see Figure 3): the user can walk through the desks, looking at different panels showing approved plots related to the data-taking and
EPJ Web of Conferences 214, 02013 (2019) https://doi.org/10.1051/epjconf/201921402013 CHEP 2018
Figure 1.The ATLASrift “Experiment” level: a view of a side of the virtual experimental site from the cavern’s floor and the end-caps of the ATLAS detector.
2 ATLASrift — An immersive and interactive world
The ATLASrift [2] project started in 2015, to create a VR experience of the detector and the experimental site of ATLAS. ATLASrift—whose name is based on the name of one of the first VR devices that were available to the market, Oculus Rift [3]—, lets the user visit the ATLAS detector and the experiment’s site in an immersive and interactive way, with first person point-of-view perspective.
It has been used in public outreach events, in science fairs, and in events organized by the institutes participating in the ATLAS Collaboration around the world. It has also been used for public relations and in events with funding agencies and governments’ representatives.
Along the years, new content and features have been added to ATLASrift, mainly for data visualization—display of event data and optimized rendering of physics objects—and for outreach—posters and videos with educational content.
ATLASrift lets users visit ATLAS by offering three environments—orlevels, using the
terminology used by game engines—for the user to freely explore: the “Experiment” level, the “Control Room” level, and the “Globe” level.
In the “Experiment” level, the first developed, the user can “fly” around and inside the detector (see Figure 1), besides visiting the whole underground experiment’s cavern and its annexes (shafts, service halls, passageways, scaffolds, etc.); the user can also enable or disable
the view of the different parts of the ATLAS detector, or make them transparent, to be able to
selectively view the different sub-systems (inner detector, calorimeter, muon chambers, etc.).
In this level, a new feature has recently been added. In different points of the cavern, or in the
service halls, blue spheres which act as switches have been placed. When the user gets close to them, a panoramic view is activated, which shows a 4πpicture of the environment taken from the place where the sphere was placed in the virtual world. In that way, users can look at what looks like a photographic rendering of the site around them, without the need for the developers to build a realistic 3D view of the place. Figure 2 shows a blue sphere in a service tunnel, which activates the panoramic view of the computer racks.
Recently, two new levels have been added. The “Control Room” level offers a very
real-istic reconstruction of the ATLAS control room (see Figure 3): the user can walk through the desks, looking at different panels showing approved plots related to the data-taking and
com-puting dashboards. The user can also interact with two virtual screens showing educational movies about data acquisition and data transfer in HEP experiments.
Figure 2. Spheres placed in the VR environment are used as switches: users can activate additional panoramic views of the location by getting close to them. In the example, the blue sphere in an ATLAS service tunnel activates a panoramic view of the computer crates.
Figure 3. The “Control Room” level: a view of the VR representation of the ATLAS control room. The screens on the desks show different plots related to the data-taking, while the virtual screens on the walls show educational videos and event displays.
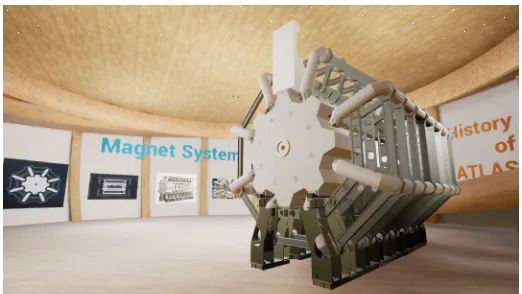
Another level has been recently added: the “Globe” level (see Figure 4). Here, an ac-curate reconstruction of the iconic CERNGlobe of Science and Innovation[4] is used as a virtual exhibition to show posters, movies, and other educational material. Those explain different aspects of the ATLAS experiment, of its history, and of the scientific collaborations
of research institutes behind it. In the main hall, switches on the main menu let users choose different ATLAS sub-systems; when one of them is selected, a small-scale rendering of the
relative geometry is shown in the middle of the floor, and educational posters about the given sub-system are displayed on the walls. A ramp climbs to the upper floor and, on the walls along it, posters tell the history of the ATLAS Collaboration. On the upper floor, a virtual cinema screen shows different educational videos, selected by the user though a menu.
Different scripted walk-through tours, in different languages, guide the user though
the different levels, setting interesting views, showing the important items, and explaining
Figure 4.A view of the “Globe” level, showing the ATLAS Barrel Toroid magnet inside the main hall. In the background, posters related to the ATLAS Muon Spectrometer, for which the magnet is used. On the right, a ramp climbs to the upper floor; on the wall along the ramp, posters tell the history of the ATLAS experiment.
The ATLASrift user interface has been recently translated into several languages, among them Italian, German, Chinese, and others. In the future, we would like to translate some of the educational content as well.
3 Developing HEP VR applications
3.1 Interactive 3D graphics in HEP
Interactive 3D data visualization already plays a key role in all HEP experiments [5], as it is used in many tasks at different levels of the data-processing chain: for detector development
and geometry studies, to check the detector response simulation, to investigate and debug the detector alignment, to verify and debug the algorithms used to reconstruct the physics objects from detectors’ measurements and to explore single events to verify the data selections of a physics analysis. Interactive visualization is also used as a debugging tool, for instance to visually inspect problematic measurements, events, or algorithms. It is also used in the exper-iments’ control rooms to verify that the data-taking runs correctly, by looking at a graphical representation of detector’s measurements.
HEP has a long tradition in building tools to interactively visualize data. Since computing graphics became accessible to researchers, around the end of the ’70s, HEP experiments began developing visualization tools andevent displays1[6].
Most of the time event displays are custom applications, because they often have to be integrated into the experiment’s framework, and they implement the graphics part in a num-ber of different ways. Sometimes, those applications use calls to the OpenGL [7] graphics
API directly, to keep maximal freedom in graphics manipulation. But, most of the time, they use 3rdparty graphics libraries, which offer higher-level access to graphics objects (for exam-ple, shapes, materials, and space transformations), tools, and routines to import and convert data and conveniently build 3D scenes from source code written in different programming
languages.
1In HEP, software applications which are able to visualize physics objects (like tracks, jets, clusters, vertexes,
EPJ Web of Conferences 214, 02013 (2019) https://doi.org/10.1051/epjconf/201921402013 CHEP 2018
Figure 4.A view of the “Globe” level, showing the ATLAS Barrel Toroid magnet inside the main hall. In the background, posters related to the ATLAS Muon Spectrometer, for which the magnet is used. On the right, a ramp climbs to the upper floor; on the wall along the ramp, posters tell the history of the ATLAS experiment.
The ATLASrift user interface has been recently translated into several languages, among them Italian, German, Chinese, and others. In the future, we would like to translate some of the educational content as well.
3 Developing HEP VR applications
3.1 Interactive 3D graphics in HEP
Interactive 3D data visualization already plays a key role in all HEP experiments [5], as it is used in many tasks at different levels of the data-processing chain: for detector development
and geometry studies, to check the detector response simulation, to investigate and debug the detector alignment, to verify and debug the algorithms used to reconstruct the physics objects from detectors’ measurements and to explore single events to verify the data selections of a physics analysis. Interactive visualization is also used as a debugging tool, for instance to visually inspect problematic measurements, events, or algorithms. It is also used in the exper-iments’ control rooms to verify that the data-taking runs correctly, by looking at a graphical representation of detector’s measurements.
HEP has a long tradition in building tools to interactively visualize data. Since computing graphics became accessible to researchers, around the end of the ’70s, HEP experiments began developing visualization tools andevent displays1[6].
Most of the time event displays are custom applications, because they often have to be integrated into the experiment’s framework, and they implement the graphics part in a num-ber of different ways. Sometimes, those applications use calls to the OpenGL [7] graphics
API directly, to keep maximal freedom in graphics manipulation. But, most of the time, they use 3rdparty graphics libraries, which offer higher-level access to graphics objects (for exam-ple, shapes, materials, and space transformations), tools, and routines to import and convert data and conveniently build 3D scenes from source code written in different programming
languages.
1In HEP, software applications which are able to visualize physics objects (like tracks, jets, clusters, vertexes,
etc.) on top of a graphical visualization or representation of the detector’s geometry, are usually calledevent displays.
The use of a high-level graphics library offers the big advantage of simplifying the
ap-plication development and it offers great flexibility, because such libraries can be easily
in-tegrated in an existing code base. However, they often target the robotics and engineering fields, often offering only basic functionalities in terms of advanced graphics rendering.
3.2 Game Engines
In the gaming industry, where high-quality and highly-responsive graphics is essential, games are developed by choosing between two main roads: by the usage of native calls to the two main sets of graphics APIs (OpenGL and DirectX [8]) or by using the so-calledgame engines. A game engine integrates a development platform—featuring an editor, a compiler, and a debugger—and a complete set of graphics libraries and tools, together with software compo-nents to build user interfaces and different rendering engines. The development of the game
is done inside the engine, which then builds and packages the final application.
Game engines usually offer libraries and software tools which are optimized for fast and
high-quality graphics, especially those that are used to build commercial games. But that quality comes at the cost of a limited freedom in terms of software development, as we will see later.
Today, two game engines play a leading role in the market: Unity [9] and Unreal En-gine [10]. Both of them are free to use for non-commercial purposes and small, independent projects. Unreal Engine is open source, too. In terms of software development, Unity is based on C# and it is said to be easier to learn; while Unreal Engine is more complex and harder to use at the beginning, but it is based on C++, which makes it easier for HEP developers, as that
is the programming language commonly used while developing software for the experiments.
Unreal Enginehas been chosen to develop the applications presented in this paper.
3.3 Technology behind the scenes
To visualize the ATLAS detector accurately enough, the detector geometry has been exported from the experiment’s software framework using the ATLAS 3D event display, VP1 [11], then converted into standard 3D data formats (“fbx” [12]) and simplified as needed.
To simplify the use of the experiment’s geometry by standalone external applications, a new mechanism to serve the geometry data through an HTTP REST API has been recently developed [13]. Future releases of ATLASrift will use this service to load the geometry on request, according to the user’s settings and choices.
The data about the supports, the experimental cavern, and the other locations of the under-ground site, have instead been exported from the CAD files (CATIA [14]) used by the CERN and ATLAS engineering groups, and then simplified, reorganized, and then tessellated in MoI3D [15], to be imported into theUnreal Enginegame engine.
Many different applications, some of them developed in-house, have been used for smaller
tasks, such as to stitch pictures to create panoramic 4πimages, to edit audio, to tessellate geometries, to fix meshes, to create surfaces, and to convert and import data.
3.4 Using game engines for HEP: pros & cons
The use of theUnreal Enginegame engine for the development of ATLASrift let us acquire a detailed view about its use for HEP applications.
Game engines like Unreal Engine offer many advantages. They include a complete set
the main advantages is the cross-compilation and build for many different types of platforms
and hardware: PC, Mac, VR headsets, web-based HTML5 code, mobiles, consoles, market-places and e-stores, etc. They also feature strong separation between design and function-alities in applications, which makes collaboration among different stakeholders (developers,
designers) easier.
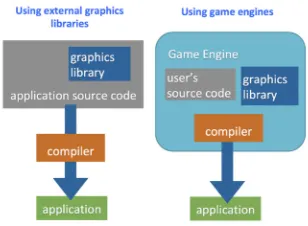
However, game engines like Unity or Unreal Enginealso have some important draw-backs, in our opinion. They are strongly self-contained environments, hard to be integrated into an existing work-flow (see Figure 5). Moreover, they cannot be used as a library in existing HEP code, like we currently do with, for example, OpenInventor/Coin3D [16] or
OpenSceneGraph [17]; on the contrary, all the user’s code for the application must be defined and compiled inside the engine. This is designed to speed up the development of games. However, although this work-flow is good enough for games, which most of the time are self-contained applications, this is not true when developing HEP applications, which very often have to interact with external frameworks to load data or other pieces of information. In addition, as expressed in Figure 6), it is difficult to integrate complex external libraries in
a project inside the game engine–like, for example, ROOT [18], which is needed to access most of the HEP data formats. This is the main drawback, because it prevents the use of such engines to develop more standard graphics-based HEP applications, like event displays.
Another major drawback is the lack of proper support for code versioning. An application developed within a game engine is usually composed of different pieces: assets (like textures,
images, etc.), "blueprints" (a sort of flow diagrams defining the application logic and the properties of the different "nodes"—functions, objects, lights, characters, cameras, etc.), and
the low-level code the developer can write to add custom functionalities. Of all three, only the latter can be written and stored outside the framework. Assets and blueprints, as well as all the application settings, are defined and written in the game engine itself. They are then stored by the engine in custom container files, which have a proprietary format and are difficult to
inspect, as they are seen as BLOB data by version control applications. Moreover, the closed nature of these container files makes it hard for the developer to compare different versions
of them with standard external tools, likediffor others. Only the low-level code may be properly versioned, by storing it outside the engine and importing it when needed; but that would require some additional steps to the development work-flow, without completely solve the issue. Therefore, setting a proper version control of the whole project and an effective
collaborative development work-flow among different developers is currently very difficult.
Hopefully, future versions of Unreal Engine and the other game engines will try to address and solve this problem.
In addition to that,Unreal Engineofficially supports only native compilers—that is,
Mi-crosoft Visual Studio on Windows and Xcode on Mac. The use of other compilers is difficult
and tricky.
3.5 Game engines for event displays
As said, it is difficult to integrate game engines with external software or libraries. Therefore,
it is very challenging to load HEP data in applications built with such engines. This pre-vents the use of game engines to build standard event displays, which is unfortunate, because their many high-quality graphics tools could be effectively exploited for HEP event display
applications.
EPJ Web of Conferences 214, 02013 (2019) https://doi.org/10.1051/epjconf/201921402013 CHEP 2018
the main advantages is the cross-compilation and build for many different types of platforms
and hardware: PC, Mac, VR headsets, web-based HTML5 code, mobiles, consoles, market-places and e-stores, etc. They also feature strong separation between design and function-alities in applications, which makes collaboration among different stakeholders (developers,
designers) easier.
However, game engines like Unityor Unreal Engine also have some important draw-backs, in our opinion. They are strongly self-contained environments, hard to be integrated into an existing work-flow (see Figure 5). Moreover, they cannot be used as a library in existing HEP code, like we currently do with, for example, OpenInventor/Coin3D [16] or
OpenSceneGraph [17]; on the contrary, all the user’s code for the application must be defined and compiled inside the engine. This is designed to speed up the development of games. However, although this work-flow is good enough for games, which most of the time are self-contained applications, this is not true when developing HEP applications, which very often have to interact with external frameworks to load data or other pieces of information. In addition, as expressed in Figure 6), it is difficult to integrate complex external libraries in
a project inside the game engine–like, for example, ROOT [18], which is needed to access most of the HEP data formats. This is the main drawback, because it prevents the use of such engines to develop more standard graphics-based HEP applications, like event displays.
Another major drawback is the lack of proper support for code versioning. An application developed within a game engine is usually composed of different pieces: assets (like textures,
images, etc.), "blueprints" (a sort of flow diagrams defining the application logic and the properties of the different "nodes"—functions, objects, lights, characters, cameras, etc.), and
the low-level code the developer can write to add custom functionalities. Of all three, only the latter can be written and stored outside the framework. Assets and blueprints, as well as all the application settings, are defined and written in the game engine itself. They are then stored by the engine in custom container files, which have a proprietary format and are difficult to
inspect, as they are seen as BLOB data by version control applications. Moreover, the closed nature of these container files makes it hard for the developer to compare different versions
of them with standard external tools, likediff or others. Only the low-level code may be properly versioned, by storing it outside the engine and importing it when needed; but that would require some additional steps to the development work-flow, without completely solve the issue. Therefore, setting a proper version control of the whole project and an effective
collaborative development work-flow among different developers is currently very difficult.
Hopefully, future versions of Unreal Engine and the other game engines will try to address and solve this problem.
In addition to that,Unreal Engineofficially supports only native compilers—that is,
Mi-crosoft Visual Studio on Windows and Xcode on Mac. The use of other compilers is difficult
and tricky.
3.5 Game engines for event displays
As said, it is difficult to integrate game engines with external software or libraries. Therefore,
it is very challenging to load HEP data in applications built with such engines. This pre-vents the use of game engines to build standard event displays, which is unfortunate, because their many high-quality graphics tools could be effectively exploited for HEP event display
applications.
Thus, to visualize HEP data, workarounds must be found. In ATLASrift we implemented a first version of a simple event display. For that, we developed a JSON exporter for the ATLAS event display VP1, to export the data about the physics objects (tracks, jets, etc.) of interesting events. 3D objects built from those data have been used for the event viewer.
Figure 5. Game engines require that all user code is integrated into the engine itself.
Figure 6. The self-contained nature of game engines makes it difficult to use external li-braries in applications developed within such platforms.
While that may be fine for outreach events and for educational purposes, it is not enough for implementing a real event display. The ATLASrift viewer can only show static event displays, whereas a real event display offers a high degree of interactivity. This enables the
researcher to make data selections and interactively load additional data from the experi-ment’s software framework. Prototypes of new client-server mechanisms to serve event data without a direct connection to the framework are under study [19], and may be used in a future release of ATLASrift.
4 Conclusions
Game engines are extremely powerful tools to create visually engaging applications, and they can be effectively used to create immersive VR experiences, also for HEP. However,
the access to traditional HEP datasets usually needs external libraries, which are difficult to
use from the engine. The temporary solution used in ATLASrift (export events’ data and physics objects’ features to a JSON file) satisfies a first goal: visualization for outreach and educational projects. The design of new data access approaches and more development work are needed to exploit the graphics power of game engines for real interactive event displays for physicists.
References
[1] ATLAS Collaboration, The ATLAS Experiment at the CERN Large Hadron Collider, JINST 3 (2008) S08003.
[2] Vukotic I, Moyse E, Bianchi R M,ATLASrift — a Virtual Reality application, DFP2015, arXiv:1511.00047 [physics.ins-det]
[3] Oculus Rift, Facebook Technologies LLC, https://www.oculus.com/rift/
[4] The CERN Globe of Science and Innovation, https://visit.cern/globe
[5] Bellis Met al., HEP Software Foundation,HEP Software Foundation Community White
Paper Working Group — Visualization, arXiv:1811.10309 [physics.comp-ph]
[6] Bianchi R Met al.,Event visualization in ATLAS, J. Phys. Conf. Ser. 898 072014 (2017), https://doi.org/10.1088/1742-6596/898/7/072014
[8] DirectX, Microsoft, https://en.wikipedia.org/wiki/DirectX
[9] Unity 3D, Unity Technologies, https://unity3d.com/
[10] Unreal Engine, Epic Games Inc., https://www.unrealengine.com
[11] Kittelmann Tet al.,The Virtual Point 1 Event Display for the ATLAS Experiment, J. Phys. Conf. Ser. 219 032012 (2010)
[12] FBX data format, Autodesk, https://en.wikipedia.org/wiki/FBX
[13] Bianchi R M and Vukotic I,A scalable new mechanism to store and serve the ATLAS de-tector description through a REST web API, J.Phys.Conf.Ser. 1085 (2018) no.3, 032035, https://doi.org/10.1088/1742-6596/1085/3/032035
[14] CATIA, Dassault Systèmes, https://www.3ds.com/products-services/catia/
[15] MoI3D, Triple Squid Software Design, http://moi3d.com/
[16] The Coin3D Toolkit, https://bitbucket.org/Coin3D/coin/wiki/Home
[17] OpenSceneGraph, http://www.openscenegraph.org/
[18] Brun R and Rademakers F,ROOT — An object oriented data analysis framework, Nucl. Inst. & Meth. in Phys. Res. A 389, 81-86 (1997)
[19] HEP Software Foundation, A Roadmap for HEP Software and Computing R&D for the