Optimization of Machining Parameters for
Development of 5083 Aluminium Nano
Structure through Hot ECAP
Praveen Kumar P
1, Rajmohan G
2Assistant Professor, Department of Mechanical Engineering, Dhaanish Ahmed College of Engineering, Chennai,
Tamilnadu , India1,2
ABSTRACT: This paper derive on the behavior of Al 5083 alloy and the responsibility was analysed by optimization of machining parameters in turning operation Using lathe. The Al 5083 is machined by Tungsten carbide tool using input parameters such as speed, feed, depth of cut & tool angle. The Maximum chip length, tool wear & Metal removal rate was identified for each and every input parameters. The relationship between input & output parameters was analysed using mathematical model & the significant also analysed by Anova. Then the collected chips were converted as a Nano particle by using ball milling. This is consolidated as a billet by applied load through hot ECAP process. Then the microstructure & hardness, of billet was analysed. The micro structured evolution and mechanical properties were studied the above conditions.
1. INTRODUCTION
In this optimization process the input parameters for turning &run sheet will create using DESIGN EXPERT 8 software. The 5083 Al is machined by Tungsten carbide tool with giving various machining parameters in run sheet. In each and every input parameter values to find The Maximum chip length, tool wear & Metal removing rate will be calculate. The collected chips are converted as a Nano particles by ball milling. This is associated as a billet by applying load through hot ECAP. The microstructure of the billet will calculate & surface roughness will measure via turning in lathe.5083 Al alloy is an aluminium alloy suitable for cryogenic applications down to design temperature of -165̊ C (-265 ̊ F), since alloys of this type do not show the ductile-brittle conversion singularity. This alloy is also common for the naval applications such as body materials for ships, underwater vehicles etc. this alloy is mostly used as marine alloys.5083 Al alloy also retains exceptional strength later welding. It has the maximum strength of the non-heat treatable alloys but is not recommended for use in temperatures in excess of 65°C.
II. EXPERIMENTAL METHODS 2.1 DESIGN EXPERT SOFTWARE
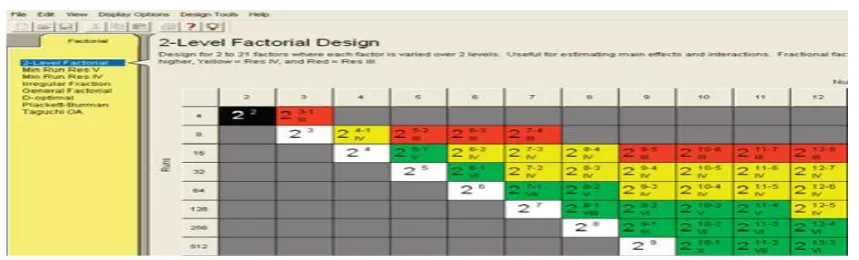
Identify the breakthrough factors for process or product improvement. Design-Ease software helps us set up and analyze overall factorial, two-level factorial, fractional factorial (up to 31 variables) and Plackett-Burman designs (up to 31 variables). With these designs we can rapidlydisplay for critical factors and their interactions. We can also do numerical optimization.
Table- 1 COMPARISON BETWEEN DOE & TAGUCHI METHOD
ASPECT DESIGNOF EXPERIMENTS TAGUCHI METHOD
Knowledge ofthe process Not required Required
Number of testRuns Large Smaller
Noise factors Not included Included
Variability ofSystem Ignored Included
ConfirmationRuns Not required Advisable
Table:2 Input Parameter values in 2 level
Parameters Min Range Max Range
Speed (rpm) 220 350
Feed (mm/rev) 0.20 0.40
Depth of cut (mm) 0.30 0.60
Tool angle (˚) 45 70
2.2 EFFECT OF PROCESSING ROUTES ON
2.2.1.Metal removal rate
Material removal rate and machining time is calculated using formulas.
MRR = П x D x d x f x N
Where D is Original diameter of the work piece d is depth of cut
f is feed rate N is speed
Machining time = L / f x N
Where L is overall length of the work piece f is feed rate N is speed
2.2.2.Tool wear
Tool wear describes the gradual failure of cutting tools due to consistent operation. Tool makers microscope is used for measuring the tool wear.
2.2.3.Maximum chip length
Collection of chips in which are maximum length in each & every machining operation is called s a maximum chip length.
2.2.4.Micro structure
structure, or assessingprecipitous hardness gradients such as those encountered in casehardening. Conversions from microhardness values to tensile strength and other hardness scales (e.g. Rockwell) are available for many metals and alloys.
Table:3 Run sheet-1 with Input Parameters & Responses for 2 level full factorial
SL NO SPEED (rpm) FEED (mm/rev) DOC (mm) ANGLE (˚) MAX CHIP LENGTH (mm) MRR Cm3/min
TOOL WEAR (mm)
1 350 0.20 0.60 70 410 42 0.0692
2 220 0.40 0.60 70 370 52.8 0.071
3 350 0.40 0.30 45 438 42 0.19
4 220 0.20 0.30 45 392 13.2 0.21
5 350 0.20 0.30 70 175 21 0.24
6 220 0.20 0.60 45 143 26.4 0.0657
7 220 0.40 0.30 70 161 26.4 0.11
8 350 0.40 0.30 70 174 42 0.15
9 350 0.20 0.60 45 270 42 0.744
10 220 0.20 0.30 70 246 13.2 0.13
11 220 0.40 0.60 45 232 52.8 0.0751
12 220 0.20 0.60 70 269 26.4 0.0792
13 350 0.40 0.60 70 218 84 0.8115
14 350 0.20 0.30 45 239 21 0.19
15 350 0.40 0.60 45 178 84 0.8311
16 220 0.40 0.30 45 169 26.4 0.16
According to full factorial approach the number of treatment combinations =2n (24 =16)
Table:4 RUN SHEET-2 FOR 2 LEVEL HALF FACTORIAL
SL NO(runs) SPEED(rpm) FEED(mm/rev) DOC(mm) ANGLE(0)
1 350 0.40 0.60 70
2 350 0.20 0.30 70
3 220 0.40 0.30 70
4 350 0.20 0.60 45
5 220 0.20 0.30 45
6 220 0.40 0.60 45
7 350 0.40 0.30 45
8 220 0.20 0.60 70
According to Half factorial approach the number of treatment combinations= 2n-1(24-1 =23= 8)
2.3 PREPARATION OF SAMPLES
Fig: 2.2 PM compaction process Fig: 2.3Prepared Specimen
The collected chips are filled inside the ball mill when it brings to rotate the chips are form as a power due to random striking of the balls. A ball mill is used to grind materials into extremely fine powder for use in mineral dress up operations, pigments, pyrotechny, ceramics and quality a 3D printing technology. Ball mill is a horizontal cylindrical device. It rotates to the horizontal axis, which contains number of equal size ironstone balls, flint pebbles and stainless steel balls. Powder metallurgy process are preferred to make a samples in a controlled atmosphere.
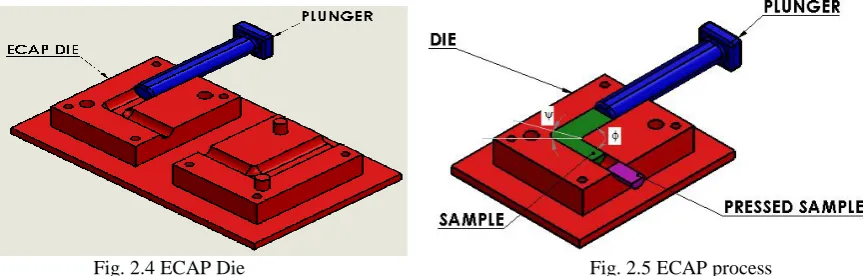
2.4 ECAP DIE:
The photograph of the die used for ECAP is shown below. The die is split type and the channel angle is 90º with a corner angle at the channel intersections is 20°. The semicircular 90º channel is present in the two rectangular blocks which can be fastened together to form a single channel, two additional plates were used to hold the die during the process
Fig. 2.4 ECAP Die Fig. 2.5 ECAP process
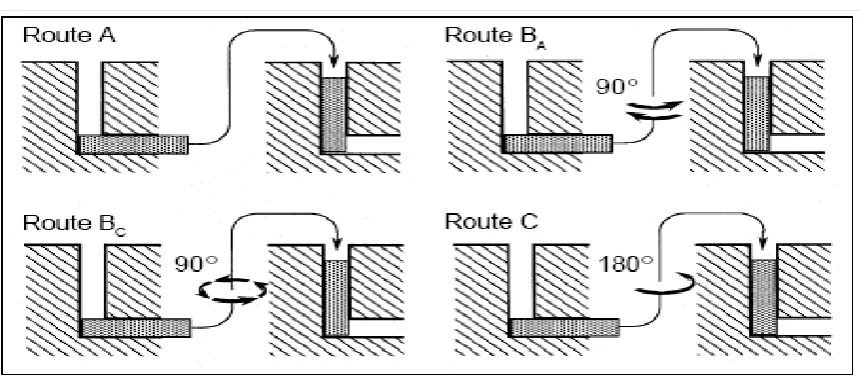
2.5 EQUAL CHANNEL ANGULAR PRESSING PROCESS
Fig. 2.6 Process Routes
III. TESTING
The Vickers test is often easier to use than other hardness tests since the required calculations are independent of the size of the indenter. The unit of hardness is the Vickers Pyramid Number (HV) or Diamond Pyramid Hardness (DPH). The hardness number is determined by the load over the surface area of the indentation. The prepared billet sizes to be low in length & diameter so the vicker’s hardness was taken for the each & every billets.For high-resolution information on metallurgical microstructures, electron microscope methods can be employed. This can tolerate for direct remark of atomic-scale features such as very fine precipitation response dislocations or grain-boundary interfaces. Such methods may be acute in defining parameters such as solid state diffusivities.
3.1 ANOVA (Analysis Of Variance)
ANOVA can be useful for determining influence of any given input parameter from a series of experimental results by design of experiments for machining process and it can be used to interpret experimental data. Analysis of variance (ANOVA) is a subordinated procedures and collection of statistical models. The detected variance in a particular variable is partitioned into components attributable to unlike sources of variation. ANOVA offers a statistical test of whether or not the means of several groups are all equal, and therefore simplifiestest to more than two groups and is used in the analysis of proportionaltrials, those in which only the alteration in results is of interest. The statistical consequence of the experiment is determined by a proportion of two variances. This proportion is impartial of numerousfeasiblerevisions to the experimental remarks. Adding a constant to all interpretations does not modify significance. Multiplying all interpretations by a constant does not alter significance. So ANOVA statistical significance results are independent of invariablepreference and scramblinglapses as well as the units used in transferring observations.
3.2 Mathematical model
Table:5 Analysis of variance table [Partial sum of squares - Type III]
SOURCE Sum of Squares DF MEAN SQUARE F VALUE p- value PROB>F
Model 7061.58 10 706.158 232.1361 < 0.0001 Significant
A-SPEED 1232.01 1 1232.01 405 < 0.0001
B-FEED 2631.69 1 2631.69 865.1183 < 0.0001
C-DOC 2631.69 1 2631.69 865.1183 < 0.0001
D-ANGLE 0 1 0 0 1.0000
AB 136.89 1 136.89 45 0.0011
AC 136.89 1 136.89 45 0.0011
AD 0 1 0 0 1.0000
BC 292.41 1 292.41 96.12426 0.0002
BD 0 1 0 0 1.0000
CD 0 1 0 0 1.0000
Residual 15.21 5 3.042
Cor Total 7076.79 15
The Model F-value of 232.14 implies the model is Significant. There is Only a 0.01% chance that a "Model F-Value" this large could occur due to noise.
Values of "Prob >F" less than 0.0500 indicate model terms are Significant. In this case A, B, C, AB, AC, BC are Significant model terms.
Values greater than 0.1000 indicate the model terms are not significant.
If there are many insignificant model terms (not counting those required to support hierarchy),model reduction may improve your model.
Table:6 Anova values for MRR
Std. Dev. 1.744133 R-Squared 0.997851
Mean 38.475 Adj R-Squared 0.993552
C.V. % 4.533159 Pred R-Squared 0.977991
PRESS 155.7504 Adeq Precision 47.60888
The "Pred R-Squared" of 0.9780 is in reasonable agreement with the "Adj R-Squared" of 0.9936. "Adeq Precision" measures the signal to noise ratio. A ratio greater than 4 is desirable.
Your ratio of 47.609 indicates an adequate signal. This model can be used to navigate the design space. Final Equation in Terms of Coded Factors:
MRR =
38.475
8.775 * A
12.825 * B 12.825 * C
0 * D
2.925 * A * B
2.925 * A * C
4.275 * B * C
0 * B * D
0 * C * D
Fig: 4.1Pie chart for metal removal rate
Response-2 Tool Wear
ANOVA for selected factorial model
Table:7 Analysis of variance table [Partial sum of squares - Type III]
SourceModel Sum ofSquares df MeanSquare FValue p-valueProb > F
0.011785 7 0.001684 4.510292 0.0253 Significant
A-SPEED 0.00191 1 0.00191 5.115921 0.0536
B-FEED 0.000103 1 0.000103 0.27599 0.6136
C-DOC 0.005013 1 0.005013 13.4285 0.0064
AB 0.000872 1 0.000873 2.339246 0.1647
AC 0.001136 1 0.001136 3.042431 0.1193
BC 0.001612 1 0.001612 4.318491 0.0713
CD 0.001139 1 0.001139 3.051466 0.1188
Residual 0.002986 8 0.000373
Cor Total 0.014772 15
The Model F-value of 4.51 implies the model is significant. There is only a 2.53% chance that a "Model F-Value" this large could occur due to noise.
Values of "Prob > F" less than 0.0500 indicate model terms are significant. In this case C are significant model terms.
Values greater than 0.1000 indicate the model terms are not significant.
If there are many insignificant model terms (not counting those required to support hierarchy), model reduction may improve your model.
Table:8 Anova values for Tool Wear
Std. Dev. 0.019321 R-Squared 0.797837
Mean 0.1098 Adj R-Squared 0.620944
C.V. % 17.59613 Pred R-Squared 0.191348
The "Pred R-Squared" of 0.1913 is not as close to the "Adj R-Squared" of 0.6209 as one might normally expect. This may indicate a large block effect or a possible problem with your model and/or data. Things to consider are model reduction, response transformation, outliers, etc.
"Adeq Precision" measures the signal to noise ratio. A ratio greater than 4 is desirable. Your ratio of 6.529 indicates an adequate signal. This model can be used to navigate the design space.
Final Equation in Terms of Coded Factors:
Tool Wear =
0.1098
0.010925 * A
0.002538 * B
-0.0177 * C
0.007388 * A * B
0.008425 * A * C
0.010038 * B * C
-0.00844 * C * D
Fig: 4.2 Pie Chart for Tool Wear
3.3 Micro structure & Hardness for 2 level half factorial
Table: 9Micro structure & Hardness for 2 level half factorial
Run Billet Speed Feed DOC Angle Hardness (HV) Micro Structure
2 350 0.2 0.3 70 141
3 220 0.4 0.3 70 167
4 350 0.2 0.6 45 151
5 220 0.2 0.3 45 136
6 220 0.4 0.6 45 121
7 350 0.4 0.3 45 159
IV. GRAPHS FOR MAX CHIP LENGTH, MRR , TOOLWEAR & HARDNESS
Graph-1: Run Vs Max Chip LengthGraph-2 : Run Vs Metal Removal Rate
Graph-3: Run Vs Tool Wear Graph-4: Billet Vs Hardness
V. CONCLUSION
In this experimental that the factorial design work is to find the relationship between input parameter & output parameter was successfully carried out and the relationship between input & output was shown in the mathematical model. That the significance of the model was analysed by the Anova. The model also significant from this model. The output parameter of Metal Removal Rate is most significantly affected by DOC. Which is compared to the speed & feed. In this experiment maximum chip length, metal removal rate, tool wear is is to be calculated for the input parameters of full factorial & the micro structure, hardness also to be identified for the output parameters of half factorial.
REFERENCES
1. Abhang L.B., Hameedullah M.: Chip-Tool Interface Temperature Prediction Model for Turning Process,International Journal of Engineering Science and Technology, Vol 2(4), 2010., pp. 382-393.
2. Palanikumar, L. Karunamoorthy, R. Krathikeyan, Assessment of factors influencing surface roughness on the machining of glass –reinforced polymer composites, Journal of Materials and Design, 27 (2006) 862-871.
3. Xue Ping, C. Richard Liu, Zhenqiang Yao, Experimental study and evaluation methodology on hard surface integrity, International Journal Advanced Manufacturing Technology, ODI 10.1007/s00170-006-0576-6.
4. T. Tamizharasan, T. Selvaraj, A. Noorul Hag, Analysis of tool wear and surface finish in hard turning, International Journal of Advanced Manufacturing Technology (2005), DOI 10/1007 /s 00170-004-2411-1.
5. Zahari Taha, H.K.Lelana, Hideki Aoyama,”Effect of Insert Geometry on Surface Roughness In the Turning Process of AISI D2” The 11th Asia Pacific Industrial Engineering and Management System Conference.
6. Suleyman Neseli , Suleyman Yaldız , Erol Turkes, “Optimization of tool geometry parameters for turning operations based on the response surface methodology” Measurement 44 (2011) 580–587.
8. H. K. Davea, L. S. Patelb and H. K. Ravala, “Effect of machining conditions on MRR and surface roughness during CNC Turning of different Materials Using TiN Coated Cutting Tools – A Taguchi approach” International Journal of Industrial EngineeringComputations.
9. Fang N., Srinivasa Pai, P. and Mosquea, S. “Effect of tool edge wear on the cutting forces and vibrations in high-speed finish machining of Inconel 718: an experimental study and wavelet transform analysis”, International Journal of Advanced Manufacturing Technology, 2703-6, 2007.
10. John D. Kechagias, Christos K. Ziogas, Menelaos K. Pappas and Ioannis E. Ntziatzias, “Parameter optimization during Finish End Milling of Al Alloy 5083 using Robust Design”, Proceedings of the World Congress on Engineering, Vol. I, 2011.
11. Kadirgama, K. and Noor, M.M. “Optimization of Surface Roughness in End Milling on Mould Aluminium Alloys (AA6061-T6) Using Response Surface Method and Radian Basis Function Network”, Jordan Journal of Mechanical and Industrial Engineering, Vol. 2, No. 4, pp. 209-214, 2008. 12. Lin, T.-R. “Optimisation Technique for Face Milling Stainless Steel with Multiple Performance Characteristics”, International Journal of Advanced Manufacturing Technology, Springer-Verlag, Vol. 19, pp. 330-335, 2002.
13. Mike S. Lou, Joseph C. Chen and Caleb, M. “Surface roughness prediction technique for CNC end Milling”, Journal of Industrial Technology, Vol. 15, 1999.
14. Sasikumar R and Arunachalam R.M. 2009.Synthesis of nanostructured aluminum matrix composite (AMC) through machining, Materials Letter, Vol. 63, pp.2426 -2428.
15. Shankar M.R., Verma R., Rao B.C., Chandrasekar S., Compton W.D., King A.H. 2005. Characteristics of aluminum 6061-T6 deformed to large plastic strains by machining, Materials Science and Engineering, Vol. A 410–411, No. 15, pp.364–368.
16. N. S. K. Reddy, S. Kwang-Sup, and M. Yang, “Experimental study of surface integrity during end milling of Al/SiC particulate metal– matrix composites,” J. Mater. Process. Tech., vol. 201, 2008, pp.
574–579.
17. A. R. Alao, and M. Konneh, “A response surface methodology based approach to machining processes: modelling and quality of the models,” Int. J. Experimental Design and Process Optimisation, vol. 1 no. 2/3, 2009, pp. 240–261
18. M. Kovacic, J. Balic, Evolutionary programming of a CNC cutting machine, Int. J. Adv. Manufact. Technol. (2002)
19. S. Chao-Ton, C. Mu-Chen, Computer-aided optimization of multi-pass turning operations for continuous forms on CNC lathes, IIE Trans.1999 20. W S Lin, B.Y. Lee, C. L. Wu, Modeling the surface roughness and cutting force for turning, Journal of Materials Processing Technology,2001. 21.Q. Meng, JA Arsecularatne, P. Mathew. Calculation of optimum cutting conditions for turning operations using a machining theory, International Journal of Machine Tools and Manufacture, 2000
22. Rosochowski A., Olejnikb L., Numerical and physical modelling of plastic deformation in 2-turn equal channel angular extrusion, Journal of Materials Processing Technology 125-126, p.p. 309-316, 2002
23. Iwahashi Y., Horita Z., Nemoto M. and Langdon T.: The process of grain refinement in equal channel angular pressing, Acta mater. 46/9, p.p. 3317-3331, 1998.