COMPARISON and IMPLEMENTATION of
COMPOUND MEMOOD MODEL and
MEMOOD MODEL
Chhavi Gautam , Sandeep Singh Kang C.E.C Landran, India
Abstract
—
Measuring software maintainability early in the development life cycle, especially at the design phase, may help designers to incorporate required enhancement and corrections for improving maintainability of the final software. Earlier MEMOOD model was developed which finds the maintainability of the class diagrams on the basis of Understandability and Modifiability on the basis of object oriented metrics of class diagrams This paper developed a multivariate linear model ‘Compound Maintainability Estimation Model for Object-Oriented software in Design phase’ (Compound MEMOOD), which estimates the maintainability of class diagrams in terms of their understandability, modifiability, Scalability and Level Of Complexity. While, in order to quantify class diagram’s Scalability and Level of Complexity the paper further developed two more multivariate models. These two models use design level object-oriented metrics, to quantify Scalability and Level of Complexity of class diagram. Understandability and modifiability models are taken from the previous MEMOOD model. Then, we make a comparison of MEMOOD model and Compound MEMOOD model and we find that Compound MEMOOD Model gives better results with the given dataset. All the models have been validated through appropriate statistical measures and contextual interpretation has been drawn.Keywords-scalability, maintainability, understandability,
modifiability, maintenance, level of complexity
I. INTRODUCTION
The ever-changing world makes maintainability a strong quality requirement for the majority of software systems. The maintainability measurement during the development phases of object-oriented system estimates the maintenance effort, and also evaluates the likelihood that the software product will be easy to maintain [1]. The maintainability is defined by IEEE standard glossary of Software Engineering as “the ease with which a software system or component can be modified to correct faults, improve performance or other attributes, or adapt to a changed environment”. Despite the fact that software maintenance is an expensive and challenging task, it is not properly managed and often ignored. One
reason for this poor management is the lack of proven measures for software maintainability [2]. As class diagrams play a key role in the design phase of object-oriented software therefore early estimation of their maintainability may help designers to incorporate required enhancements and corrections in order to improve their maintainability and consequently the maintainability of the final software to be delivered in future. Hence, there is a need of developing a maintainability estimation model, which quantifies the maintainability of object-oriented software at the design stage.
II. LITERATURE SURVEY
Wide range of maintainability prediction models have been proposed in the literature within last two decades. Some of the models are predicting maintainability using the metrics from coding as well as design phase, while some are focusing only on design level metrics [3]. Antonellis et al. [4], proposed a method of mapping object oriented source code metrics onto the sub-characteristics of maintainability mentioned in ISO 9126. Oman and Hagemeister [5], proposed the Maintainability Index (MI) that objectively determines the maintainability of software system based upon the status of the source code. Welker and Oman [6], suggested measuring maintainabilityin terms of cyclomatic complexity, lines of code(LOC) and lines of comments. Hayes et al. [7], proposed a model that estimates Adaptive software maintenance effort in terms of difference lines of code (DLOC) i.e. number of added, deleted and updated lines. Polo et al. [8], used number of modification requests, mean effort per modification request and type of correction to examine maintainability. In another study Hayes and Zhao [9], proposed a maintainability model that categorizes software modules as ‘easy to maintain’ and ‘not easy to maintain’. The model helps the developers to identify the modules those are not easy to maintain, before integrating them. From the survey of literature it has been observed that various researchers proposed several models for maintainability estimation, but in most of these studies, maintainability estimation depends on the measures taken after the coding phase. Because of this, maintainability predictions are made in the latter stages of SDLC, and it became very difficult to improve the maintainability at that stage. Muthanna et al. [10], developed a maintainability model using polynomial linear regressions. But this model could be applied only for procedural software and not suitable for object-oriented software. Genero et al. [11], developed four models that relate size and structural complexity metrics of UML class diagrams with maintainability measures like understandability time, modifiability correctness and modifiability completeness. But none of the four models quantify the maintainability of class diagrams itself. Earlier MEMOOD model was developed which finds the maintainability of the class diagrams on the basis of Understandability and Modifiability on the basis of object oriented metrics of class diagrams [12].
III. METRICS SELECTION
Object Oriented Programming for developing following models:
Maintainability Model
Understandability Model
Modifiability Model
Scalability Model
Complexity Model
For each model, we have to do extensive research to find out which metric or which measure of attribute of software will be highly relevant for the above said models. For this purpose, recent literature survey as well as cross and within company data set was chosen with help of experts and their performance, measurable expects for developing such model were studied and extensively validated by method of Delphi Technique. Here is list of matrices for each model.
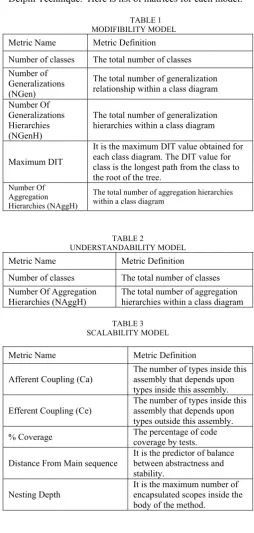
TABLE 1 MODIFIBILITY MODEL Metric Name Metric Definition
Number of classes The total number of classes Number of
Generalizations (NGen)
The total number of generalization relationship within a class diagram
Number Of Generalizations Hierarchies (NGenH)
The total number of generalization hierarchies within a class diagram
Maximum DIT
It is the maximum DIT value obtained for each class diagram. The DIT value for class is the longest path from the class to the root of the tree.
Number Of Aggregation Hierarchies (NAggH)
The total number of aggregation hierarchies within a class diagram
TABLE 2
UNDERSTANDABILITY MODEL Metric Name Metric Definition
Number of classes The total number of classes Number Of Aggregation
Hierarchies (NAggH) The total number of aggregation hierarchies within a class diagram
TABLE 3 SCALABILITY MODEL
Metric Name Metric Definition
Afferent Coupling (Ca)
The number of types inside this assembly that depends upon types inside this assembly.
Efferent Coupling (Ce) The number of types inside this assembly that depends upon types outside this assembly. % Coverage The percentage of code coverage by tests.
Distance From Main sequence It is the predictor of balance between abstractness and stability.
Nesting Depth It is the maximum number of encapsulated scopes inside the body of the method.
TABLE 4
LEVEL OF COMPLEXITY MODEL Metric Name Metric Definition
Coupling
The number of types inside this assembly that depends upon types inside this assembly.
Cohession The number of types inside this assembly that depends upon types outside this assembly.
Cyclomatic
Complexity Number of decisions that can be taken in procedure. ILCC It is the predictor of balance between abstractness and stability.
IV. DATA SET
For developing the data set we had considered, first: Open source projects were picked up for research work .Some projects were also picked up from local software companies. The study has used this dataset for fitting for fitting linear regression models for class diagram’s understandability, modifiability, scalability, level of complexity and maintainability taking class diagram’s metrics as independent variables
V. MODELS DEVELOPMENT
Quantification of class diagram’s understandability
and modifiability is prerequisite for the maintainability estimation model. Therefore before developing MEMOOD, the paper has developed two models for understandability and modifiability. In order to establish all the three models following multivariate linear model (1) has selected.
Y=
μ
+
β
1*X1+
β
2*X2+……+
β
n*Xn+
ɛ
(1)
A. MODIFIABILITY MODEL
In order to establish a multivariate model for modifiability of class diagram, metrics listed in Table 1, will play the role of independent variables while modifiability will be taken as dependent variable. To identify metrics those are effectively contributing in the prediction of modifiability, the technique of backward stepwise multiple regressions has been used. This procedure starts with a model, which initially includes all the independent variables and gradually eliminates those, one after another, that does not explain much of the variation in the dependent variable, until it ends with an optimal set of independent variables. Now applying backward stepwise regression, on the available data has resulted into the following modifiability model (2). This model has been taken from MEMOOD Model [12].
Modifiability = 0.629 +0.471*NC–0.173*NGen – 0.616*NAggH–0.696*NGenH +0.396*MaxDIT
B. UNDERSTANADABILITY MODEL
After establishing a model for modifiability the next task is to build a similar model for understandability also. Applying the same technique of stepwise backward multiple regression on the available data resulted into the following understandability model (3).
Understandability=1.166+0.256*NC–0.394* NGenH (3)
Where, NC is the ‘Number of Classes’ and NGenH is ‘Number of Generalization Hierarchies’. From (3) it could be interpreted that understandability of class diagram is directly proportional to ‘NC’, while ‘NGenH’ is inversely proportional to the understandability of class diagram.
C. SCALABILITY MODEL
In order to establish a multivariate model for Scalability of class diagram, metrics listed in Table3, will play the role of independent variables while Scalability will be taken as dependent variable.
Scalability=2.182+.099*AC+.100*EC+.O97*ND-.036*PC+.068*DMS (4)
Where AC is ‘Afferent Coupling, EC is efferent Coupling, ND is ‘Nesting depth, PC is % Coverage and DMS is Distance from main sequence.
1) Statistical Significance of the Model and Independent
Variables: It can be seen from the table 6 that value of r square is equal to 1 and also having very less error which shows that the model we have developed is extended with great fitness level of 1.
TABLE 5
ANOVA FOR SCALABILITY MODEL Sum Of
Squares DF Mean square F Significance Regression 211.772 5 42.354 5.005E5 .000a
Residual .002 22 .000
Total 211.774 27
Predictors: (Constant), AC, EC, ND, PC, DMS Dependent Variable: Scalability
Also the value of R2 (Coefficient of Determination) and Adjusted R2 in the table 6, is also very encouraging. As it refers to the percentage or proportion of the total variance in scalability by all the five metrics (independent variables) participating in the model (4).
TABLE 6
MODEL SUMMARY FOR SCALABILITY MODEL
R R Square Adjusted R Square Std. Error of the estimate
1.000 1.000 1.000 .009
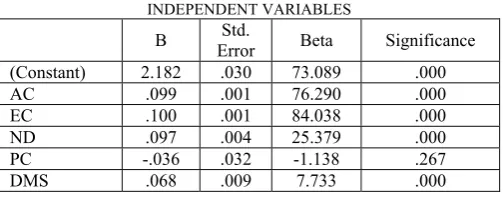
2) Statistical Significance of Independent Variables: As long as statistical significance and relevance of individual independent variables in the Scalability model (4) is concern. It can be noticed from the last column of Table 7, that each of the five metrics participating in the model is statistically significant at a significance level of 0.05 (equivalent to a confidence level of 95%).
TABLE 7
COEFFICIENTS AND STATISTICAL SIGNIFICANCE OF INDEPENDENT VARIABLES
B Error Std. Beta Significance
(Constant) 2.182 .030 73.089 .000
AC .099 .001 76.290 .000
EC .100 .001 84.038 .000
ND .097 .004 25.379 .000
PC -.036 .032 -1.138 .267
DMS .068 .009 7.733 .000
Dependent Variable: Scalability
D. LEVEL OF COMPLEXITY MODEL
In order to establish a multivariate model for Complexity of class diagram, metrics listed in Table 3, will play the role of independent variables while Scalability will be taken as dependent variable.
LOC=.269+.008*Coupling+.181*cohesion+.119*CC+.084 *ILCC (5)
Where ILCC is IL Cyclomatic Complexity and CC is Cyclomatic Complexity.
1) Statistical significance of the Model: Observing the
significance for the F-test in the last column of Analysis of Variance (Table 8), it can be concluded that the modifiability model (5) is statistically significant at a confidence level of more than 99%.
TABLE 8
ANOVA FOR LEVEL OF COMPLEXITY MODEL
Sum Of
Squares
DF Mean square
F Significance
Regression 147.022 4 36.755 3.178E4 .000a
Residual .027 23 .001
Total 147.049 27
Predictors: (Constant), Coupling, Cohesion, CC, ILCC. Dependent Variable: Level of Complexity
Also the value of R2 (Coefficient of Determination) and Adjusted R2 in the Table 9, is also very encouraging. As, it refers to the percentage or proportion of the total variance in modifiability by all the five metrics (independent variables) participating in the model (5).
TABLE 9
MODEL SUMMARY FOR LEVEL OF COMPLEXITY
R R Square Adjusted R Square Std. Error of the Estimate
1.000 1.000 1.000 .0340099
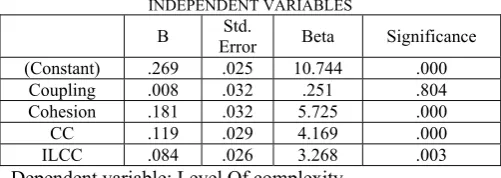
2) Statistical Significance of Independent Variables: As
TABLE 10
COEFFICIENTS AND STATISTICAL SIGNIFICANCE OF INDEPENDENT VARIABLES
B Error Std. Beta Significance
(Constant) .269 .025 10.744 .000 Coupling .008 .032 .251 .804 Cohesion .181 .032 5.725 .000
CC .119 .029 4.169 .000 ILCC .084 .026 3.268 .003
Dependent variable: Level Of complexity
VI. PROPOSED MODEL
A Compound MEMOOD model is proposed which takes Scalability, Level of Complexity, Understandability and Modifiability as independent variables.
A. Compound MEMOOD Model
In order to establish a multivariate model for Maintainability of class diagram, Scalability, Level of Complexity, Understandability and Modifiability of class diagrams becomes in dependent variables while maintainability will be taken as dependent variable
Maintenance= 2.399+.493*Modifiability+.474 Understandability+.524*scalability+.507*LOC (6
1) Statistical significance of the Model: Observing the
significance for the F-test in the last column of Analysis of Variance (Table11), it can be concluded that the maintainability model (6) is statistically significant at a confidence level of more than 99%.
TABLE 11
MODEL SUMMARY FOR COMPOUND MEMOOD MODEL
R Square R R Square Adjusted Std. Error of the Estimate
Durbin-Watson
1.000 1.000 .999 .08291 1.570
2) Statistical Significance of Independent Variables: As
long as statistical significance and relevance of individual independent variables in the Compound Maintainability model (6) is concern. It can be noticed from the last column of Table 11, that each of the five metrics participating in the model is statistically significant at a significance level of 0.05 (equivalent to a confidence level of 95%).
TABLE 12
ANOVA FOR COMPOUND MAINTENENCE MODEL Sum Of
Squares DF Mean square F Sig Regression 356.331 4 89.083 1.296E4 .0000 Residual .158 23 .007
Total 356.489 27
Predictors:(Constant),loc,scalability,uderstandability, modifiability.
Dependent Variable: Maintainability
TABLE 13
COEFFICIENTS AND STATISTICAL SIGNIFICANCE OF INDEPENDENT VARIABLES
B Error Std. Beta Sig
(Constant) 2.399 .048 .000 Modifiability .493 .018 .250 .000 Understandability .474 .047 .136 .000
Scalability .524 .014 .404 .000 LOC .507 .012 .325 .000
VII. MEMOOD MODEL
In order to establish a multivariate model for Maintainability of class diagram, Scalability, Level of Complexity, Understandability and Modifiability of class diagrams becomes independent variables while maintainability will be taken as dependent variable
Maintainability = -0.126 +0.645*Understandability +0.502*Modifiability (7)
TABLE 13
MODEL SUMMARY FOR MEMOOD MODEL
R Square R Adjusted R Square Std. Error of the Estimate
Durbin- Watson
.982 .965 .962 .2947681 1.895
Also the value of R2 (Coefficient of Determination) and Adjusted R2 in the Table, is also very encouraging. As, it refers to the percentage or proportion of the total variance in modifiability by all the five metrics (independent variables) participating in the model (7).
VIII. RESULTS AND DISCUSSION
With Comparison of MEMOOD Model and Compound MEMOOD Model, it is found that Compound MEMOOD Model have R Square value equals to 1 which states that it best fits the data. MEMOOD Model doesn’t have R Square value equals 1. Also the value of Durbin Watson variable of compound MEMOOD has value less than that of MEMOOD Model which is considered good. Thus Compound MEMOOD Model has better results than MEMOOD Model. Hence it is better.
TABLE 14
PERFORMANCE RESULTS OF MEMOOD MODEL AND COMPOUND MEMOOD MODEL
COMPOUND
MEMOOD MODEL MEMOOD MODEL Maintenance
value of R Square 1.00 .962
Durbin Watson 1.570 1.895
IX. CONCLUSION
In [12], MEMOOD is introduced. With Comparison of MEMOOD Model and Compound MEMOOD Model, it is found that Compound MEMOOD Model have R Square value equals to 1 which states that it best fits the data. MEMOOD Model doesn’t have R Square value equals 1. Also the value of Durbin Watson variable of compound MEMOOD has value less than that of MEMOOD Model which is considered good. Thus Compound MEMOOD Model has better results than MEMOOD Model. Hence it is better.
REFERENCES
[1] V.S. Alagar, L. Qiaoyum, and O.S. Ormandjieva, “Assessment of Maintainability in Object-Oriented Software,” Proc. 39th International Conference and Exhibition on Technology of Object-Oriented Languages
andSystems (TOOLS39), 29 July -03 Aug. 2001, vol. 19, pp. 194 – 204,
[2] M. Dagpinar and J. Jahnke, “Predicting Maintainability with Object-Oriented Metrics – an Empirical Comparison,” Proc 10th Working
Conference on Reverse Engineering (WCRE’03), 13 - 17 Nov. 2003, pp.
155-164, 2003.
[3] S.W.A. Rizvi and R.A. Khan, “A Critical Review on Software Maintainability Models,” Proc. of the National Conference on Cutting
EdgeComputer and Electronics Technologies, 14 - 16 Feb. 2009, pp.
144 – 148,Pantnagar, India, 2009.
[4] P. Antonellis, D. Antoniou, Y. Kanellopoulos, C. Makris, E. Theodoridis, C. Tjortjis, and N. Tsirakis, “A Data Mining Methodology for Evaluating Maintainability According to ISO/IEC-9126 Software Engineering Product Quality Standard,” Proc. 11th IEEE Conference on
Software Maintenance and Reengineering (CSMR2007), 21 – 23
Mar.2007, Amsterdam, Netherlands, 2007.
[5] P.W. Oman and J.R. Hagemeister, “Construction ands Testing of Polynomials Predicting Software Maintainability,” Journal of Systems andSoftware, vol. 24, no. 3, pp. 251 - 266, 1994.
[6] K.D. Welker and P.W. Oman, “Software Maintainability Metrics Models in Practice,” Journal of Defense Software Engineering, vol. 8, no. 11, pp. 19 - 23, 1995.
[7] J.H. Hayes, S.C. Patel, and L. Zhao, “A Metrics-Based Software Maintenance Effort Model,” Proc. 8th European Conference on Software
Maintenanceand Reengineering (CSMR'04), 24 – 26 Mar. 2004, pp. 254 –
258,IEEE Computer Society, 2004.
[8] M. Polo, M. Piattini, and F. Ruiz, “Using Code Metrics to Predict Maintenance of Legacy Programs: a Case Study,” Proc. of International
Conference on Software Maintenance, ICSM 2001, pp. 202-208, IEEE
Computer Society, Florence Italy, 2001.
[9] J.H. Hayes and L Zhao, “Maintainability Prediction: a Regression Analysis of Measures of Evolving Systems,”Proc. 21st IEEE International
Conference on Software Maintenance, 26 - 29 Sept. 2005, pp. 601 - 604,
2005.
[10] S. Muthanna, K. Kontogiannis, K. Ponnambalam, and B. Stacey, “A Maintainability Model for Industrial Software Systems Using Design Level Metrics,” Proc. 7th Working Conference on Reverse Engineering
(WCRE’00), 23 - 25 Nov., 2000, pp. 248 – 256, Brisbane, Australia,
2000.
[11] M. Genero, E. Manso, and G. Cantone, “Building UML Class Diagram Maintainability Prediction Models Based on Early Metrics,”
Proc. 9th International Symposium on Software Metrics (METRICS'03),
3 - 5 Sept., 2003, pp.263 - 275, 2003.
[12] S. W. A. Rizvi and R. A. Khan “Maintainability Estimation Model for Object- Oriented Software in Design Phase (MEMOOD)”, Journal Of