Monitoring Cotton (Gossypium sps.) Crop Condition through Synergy of Optical and Radar Remote Sensing
Dipanwita Haldar 1, Rojalin Tripathy 2, Viral Dave 3, Rucha Dave 3, B. K. Bhattacharya 2 and Arundhati Misra2
1 Indian Institute of Remote Sensing, Indian Space Research Organization (ISRO), Dehradun, India 2 Space Applications Centre, Indian Space Research Organization (ISRO), Ahmedabad-380015, India.
3 Anand Agricultural University, Anand, Gujrat, India
[email protected] [email protected] [email protected]
[email protected] [email protected]
Abstract
Morphological parameters like cotton height, branches, Leaf Area Index and biomass are mainly affected by the vegetation water content (VWC). Periodical assessment of the VWC and crop parameters is required for timely management of the crop for maximizing yield. The study aimed at using both optical and microwave remotely sensed data to assess cotton crop condition based on the above mentioned traits. Vegetation indices (VI) derived from ground based measurements (5 narrow band and 2 broad band VIs) as well as satellite derived reflectance (2 broad band VIs) were assessed. Regression models were derived for estimating LAI, biomass and plant water content using the ground based indices and applied to the satellite derived spectral index (from LISS-III) map to estimate the respective parameters. HH and HV polarization from RISAT-1 were used to derive Radar Vegetation Index (RVI). The coefficient of determination of the model for estimating LAI, biomass and vegetation water content of cotton with optical vegetation index as input parameter were found to be 0.42, 0.51 and 0.52, respectively. The correlation between RVI and plant height, date of planting in terms of the age of the crop and vegetation water content were found to range between 0.4 to 0.6. The fresh biomass from RVI showed spatial variability from 100 gm-2 to 4000 gm-2 while the dry biomass map derived from NDVI showed spatial variability of 50 to 950 g m-2 for the study area. Plant water content in the district varied from 65 to 85%. The correlation between optical vegetation index and RVI was not significant. Hence a multiple linear regression model using both optical index (NDVI and LSWI) and SAR index (RVI) was developed to assess the LAI, biomass and plant water content. The model showed a R2 of 0.5 for LAI estimation but not significant for biomass and water content. This study show
cased the use of combined optical and microwave (C band) remote sensing for cotton condition assessment.
Key words: SAR remote sensing, Optical remote sensing, RISAT-1, LISS III, RVI, VI, cotton, height, LAI, Biomass, Vegetation water content
1. Introduction
Cotton (Gossypium sp.) is the most important fibre crop worldwide, cultivated in approximately 35 Mha area. Its yield is governed by the height and number of fruiting branches in addition to the green leaf area index (LAI) and is a branched indeterminate crop. All these morphological parameters are mainly affected by the plant water status. Hence, periodical assessment of the above traits as well as the plant water content throughout the growth season is required for proper and timely management of the crop for maximizing yield. Reflective properties of the cotton crop can determine the green LAI and plant water status while information on height, branching habit and plant water content can be derived through microwave remote sensing (C band). Moreover, being a rainy season active (June-September) crop- flowering and boll formation, optical data acquisition at regular interval is a constraint due to prevailing cloud cover. The reflected energy from vegetated surfaces could be used for monitoring crop condition through estimation of morphological traits such as LAI, biomass and plant water content as well as through detection of biotic stress. In the reflective region of the optical spectrum, assessment of crop growth and plant status is generally accomplished by computing a ratio or linear combination of visible and near-infrared reflectance or microwave region, termed a vegetation index (VI) (Rouse et al., 1973). Some VIs have been found to be sensitive to greenness while some are sensitive to plant water status. This sensitivity is attributed to the absorption of incident red radiation by plant chlorophyll, scattering of incident NIR radiation by plant leaf structure and absorption of shortwave infrared radiation by plant water (Rouse et al., 1973).
optical and Radar combination in the current and future perspective such as RS 2 and repeat mission with RISAT 1A, 1B to form a constellation (high temporal frequency) for robust and near real time crop health monitoring at all seasons. Detailed comparative study on narrow and broad leaf crops using multifrequency multitemporal polarimetric data, collected at C- and L-bands by means of airborne and satellite synthetic aperture radar (SAR), showed that the relations between the backscattering of crops and the vegetation biomass depend on plant type (Macelloni et al., 2001).Mono- and multi-temporal TerraSAR-X and ALOS PALSAR biomass estimation models were analyzed for the development of accurate biomass estimations for forests (Englhart et al.,2011).
Several indications to derive vegetation information from radar and radiometer data including Radar Vegetation Index (RVI) were tested for VWC estimation through a generalized linear model (GLCM) by Srivastava et al. (1990). Gao and Goetz (1995) proposed a kind of Radar Vegetation Index (RVI) and applied to rice crop and soybean crops. Kim et al. (2012) compared RVI for L-, C- and X-bands to crop growth, LAI and NDVI. The RVI was found to correlate well with VWC, LAI and NDVI. The VWC has been used to separate out canopy contribution of volume scattering to retrieve soil moisture in the SMAP mission (Huang et al.,2015, Yamada, 2015). RVI was found well correlated with VWC for vegetation types having a greater dynamic range of growth measure like sigma naught and also used for other applications including yield estimation (Kim et al., 2012, Huang et al., 2015).
In this investigation, we examine the relationship between dual-polarised radar response with above ground measured biomass, VWC, age of the crop and height among the key plant biophysical parameters. The major focus is on the use of the proposed RVI (Kim and Van Zyl, 2001) for crop stage, condition and vigour assessment. These observations were analyzed to determine the applicability of current and future higher penetration radar satellite systems on the vegetation condition monitoring within crop types in varied vigour regions. In this case, we are developing a robust way to characterize plant water content using radar observations synchronous to critical (important) stages of cotton crop particularly when time series data are available. We analyse the relationships between the RVI for RISAT data and crop growth parameters (VWC and biomass) over the entire cotton growth cycle. The complimentary use of optical and microwave remotely sensed data to assess cotton crop condition has been showcased in the study.
2. Study area & Data used
with pre-sowing irrigation and an intermittent irrigation as and when required depending on the water requirement satisfaction. Later on the water requirement is met with monsoon showers. The indigenous cotton is mostly rainfed, sown with the onset of monsoon rains, late sown in July.
Datasets
Ground: Ground reflectance with ASD spectroradiometer in the spectral range of 350-2500 nm, observation on LAI, plant height, row-row and plant to plant spacing, row direction, planting date, biomass, plant water content were measured.
Satellite
Optical: Data from Linear Imaging Self Scanner (LISS-III) of Resourcesat-2 at 23.5 m spatial resolution was acquired from NDC-NRSC and cotton mask derived from RS2-AWiFS or Gujarat state was collected from MNCFC, New Delhi.
Synthetic Aperture Radar (SAR): SAR data consisting of multi-temporal scenes from RISAT-1 MRS-mode in descending pass (incidence angle 36°) were used. Till recently the Medium Resolution SCANSAR (MRS-HH/HV) mode of RISAT-1 18m pixel spacing has been used for operational monitoring of crop areas in India. Data were acquired in the monsoon season at different principal stages of crops viz. initial vegetative, peak vegetative and flowering, boll formation. The major kharif fibre crop cotton is addressed here, the validity of truncated formula in equation 2 for extension for RVI using quad-pol RISAT-1 (Fine Resolution Stripmap-FRS-2 data for a region in North India (Haryana) was carried out in a previous study (Haldar et al., 2017). Details of data used with their source and other details are given in table 1.
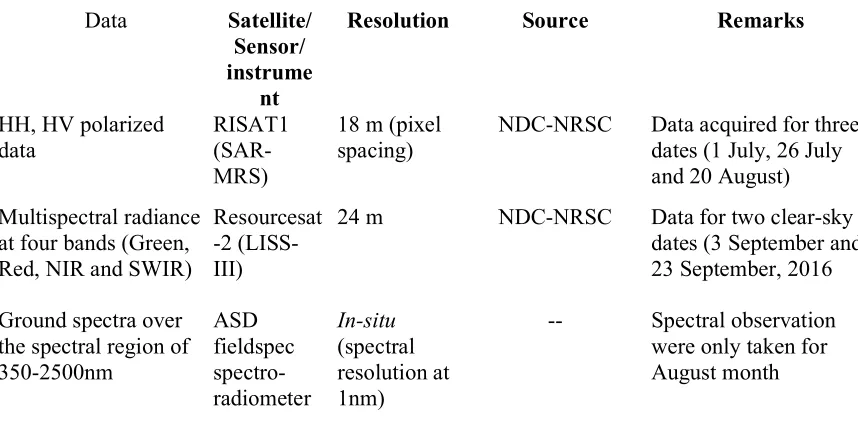
Table 1: Details of ground and Satellite data used for this study
Data Satellite/ Sensor/ instrume
nt
Resolution Source Remarks
HH, HV polarized
data RISAT1
(SAR-MRS)
18 m (pixel
spacing) NDC-NRSC Data acquired for three dates (1 July, 26 July and 20 August)
Multispectral radiance at four bands (Green, Red, NIR and SWIR)
Resourcesat -2 (LISS-III)
24 m NDC-NRSC Data for two clear-sky dates (3 September and 23 September, 2016
Ground spectra over the spectral region of 350-2500nm ASD fieldspec spectro-radiometer In-situ (spectral resolution at 1nm)
-- Spectral observation were only taken for August month
3. Methodology
3.1 Ground data collection
The indigenous cotton are totally rainfed and taken up by marginal farmers, sown with the onset of monsoon during July. The growth rate is miserably slow (table 2) with traditional package of practices only. The Bt cotton an advanced hybrid cotton in contrast sown in May with irrigation. All modern inputs/package of practices are applied. The picking of the boll starts in September, there are 3-4 pickings. On the other hand in indigenous cotton only one picking can be done in Dec/ January coinciding with the last picking of the indigenous cotton.
The field information was collected during all the three dates synchronous to the satellite overpass. Wet biomass was collected for 1sq. m. area housing about 2-3 cotton plants. Plant samples were collected by cutting above ground biomass. The VWC was computed from wet and dry biomass across all the sampling sites. Other land cover information such as urban, water body, villages, natural vegetation and plantations were also collected. Collateral data of climatic parameters like rainfall were also referred. The parameters are enlisted with their data range in table 2.
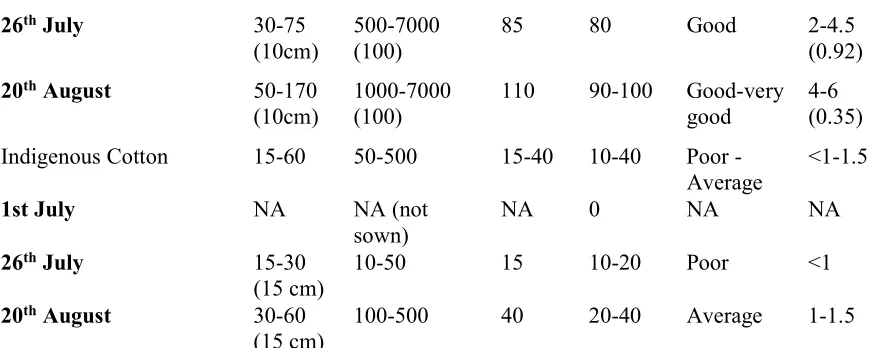
Table. 2 Ranges of measured cotton crop parameter (In-situ) figures in brackets denote the standard deviation.
Crop Parameter Cotton crop types Plant
height (cm)
Wet biomass
(gm-2) Age (days) Crop Cover
(%)
Crop Vigour
LAI (m2m-2)
Hybrid Cotton (Bt) 90-140 900 – 7000 70-110 70-90 Medium –
Very good 3.5-6
1st July 25-50 (
26th July 30-75 (10cm)
500-7000 (100)
85 80 Good 2-4.5
(0.92)
20th August 50-170
(10cm)
1000-7000 (100)
110 90-100 Good-very good
4-6 (0.35) Indigenous Cotton 15-60 50-500 15-40 10-40 Poor -
Average <1-1.5
1st July NA NA (not
sown)
NA 0 NA NA
26th July 15-30
(15 cm)
10-50 15 10-20 Poor <1
20th August 30-60
(15 cm) 100-500 40 20-40 Average 1-1.5
Ground spectra were collected from 25 sites with both BT and indigenous cotton (fig.1) during August 22 to 23 using the ASD Field Spec Pro Spectro-radiometer (Analytical Spectral Devices Inc., Boulder, CO, USA). The spectrometer consisted of a spectral range of 350–2,500 nm and a 25° field of view and is equipped with three sensors [(visible (400–750 nm) and near infrared-NIR (750–1,100 nm), shortwave infrared-SWIR1 (1,000–1,800 nm) and SWIR2 (1,800–2,500 nm)] with spectral sampling of 3, 10 and 10 nm, respectively. The instrument was periodically calibrated using a standard Spectralon white reference panel (Labsphere Inc., North Sutton, NH, USA). The white reference was measured at 30 min intervals to check the instrument stability for 100% reflectance. Built-in spectral resolution output of the data from the ASD operating system is 1 nm along the whole spectrum. Spectra of adjacent soil was also collected to match the pure crop spectra with the spectra of the image pixel.
3.2 Optical data processing and generation of VI
The pre-processing of the ground reflectance from ASD spectroradiometer included conversion of raw data to reflectance at 1 nm using the Viewspec software and conversion of narrow bands to LISS III equivalent bands using spectral response function (SRF) of LISS III while pre-processing of LISS-III data included DN to radiance conversion, radiance to surface reflectance conversion using the atmospheric correction module, SACRS2 (a Scheme for Atmospheric Correction of Resourcesat-2 (RS2) AWiFS data) developed at SAC (Pandya et al. 2015), extraction of reflectance at the sampling sites. Five narrow band indices, viz. Red Edge Normalized Difference Vegetation Index (Red NDVI), Vogelmann Red Edge Index 1 (VOG1), Vogelmann Red Edge Index 2 (VOG2), Vogelmann Red Edge Index (VOG3), Gitelson, and Merzlyak index(GMI); and two broads band indices, viz. Normallized Difference Vegetation Index (NDVI) and Land Surface Water Index (LSWI) were computed from the ground reflectance data and two broad band indices, (NDVI) and LSWI) were computed from the LISS-III data (Table 3). Cotton mask derived from multi-temporal AWiFS data (Vyas et al. 2016) was applied to the NDVI and LSWI images from LISSIII to find out the index over cotton cropped area.
Table 3: Vegetation indices from optical remote sensing data
Index Formula Source
Normalized Difference Vegetation Index (NDVI )
Land Surface Water Index (LSWI)
(NIR-SWIR)/(NIR+SWIR) Xiao et. al., 2002c, 2004
Red Edge Normalized Difference Vegetation Index (Red NDVI)
Red
NDVI=(R750-R705)/(R750+R705)
Gitelson and Merzylak 1994
Vogelmann Red Edge Index 1 (VOG 1)
R740/R720 Vogelmann et. al., 1993
Vogelmann Red Edge Index 2 (VOG 2)
(R734-R747)/(R715+R726) Vogelmann et. al., 1993
Vogelmann Red Edge Index 3 (VOG 3)
(R734-R747)/(R715+R720) Vogelmann et. al., 1993
Gitelson, and Merzlyak index (GMI)
R750/R700 Gitelson, and Merzlyak, 1994
3.3 Radar Vegetation Index
Kim and van Zyl, 2009 modified the eigen value based equation which can be used in polarimetric and amplitude datasets. 𝜎 , 𝐻𝐻, 𝑉𝑉, 𝐻𝑉 denotes the backscatter in like and cross-polarized domain.
𝑅𝑉𝐼 = 8 ∙ 𝜎 𝐻𝑉
𝜎 𝐻𝐻 + 2 ∙ 𝜎 𝐻𝑉 + 𝜎 𝑉𝑉 … . (1)
The modified and truncated equation for RVI after the approximationis
𝑅𝑉𝐼 = 4 ∙ 𝜎 𝐻𝑉
𝜎 𝐻𝐻 + 𝜎 𝐻𝑉 … . (2)
It should be noted that Radar-based variables which may be related to vegetation condition include the polarimetric measurements and the RVI (Kim and Van Zyl., 2001). RVI generally ranges between 0 and 1 and is a measure of the randomness of the scattering. RVI is near zero for a smooth bare surface and increases as crop grows specifically the peak vegetative stage (Kim et al., 2012). A number of investigations that have examined the relationships between biophysical variables (related to crop growth) and radar parameters (Srivastava et al., 1991, Inoue et al., 2002, Oh et al., 2009, Haldar et al., 2016). We used these in assessing the levels of response pertaining to crop growth and moisture stress in the current investigation. High-resolution radar observations are very sensitive to the small scale variations in vegetation. RVI (equation 2) has been generated from the HH and HV images after suitably filtering (5x5), divided by 1000 to scale down the DN and calibrating the image with calibration constant, multiply back with the scaling factor, then compute RVI with the formula in equation 2. It has been assumed that the VV polarisation was nearly equal to the HH power for medium height crops in the agricultural domain in advanced crop growth phase (Kim and Van Zyl.,2001). A truncated RVI (equation 2) for dual-polarized datasets holding this principle applicable in the present study has been investigated.
3.4 Processing of crop parameters
Crop LAI on ground was measured using the plant canopy analyser. Number of plants per m2 were derived using the spacing. Biomass per m2 was computed using the plant population per m2 and the biomass taken for three plants. Vegetation Water Content (VWC) was computed from dry and wet biomass for all the 100 ground collected biomass samples (Kim et al., 2012).
3.5 Correlation and model development
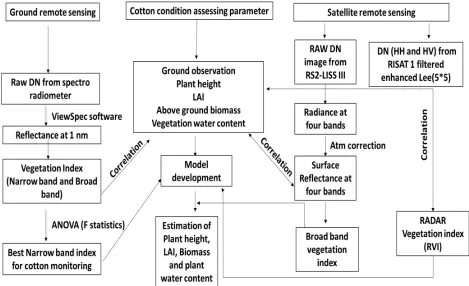
The correlation coefficients between the Vegetation Index (Vis) and plant parameters (plant height, LAI, biomass and plant water content) were determined to find the best index for each plant parameter. The best index was used for developing a regression model for the respective parameter. Different linear and nonlinear equation were generated to find out the best fit. Best model for each parameter was then used for estimating the respective parameter over the image scene covering the Surendranagar district to generate the map of the same. The estimated parameters were validated using independent ground data set. The ground estimated optical VIs were correlated with the RVI of nearly same period. The overall methodology is presented in figure 2.
Fig 2 Methodology for assessing cotton condition parameters
Plant height varied from 10 to 40 cm at different sites during July; from 30 to 75 cm at different sites during August and 50 to 170 cm during September. LAI varied from 1.5 to 5.5 at different sites and stages. Wet biomass per m2 varied from 80 to 800 at different sites in July; from 500 to 7000 at different sites in August and 1000 to 7000 gm-2 later. Dry biomass per m2 varied from 10 to 100 at different sites in July; from 300 to 1700 at different sites in August and 200 to 1200gm-2 in September. Plant water content (% by weight) varied from 80 to 90 % at different sites in July; from 60 to 85% at different sites in August and 70 to 85% in September. The first date corresponds to succulent leafy vegetative stage, second and third date corresponds to dry matter accumulation of photosynthate, partitioning to flowers and bolls (fruits).
4.2Analysis of ground spectra
Ground spectra were collected from cotton plants of different types (Bt and indigenous), different age, with different LAI, water content and biomass. Spectra from adjacent crop and soil were also taken to see the possibility of discriminating cotton from other crops. The spectra of Bt cotton and other crops such as sesame and French bean are given in fig 3a while that of Bt cotton and indigenous cotton are shown in fig 3b. The spectra showing the difference in LAI and water content are shown in fig 3c and 3d, respectively. The spectra showed distinct difference between sesame and cotton. The white flower of sesame reduces the chlorophyll absorption in the red edge region showing no prominent green peak. Similarly, indigenous cotton showed lesser reflectance in the NIR region due to the lower growth status. Variation in LAI also resulted in difference in reflectance pattern in many region of the spectrum, but maximum difference was in the red edge (690-740 nm) and NIR (770-870 nm) region (fig 3 c). Spectra of different Bt cotton plants with different water content are shown in fig 3d which shows different absorption depth at 940 nm.
Fig 3 Ground spectra of (a) cotton and other crops; (b) Bt vs indigenous/desi cotton; (c) Bt cotton with different LAI; and (d) Bt cotton with different vegetation water content (%).
The five narrow band and two broad band indices were correlated to the plant parameters responsible for cotton condition assessment. The results are shown in fig 4. The LAI and fresh biomass are significantly correlated with all the vegetation indices except for the GMI and VOG c. The correlation of different vegetation indices varied from -0.4 to 0.16 for water content while that for dry biomass ranged from -0.32 to 0.4 (fig 4). NDVI was poorly correlated with dry biomass and VWC. Hence nonlinear relationships were tried for model development to estimate the concerned parameters.
Fig 4 Correlation of Vegetation index with the plant parameters (LAI, fresh biomass, dry biomass and vegetation water content)
Fig 5: Models for estimating (a) LAI; (b) Fresh biomass (Fb) and Dry biomass (DB); and (c) vegetation water content using vegetation index (NDVI and LSWI)
4.4Models for estimating different plant parameters using optical vegetation index
determination (R2) was more for NDVI (0.51 and 0.49, respectively) as compared to LSWI (0.11 and 0.12, respectively) while for LAI and plant water content the variability captured by both indices was at par (fig 5). Hence, NDVI model was used to upscale the result to the district level.
4.5Model inversion for estimating plant parameters at spatial scale over a region
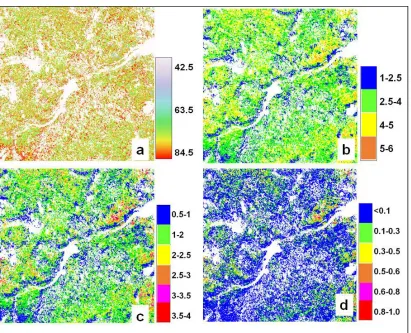
Broad band vegetation indices (NDVI and LSWI) were generated from the LISS-III image and the NDVI based models were applied to those images to spatially estimate the respective plant parameter over the study area (Fig 6). The vegetation water content (fig 6a) was found to vary from 43 to 85 % while LAI varied from 1.5 to 5.5 (fig 6b). Majority of pixel showed water content between 60-85 % (fig 6a). The fresh biomass over the study area ranged from 0.5 to 4.0 kg m-2 while dry biomass ranged between 0.50 to 0.95 kg m-2 (fig 6c, 6d). The model underestimates fresh biomass but effective for dry biomass. The range of estimated water content (%) and LAI are within the observed value range of the respective parameters at sampling GT points (Table 2).
Fig 6 Estimated plant parameters (a) vegetation water content (%), (b) LAI (m2m-2) (c) fresh biomass (kg m-2)
and (d) dry biomass (kgm-2) for cotton condition assessment.
4.6 Radar Vegetation Index (RVI)
good for planophiles where HH and HV response dominates over VV as indicated by Macelloni et al. 2001 and thus we extended this to planophile under study, cotton. The RVI ranges from 0-1.0 for most of the land cover types (Haldar et al. 2017). The temporal increase in RVI as observed in fig. 8b corresponds to the crop growth thus resulting in multiple scattering due to leaves, flowers and bolls from the media. For cotton cropped area the RVI was found in the range of 0.2 to 0.9, lower range by the indigenous class (lesser branching and prolonged vegetative phase) and higher by Bt high vigoured crop. In broad leaf crops backscattering were found to increase with an increase in the biomass, especially at L-band this behaviour is typical of media in which scattering is dominant converse to the narrow leaf crops (Macelloni et al., 2001, Haldar et al., 2014). This trend is augmented in the study where the crop growth results in increase in RVI which is stronger measure than individual backscattering coefficients. The fig 7a shows the RVI ranges for a variety of ground sampled data ranging in biomass from 1 kgm-2 to 7 kgm-2,height till 170cm (fig 7c) and age of 3 to 4 months (fig 7d).
VWC varies from few hundreds of grams to 5.5 kgm-2 (fig 7b) as against increasing above ground crop biomass till 7kgm-2. A significant relationship was found for cotton, with R2 between 0.5-0.6 and RMSE 0.3-0.7kgm-2. These results suggested that RVI is correlated with VWC for vegetation types having a large dynamic range. High correlation of RVI with crop age, vegetation water content and crop biomass (R2 0.55) were observed. VWC and biomass follow a close linear relationship with each other, but as the vegetation water content was found to be more sensitive to the radar response, it is being used for a basic relationship development. Thereafter biomass is estimated from RVI using a linear relation between VWC and crop biomass. Polynomial relationship was established for the natural and diffused target response as shown in fig.7a-e.
Fig.7 Relationship of various plant biophysical parameters (a) RVI vs Biomass, (b) RVI vs VWC, (c) RVI vs Plant height, (d) RVI vs Plant age (e) VWC vs biomass.
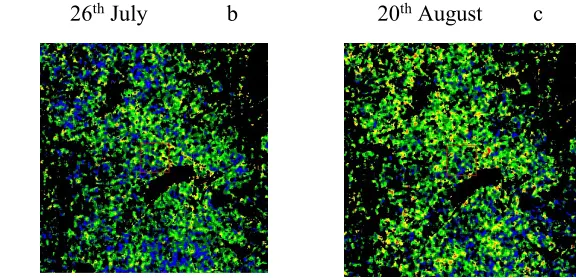
1st July a 26th July b 20th August c a b
c d
Fig. 8(a-c) Temporal RVI in Surendranagar and surrounding area for three dates of the year 2016. Red circle represents the Bt Cotton dominating area and Blue circle represents the indigenous cotton area
4.7. Inversion of plant parameters from RVI
The result of inversion of VWC from RVI was achieved with 25-35% error. The retrieved results for height, VWC and biomass are shown in fig. 9-11 for the three temporal acquisitions. The mean height of most of the fields was within 50 cm (fig 9a) during early July to 100-125 cm (fig 9c) during 20th August. Similarly mean VWC increased from within 1000 to 2000 gm-2 from 1st July to 20th August (fig.10 a-c). High error was observed above 4 kgm-2 biomass which may be attributed to the saturation limits of C-band. Therefore for inversion the range till 4 kgm-2 is worked out. In an earlier study by Englhart et al., 2011, overall ALOS PALSAR backscatter was found to be more sensitive to AGB than TerraSAR-X, especially in the higher biomass range (100 t/ha) which equates to 10kgm-2. Our finding also emphasises the intermediate range of 4-8 kgm-2 may be assessed with S or L-band. Nevertheless this higher limit of biomass will be encountered only in very high biomass crops like fruiting stage in cotton, sugarcane etc. Other medium biomass crops generally have around 5kgm-2 as the peak biomass.
The temporal biomass maps show increase from within 1000 gm-2 (fig. 11a) to 3000 gm-2 or above during August (fig. 11c). For higher biomass ranges accurate inversion will be possible with higher wavelength, using the datasets from future missions.
1st July a 26th July b 20th August c
Fig.10(a-c) Temporal VWC map in Surendranagar and surrounding area for 2016.
Fig. 11(a-c) Temporal Biomass map in Surendranagar and surrounding area for 2016.
The procedure was established during 2014-15 but robustness of this methodology has been tested and validated for datasets of 2016 across around 100 points spreading across low to high vigour zones encompassing both indigenous and Bt cotton. The validation exercise for both VWC and crop height was carried out vis a vis ground data as shown in fig. 12 and 13 with R2 of 0.68-0.84. As observed in the height validation fig. (R2 0.68) better retrieval is observed above 30-40 cm. In the lower ranges, ridges induced roughness as well as uneven plant population may attribute to RVI. The VWC retrieval was stronger (R2 0.84) than height due to higher correlation of the former with RVI and it being solely the plant water. This goes with the findings of earlier researchers (Wigneron, 2001) for Soyabean crop that retrieved water content in soyabean. Though there is some discrepancy in absolute water term but the approach seems promising as it estimates useful temporal information on crop growth.
Fig12. Validation of VWC model with
ground data Fig13. Validation of plant height model with ground data 4.7 Relationship between SAR index (RVI) and optical index (ground and satellite)
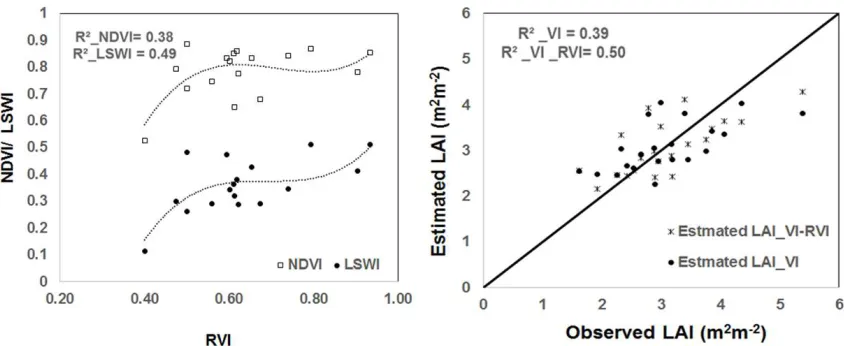
The ground estimated VIs (NDVI, Rededge_Gyout, VOGa, VOGb, VOGc, GMI and LSWI) were correlated with the RVI of same period (20 August). The VIs from LISS III (NDVI and LSWI) of 3 September were correlated with the RV of 20 August. The negative correlation was observed in case of Red NDVI, VOG1 and VOG 3 while other four has shown positive correlation with RVI. Highest correlation was obtained for VOG3 (r=-0.54). LSWI was found to be better correlated with RVI (r=0.44) as compared to NDVI (r=0.23). The correlation between optical vegetation index from ground and RVI are shown in fig 14. Linear relationship between RVI and broadband VI (NDVI and LSWI) from LISS III data was found to be poor and hence not shown. Both NDVI and LSWI from LISS III showed polynomial relationship with RVI (fig 15). Here also LSWI showed better correlation (R2=0.49) with RVI as compared to NDVI (R2=0.38). Multiple linear regression model using both optical VIs (NDVI and LSWI) and SAR index (RVI) were developed to assess the LAI, biomass and plant water content. The accuracy improved when RVI was used as an input parameter along with the optical VIs (NDVI and LSWI). The model for LAI estimation with NDVI and LSWI resulted in a R2 of 0.39 while when RVI was used as another independent variable, the model showed a R2 of 0.5 (fig 16). This indicates RVI may be used along with the optical VIs for improving accuracy of cotton LAI prediction.
5. Conclusion
The study aimed at using both optical and microwave remote sensing for cotton condition assessment. The usability of Radar Vegetation Index has been demonstrated for studying crop growth and assessing the cotton crop condition and health. It demonstrates the efficacy and potential application of using the truncated equation of RVI to the wider swath MRS data for crop condition monitoring at regional level. The direct response of SAR to vegetation water content helped us in monitoring the various crop vigour regions. The biophysical parameter empirical models crop-specific SAR response may go a long way in monitoring the crop status in varying zones of water stress.
The work has shown the degree of correlation of spectral indices with the crop parameter responsible for cotton condition such as plant height, LAI, water content and biomass. The study shown the ability of optical remote sensing for estimating LAI, biomass and water content with R2 of 0.42, 0.51 and 0.52, respectively. This study also showed the improvement in LAI estimation with the conjunctive use of RVI and optical VIs (NDVI and LSWI).
Hence it is concluded that, the conjunctive use of the C-band SAR and optical data with moderate resolution in monitoring the condition in terms of RVI, NDVI and LSWI is a potential tool and will prove to be quite helpful and efficient at times of the overcast sky in the monsoon/ rainy season in the tropical regions. However, such results need to be reproduced over time and space to prove its efficacy and hence, similar kind of research in other places and for other crops especially for rainy season crops is suggested for improving the accuracy in crop condition assessment.
6.Acknowledgement:
The authors are thankful to Shri Tapan Misra, Director, Space Applications Centre/ISRO for his constant encouragement and guidance during the study. This study was carried out as a part of the ARISE project funded by ISRO, authors are grateful for the same. Authors are also thankful to Dr. Prakash Chauhan, Director, IIRS, Shri D. Putrevu, Head MTDD AMHTDG/EPSA/SAC, Dr. Vyas Pandey, Professor, Department of Agrometeorology, AAU
Fig. 15 Relationship of RVI with NDVI and LSWI Fig. 16 Comparison of LAI model with optical VI
for their support in carrying out this program. We acknowledge MNCFC, New Delhi for the cotton crop mask.
7. References:
Englhart, S., Keuck, V., Siegert F Aboveground biomass retrieval in tropical forests — The potential of combined X- and L-band SAR data use Remote Sens. Environ., vol. 115, pp. 1260-1271, 2011.
Gao, B. C. and A. F. H. Goetz, “Retrieval of equivalent water thickness and information related to biochemical components of vegetation canopies from AVIRIS data,” Remote Sens. Environ., vol. 52, no. 3, pp. 155–162, Jun. 1995.
Gitelson, A.A. and M.N. Merzlyak, 1994. Spectral Reflectance Changes Associated with Autumn Senescence of Aesculus Hippocastanum L. and Acer Platanoides L. Leaves. Spectral Features and Relation to Chlorophyll Estimation. Journal of Plant Physiology 143:286-292.
Guyot, G., Baret, F., and Major, D. J., 1988. High spectral resolution: Determination of spectral shifts between the red and infrared. International Archives of Photogrammetry and Remote Sensing, 11, pp. 750–760.
Haldar, D., P. Rana, M.Yadav, R.S.Hooda, M Chakraborty. “Time Series analysis of co- Polarization Phase Difference (PPD) for winter field crops using Polarimetric C-band SAR data.” International Journal of Remote Sensing.37:16, 3753-3770, DOI: 10.1080/01431161.2016.1204024.
Haldar, D., V Dave, R Dave and A Misra. Radar Vegetation Index for Assessing cotton crop condition using RISAT MRS data. Analysis Report for 2014-15-16 datasets. SAC/ EPSA /AMHTDG /MTDD/TR-5/Aug-2017
Huang, Y., J. P. Walker, Y. Gao, X. Wu, and A. Monerris, Estimation of Vegetation Water Content from the Radar Vegetation Index at L-Band. IEEE Trans. Geosci. Remote Sens.,2015 Inoue,Y., T. Kurosy, H. Maeno, S. Uratsuka, T. Kozu, K. D. Zielinska, and J. Qi, “Season-long daily measurements of multifrequency (Ka, Ku, X, C, and L) and full-polarization backscatter signatures over paddy rice field and their relationship with biological variables,” Remote Sens. Environ.,vol. 81, no. 2/3, pp. 194–204, Aug. 2002.
Jackson, T. J. and T. J. Schmugge, “Vegetation effects on the microwave emission of soils,”
Remote Sens. Environ., vol. 36, no. 3, pp. 203–212, Jun. 1991.
Jin, Y. Q.and C. Liu, “Biomass retrieval from high-dimensional active/passive remote sensing data by using artificial neural networks,”Int. J. Remote Sens., vol. 18, no. 4, pp. 971–979, 1997.
Kim Y. J. and J. Van Zyl, “A time-series approach to estimate soil moisture using polarimetric radar data,” IEEE Trans. Geosci. Remote Sens., vol. 47, No. 8, pp. 2519–2527, Aug. 2009. Kim Y., Jackson, T, Bindlish, R. Lee, H. and Hong S, Radar Vegetation Index for estimating the
Vegetation Water Content of Rice and Soybean. IEEE Geoscience and Remote Sensing Letters,VOL. 9, NO. 4, July 2012.
Kim, Y. and Van Zyl. J., “Comparison of forest parameter estimation techniques using SAR data,” Proc. IGARSS, 2001., vol. 3, pp. 1395–1397, 2001.
Oh, Y.S., S. Y. Hong, Y. J. Kim, J. Y. Hong, and Y. H. Kim, “Polarimetric backscattering coefficients of flooded rice fields at L- and C-bands: Measurements, modeling, and data analysis,”IEEE Trans. Geosci. Remote Sens., vol. 47, no. 8, pp. 2714–2721, Aug. 2009. Pandya, M.R., Pathak, V.N., Shah, D.B., Trivedi, H.J., Chipade, R.A., Singh, R.P., Kirankumar,
A.S., 2015, Development of a scheme for atmospheric correction of Resourcesat-2 AWiFS data. International Journal of Applied Earth Observation and Geoinformation,40: 65–73. Prevot, L., I. Champion, and G. Guyott, “Estimating surface soil moisture and leaf area index of
a wheat canopy using a dual-frequency (C and X bands) scatterometer,” Remote Sens. Environ., vol. 46, no. 3, pp. 331– 339, Dec. 1993.
Rouse, J.W., R.H. Haas, J.A. Schell, and D.W. Deering, 1973. Monitoring Vegetation Systems in the Great Plains with ERTS. Third ERTS Symposium, NASA SP-351 I: 309-317.
Srivastava, P.K., P.O. Neil, M. Cosh, R. lang, A. Joseph “Evaluation of radar vegetation indices for vegetation water content estimation using data from a ground-based SMAP simulator pp. 31–43, 1990.
Tucker, C. J. “Red and photographic infrared linear combinations for monitoring vegetation,”
Remote Sens. Environ., vol. 8, no. 2, pp. 127–150, May 1979.
Vogelmann, J.E., B.N. Rock, and D.M. Moss, 1993. Red Edge Spectral Measurements from Sugar Maple Leaves. International Journal of Remote Sensing 14:1563-1575.
Vyas, S. P., Patel, Gajendra, Bhagia, Nita, Dutta, Sujay, Manjunath, K.R., Das, S.N., P.
Rajankar, R Indel, Ashoka Reddy, G .N. Naveen Kumar, Manjunath Gudgur, Vyas Pandey, Rucha Dave, Viral Dave, N. Babu, K.V.V Ramesh, M. Kavita, Narendar, A. Reddy, S.S. Ray, Neetu, Dhiraj K. Singh, Deepak Upreti, Pavan K. Yeggina, Meghavi Prashnani, Sundeep K. Yadav, Santosh Kumar and Prakash Chauhan,2015, Technique Development for Cotton Production Forecast at State Level using AWiFS data for the year 2013-15. Technical Report of FASAL - R&D activities: 2013-14 & 2014-15, SAC/EPSA/BPSG/CAD/ SR/FASAL/01/ 2015.
Wigneron, J. P., P. Ferrazzoli, A. Olioso, P. Bertuzzi, and A. Chanzy,“A simple approach to monitor crop biomass from C-band radar data,”Remote Sens. Environ., vol. 69, no. 2, pp. 179–188, Aug. 1999.
Xiao, X., Boles, S., Liu, J. Y., Zhuang, D. F., Liu, M. L. 2002c. Characterization of forest types in Northeastern China, using multitemporal SPOT-4 VEGETATION sensor data. Remote Sensing of Environment, 82: 335– 348.
Xiao, X., Hollingerb, D., Abera, J., Goltzc, M., Davidsond, E. A., Zhanga,Q., Moore, B. 2004. Satellite-based modeling of gross primary production in an evergreen needle leaf forest. Remote Sensing of Environment, 89: 519–534.