COMPARISON OF VELOCITY AND TEMPERATURE FIELDS FOR
TWO TYPES OF SPACERS IN AN ANNULAR CHANNEL
David Lávičkax
Abstract: The paper deals with measurement of flow field using a modern laser method (PIV) in an annular channel of very small dimension - a fuel cell model. The velocity field was measured in several positions and plains around the spacer. The measurement was extended also to record temperatures by thermocouples soldered into stainless-steel tube wall. The measurement was focused on cooling process of the preheated fuel cell tube model, where the tube was very slowly flooded with water. Main result of the paper is comparison of two spacer's designs with respect to measured velocity and temperature fields.
1. INTRODUCTION
This text deals with a comparison of two spacer designs, the VAR 01 and VAR 02, on fuel rod models. The fuel rod model represents a vertical annular channel where the spacers are installed. The comparison of the spacers focuses on the development and magnitude of velocity profiles in the annular channel. The velocity profile was investigated using the modern laser method of Particle Image Velocimetry, PIV. PIV requires modifications of the fuel rod design to conform the optical principles and properties at the boundary of two environments. The investigation also included the pressure loss at the fuel rod model for individual spacer shapes at given mass flow rates of the liquid running in the annular channel.
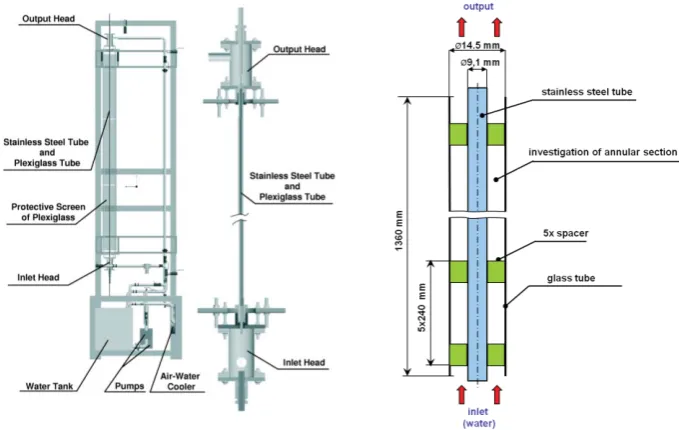
Figure 1: Experimental apparatus and fuel rod model
x David Lávička, Západočeská univerzita v Plzni, Univerzitní 8, 306 14 Plzeň, Czech Republic,
2. EXPERIMENTAL APPARATUS
The experimental apparatus (see Figure 1) consists of a water circuit and a fuel rod model. The basic element of the water circuit is a dosing pump which allows setting the mass flow rate as required. Distilled or tap water is used as the coolant; it is taken from a reservoir with a capacity of ca. 200 L. In order to harmonize flow, a pulse damper is located behind the pump. The main component of the experimental apparatus is the inlet and output head. These heads contain thermocouples that allow monitoring of coolant temperature. These heads are connected to the glass or plexiglass tube through which the above processes can be viewed. A stainless-steel pipe with spacers is located within the glass or plexiglass tube.
3. S
PACERSpacer (Figure 2) is an important part of the fuel cluster model. The fuel cluster rod (stainless-steel tube) is approximately 1360mm long and has 5 spacers with 240mm stepping. The spacer at the fuel rod model serves several important purposes. Firstly, they provide axial alignment within the glass tube shown in Figure 1.
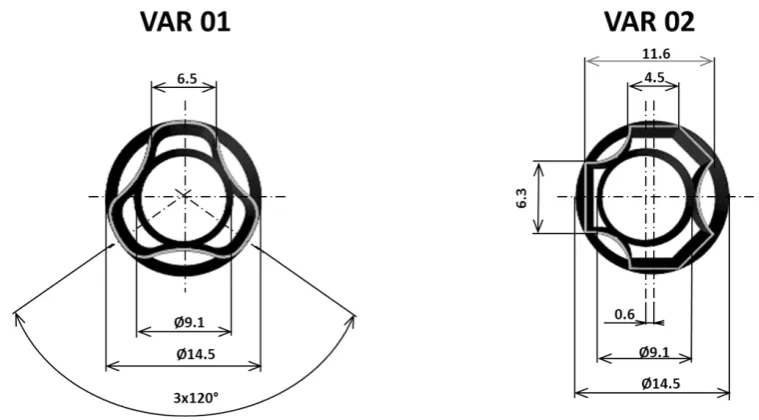
Figure 2: Examples of designed spacers - VAR 01 and VAR 02
The spacer also acts as vortex generator. Flow runs around the spacer on both sides, becomes separated by the spacer shape, and vortex is generated in the flow. The size and intensity of the vortex area directly affects heat transfer between the heated stainless-steel tube and coolant in the annular area.
S
PACERVAR
01
Spacer VAR 01 divides the annular channel into 3 equal areas, each having an angle 120° [5]. The center of the spacer is identical to the center of the glass pipe. See Figure 2 for more details on the spacer.
S
PACERVAR
02
the spacer amounts to 0.6mm; the spacer shape and dimensions are provided in Figure 2.
4. MEASUREMENT USING PIV (PARTICLE IMAGE VELOCIMETRY)
The applied measurement method, PIV (see Figure 3), is based on monitoring particle movement in a defined volume of liquid. The principle of velocity measurement is based on the premise of equal rate of velocity in both the particles and the liquid, when the travel of a group of particles is measured within given time. Assessment of the measured travel uses a number of methods which depend on the technology of measurement technique and data recording; in most cases, this is cross or adaptive correlation. An example process from the actual measurement until the assessment of the received images is shown in Figure 3.
Figure 3: Principle of experiment measurement using the PIV method [4]
The used method, PIV, at the portrayed model of a fuel rod in Figure 2 shows the relevant dimensions of both the investigated flow channel and the spacer [4]. Figure 2 indicates that the dimensions of the monitored area are very small. The maximum channel width is 3.5mm; the size of the monitored area is defined by the camera used for capturing the image. This measurement was very sensitive as to the accuracy of the settings of the laser beam and the recording camera. The accuracy of the measurement also depended on the size of the particles used, velocity gradient, interval length between two flashes, laser beam intensity. The measurement was not only sensitive as to the operational setting of the equipment, but also in terms of human interaction around the experiment.
were solved during design plexiglass tube and final shape and construction eliminate this problems. Design of plexiglass tube is shown to Figure 3. Greatest requirements were for interface between air-plexiglass, because this interface causes bigger problems with accuracy. Solutions are flat surface for incidence of laser beam and reading of images, which it's created by the transition element on the plexiglass tube. This transition element is block with through hole in center. Second interface between water-plexiglass is not more important, because values of index reflective are similar.
The experiment was carried out using a borrowed telecentric lens Navitar ELWD Macro Invarotar by Melles Griot. The telecentric lens was used to monitor an area of ca. 70x70mm from a distance of 120mm. The effective distance was defined by the focal length of the lens. A minor disadvantage of the lens was the square field of view; yet the corners of this field are not visible. That is why only a fraction of the recorded field of view is used for assessment. This fact reduced the final image to an area of ca. 5x5mm.
Both lens were attached to a Flow Sense 4M 1/2" CCD chip purchased from the Dantec company which was used to capture the images from the lens. The laser beam was excited by NewWave Research Model 25 300 Solo 200XT-15Hz, also manufactured by Dantec. Laser beam intensity was set according to the aperture numbers of the respective lens. Data recording and processing was carried out in the software supplied to the PIV equipment, Dynamic Studio v. 2.30, on PC Dell Precision PWS 690 and 390 workstations, on the Windows XP Professional platform. For processing the velocity field and profile, all instances used 600 pairs of images. Adaptive correlation of these images returned detailed description of the flow field with the actual state of the velocity field. The supplied software was used to calculate the average of these 600 assessed velocity fields to return the average flow field over time, similarly to the numerical simulation.
5. RESULTS
Figure 4 shows the positions of the planes where the vY velocity profiles in the annular flow channel were read. The velocity profiles were read at two planes: 750mm and 770mm. The situation and marking of individual velocity profiles are shown in Figure 4.
The PIV readings were taken with the flowing liquid at 25°C. Spacer type VAR 01 showed a pressure loss of 0.1188 MPa at a flow of 20 liters per minute (0.34 kg/sec); the liquid was distilled water. Spacer VAR 02 delivers a lower pressure loss, 0.1175 MPa, at the same flow rate. The difference in the pressure loss parameters is very small and might not be relevant in practice.
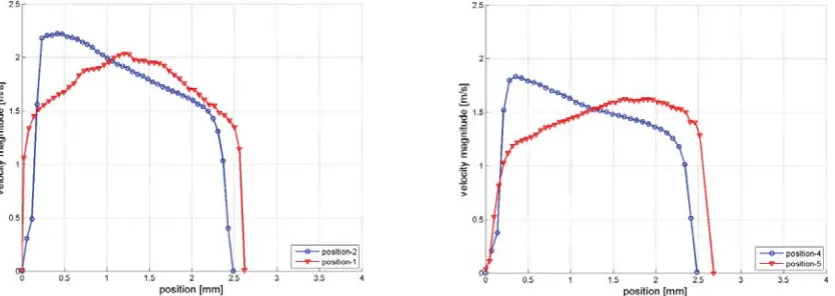
The chart in Figure 5 compares the velocity profile in the annular space behind spacers VAR 01 and VAR 02. The positions of the velocity profiles are located behind the gap formed by stainless-steel pipe and spacer. The velocity data read in the velocity profile at the 750 mm plane in positions 1 and 2 have nearly identical values. The mean velocity value is approximately 1.7 m/s. The chart also indicates various widths of the velocity profile. This is the result of the eccentric mount of spacer VAR 02 that affects the width of the annular channel. The magnitude and direction of the eccentricity, in relation to the acrylic glass tube is shown in Figure 2. The right chart in Figure 5 compares the velocity profile in positions 3 and 6 that is characterized by the increased velocity vY in the left part of the chart. The higher velocity in the VAR 01 variant most likely occurs behind the wake. The wake generates behind the area of contact between the spacer and acrylic glass pipe.
Figure 5: Velocity profiles for VAR 01-position 1, 3 and VAR 02-position 2, 6
The chart in Figure 6 compares the velocity profile where one side is the liquid passing the spacer attached to the stainless-steel pipe while the other side is the liquid flowing along the acrylic glass pipe.
The VAR 02 spacer type shows a parabolic shape of the velocity profile. The maximum velocity for the VAR 02 spacer in position 1 is approximately 2 m/s. In position 5, the maximum velocity vY in the velocity profile is reduced to 1.7 m/s. The lower vY velocity is the result of mixing the other currents from the whole annular channel area.
The VAR 01 spacer has an inclined shape of the velocity profile in both positions 1 and 3. The velocity profile shows highest velocity values near the acrylic glass tube.
The VAR 02 spacer type shows a parabolic shape of the velocity profile. The maximum velocity values for VAR 02 spacer in position 1 amount to approximately 2 m/s. In position 5, the maximum of velocity vY in the velocity profile is reduced to a value of 1.7 m/s. The reduction of velocity vY is caused by the mixing of other flows from the entire annular channel area. The VAR 01 spacer has an inclined shape of the velocity profile in both positions 1 and 3. The velocity profile shows highest velocity values near the glass tube.
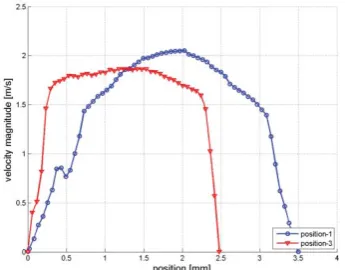
The chart in Figure 7 compares a situation similar to that shown in Figure 6. In VAR 01, the liquid flows through the same opening; however, in VAR 02, the liquid flows through a smaller opening indicated as Position 3 and 7 in Figure 4. The VAR 01 spacer, too, has an inclined shape of the velocity profile and shows similar values of velocity vY like in the preceding example. The shape of the velocity field affects the magnitude of contact between the spacer and stainless-steel pipe; the parameter is different for the spacer variants.
Figure 7: Velocity profiles for VAR 01-position 2, 4 and VAR 02-position 3, 7
The chart in Figure 8 compares the velocity profiles of VAR 02 spacer in positions 1 and 3. Both positions of velocity profiles are located behind the gap between the stainless-steel pipe and spacer.
Position 1 runs through a gap that has larger flow area than the gap in position 3 as the area of the latter is affected by the eccentric mount of the spacer. Although both velocity profiles are of a parabolic shape, they differ in the development of velocity vY. The velocity profile in position 3 is rather flat, indicating a higher average velocity vY.
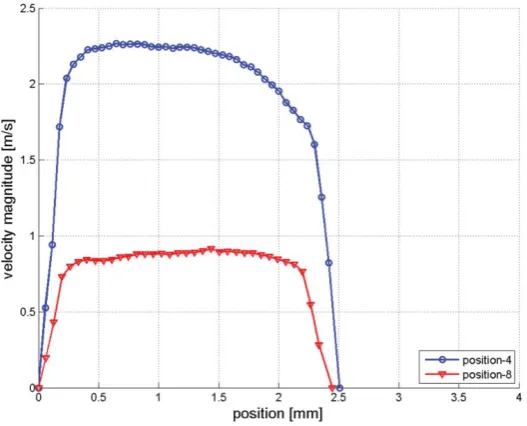
The chart in Figure 9 also compares the velocity profile only of VAR 02 spacer in positions 4 and 8. Both positions are located within the flow after the gap between the spacer and acrylic glass pipe. Position 8 shows an abrupt loss of velocity vY in comparison to the velocity profile shown in position 4. High pressure resistance is formed in the location as the flow cross-section is reduced by the eccentric mount of the spacer.
Figure 9: Velocity profiles for VAR 02-position 4, 8
6. CONCLUSION
This article compares the flow fields in two types of spacers, the VAR 01 and VAR 02. The description of the flow field using velocity profiles was obtained through the PIV laser method. The laser method required to address several optical issues (reflections, laser passage and camera reading in the circular cross-section, etc.) related to the measurement of velocity field in very small annular channel. The VAR 01 spacer delivers a more balanced character of the flow field throughout the annular cross-section. The pressure loss in spacer VAR 02 is lower than in the VAR 01. The pressure loss difference is very low and might not represent a considerable advantage in practice. The design of the spacer considers other criteria, too, that are required for the correct function in the fuel rod – one of the vital, crucial components of the nuclear reactor.
The presented results of the experimental measurement of spacers VAR 01 and VAR 02 will be later extended with a comparison of the numerical simulation results. The numerical simulation will require the selection of a suitable turbulence model and the size of the calculation mesh, which affects the time and hardware requirements of the calculation.
ACKNOWLEDGEMENTS
This work was supported by the Czech Grant Agency project No. 101/09/P056 and specific research.
I would like to use this opportunity to thank Ing. Jan Novotny from the Fluid Mechanics and Thermomechanics Department at the CVUT Prague.
7. REFERENCES
[1] Raffel M.; Willert C.; Wereley S.; Kompenhans j.: Particle Image Velocimetry: A Practical Guide. Second Edition, Springer, Germany, 2007.
[2] C.C. Liu, "Numerically simulating the thermal-hydraulic characteristics within the fuel rod bundle using CFD methodology", Nuclear engineering and design, vol. 240, no°10, pp. 3078-3086, May 2010.
[3] B. Končar, E. Krepper., "CFD simulation of convective flow boiling of refrigerant in a vertical annulus". Nuclear engineering and design, no. 3, pp. 693-706, March 2008.
[4] Lávička D., "A Comparison of Flow Field Characteristics from PIV Experiment Measurement to Numerical Simulation behind a Spacer in a Vertical Pipe", Applied and Computational Mechanics, vol. 4, no°1, Czech republic, July 2010, pp.57-66.
[5] Lávička D., "CFD simulation the thermal-hydraulic characteristic within fuel rod bundle near grid", "International Conference on Computational Fluid Dynamics
2011", WASET - World academy of science, engineering and technology, Issue
![Figure 3: Principle of experiment measurement using the PIV method [4]](https://thumb-us.123doks.com/thumbv2/123dok_us/8083414.1348852/3.595.90.511.260.499/figure-principle-experiment-measurement-using-piv-method.webp)