INTERNA TIONA L JOURNA L OF RESEA RCH
AVAILABLE AT
HT T PS://EDUPEDIAPUBLICAT IONS.ORG/JOURNALS
p -ISSN: 2348-6848
E-ISSN:2348-795X Vo lu me 04 Is s u e 06
M ay 2017
Available online: https://edupediapublications.org/journals/index.php/IJR/ P a g e | 1 3 5 4
Study of Photovoltaic System in different operating
Environment using Modelling and Simulation
Nidhi Tomar1, Harendra Singh2 Dr Rajeev Ratan3
Department of Electronics & Communication Engineering, MVN University, Palwal, Haryana, India,
Abstract—
In this paper, a scheme has been proposed to focus on the analysis of the various factors which are responsible for affecting the performance of a solar PV system. However, the performance is judged on the basis of the power output from the panel, so the analysis will be done of the factors which directly or indirectly affect the power output thus the power rating of the panel or “Solar PV systems”. So, this project provides the theoretical studies also of the photovoltaic systems using its electric equivalent systems. The relation of the power output from the panel is also considered for analysis in this project as to study how increasing or decreasing temperatures affects the power output from the panel. So the temperature effect is analyzed in this project to understand the behavior of the system under the influence of temperature. The proposed model is based on a behavioral cell model for modeling solar radiance to electricity conversion and for implementing electrical characteristic of limited power systems in power simulations. This project work presents the modeling and simulation of solar photovoltaic system for a practical system. The solar photovoltaic (PV) system simulation model using MATLAB/ Simulink simulation environment and MATLAB code is prepared and performance is obtained for different working conditions.
Keywords: — MATLAB, Solar panel with charging system, Storage (Battery) and Inverter.
1. INTRODUCTION
Available online: https://edupediapublications.org/journals/index.php/IJR/ P a g e | 1 3 5 5
Fig 1: Prototype of SPV module
2.PROPOSED METHODOLOGY
Photovoltaic or solar cells are one of those power supplies which last for a long time. These cells are considered as very useful from the point of view of obtaining energy from the sun, since it converts sunlight directly to electricity with very high efficiency of conversion, also that it can provide nearly a permanent power output and it is available at a low operating cost also that it is pollution free. Since a “typical photovoltaic cell produces less than 3 watts at approximately 0.5 volt dc”. The cells must be connected in series –parallel configuration in order to match the power requirements for high power applications
Fig. 2: PV cell with its equivalent electric circuit
Figure: 2.1 (a) Short circuit current and (b) Open circuit Voltage
Then from equation (i) and (ii)
2.1 Sim-Electronics Model for Solar Cell array:
Sim-Electronics model for 6 solar cell model has been shown in the figure. In this the output of solar panel is connected to a voltage sensor the output of which is connected PS S Simulink converter. In this study, we have been taken different irradiance and different resistance values for simulation.
The simulation of solar photovoltaic system is carried out using MATLAB and the characteristics between various parameters are plotted. Current and voltage curves are plotted for different insolations from solar. The power output from the panel is calculated by using the formula (Power = Voltage*Current). This power is not always maximum t throughout the time, but it varies under the influence of various factors, these various factors influencing the power output are:
INTERNA TIONA L JOURNA L OF RESEA RCH
AVAILABLE AT
HT T PS://EDUPEDIAPUBLICAT IONS.ORG/JOURNALS
p -ISSN: 2348-6848
E-ISSN:2348-795X Vo lu me 04 Is s u e 06
M ay 2017
Available online: https://edupediapublications.org/journals/index.php/IJR/ P a g e | 1 3 5 6
The simulation of solar photovoltaic system is carried out using MATLAB and the characteristics between various parameters are plotted.
1. For 1000 watts/m2 irradiance, 250 C Temperature
voltage-Current and voltage-Power curves are plotted.
0 5 10 15 20 25 30 35 40 45 50 0
50 100 150 200
P hotovoltaic Module V-P Curve
Module Voltage (V)
M od ul e P ow er ( W )
0 5 10 15 20 25 30 35 40 45 50 0
5 10
P hotovoltaic Module V-I Curve
Module Voltage (V)
M od ul e C ur re nt ( A )
Fig 3.1 PV Module Power and Module Current Vs Module Voltage
2. For 500 watts/m2 irradiance, 250 C temp,
voltage-Current and voltage-Power curves are plotted.
Fig 3.2 PV Module Voltage module Power curve and Module Current curve
3.For 1000,750,500 and 250 watts/m2 irradiance,
250 C temp, Current and
voltage-Power curves are plotted.
0 5 10 15 20 25 30 35 40 45 50
0 50 100 150 200
Photovoltaic Module V-P Curve
Module Voltage (V)
M o d u le P o w e r (W )
0 5 10 15 20 25 30 35 40 45 50
0 5 10
Photovoltaic Module V-I Curve
Module Voltage (V)
M o d u le C u rr e n t (A )
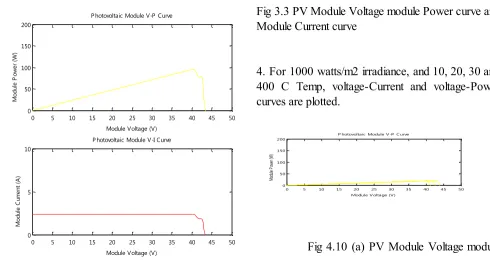
Fig 3.3 PV Module Voltage module Power curve and Module Current curve
4. For 1000 watts/m2 irradiance, and 10, 20, 30 and 400 C Temp, voltage-Current and voltage-Power curves are plotted.
Fig 4.10 (a) PV Module Voltage module
0 5 10 15 20 25 30 35 40 45 50
0 50 100 150 200
P hotovoltaic Module V-P Curve
Module Voltage (V)
M od ul e P ow er ( W )
0 5 10 15 20 25 30 35 40 45 50
0 5 10
P hotovoltaic Module V-I Curve
Module Voltage (V)
M od ul e C ur re nt ( A )
0 5 10 15 20 25 30 35 40 45 50
0 50 100 150 200
P hotovoltaic Module V-P Curve
Module Voltage (V)
Mo du le Po we r (W )
0 5 10 15 20 25 30 35 40 45 50
0 5 10
P hotovoltaic Module V-I Curve
Module Voltage (V)
Available online: https://edupediapublications.org/journals/index.php/IJR/ P a g e | 1 3 5 7
Power curve
Fig 4.10 (b) PV Module Voltage module Power curve and Module Current curve
4. Dust Effect on the panel:
Dust accumulation on solar panel is the natural phenomenon. It has been found that the accumulation of dust reduces the performance of solar PV system. This reduction in the performance of solar PV system can be up to 50%.
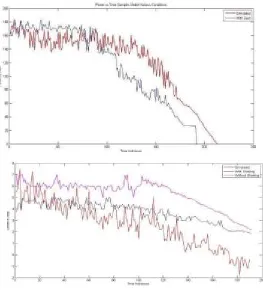
4. RESULTS &DISCUSSION
From the simulation results we see that the performance of solar panel decreased by a significant amount of power and due to dust accumulation of dust. The effective solar irradiance on the panel is decreased so the performance of the panel is decreased. The plots of power and current with respect to time are as follows:
5.CONCLUSION
In this project the modeling and simulation of solar photovoltaic system for various operating conditions have been done. These conditions are normal weather condition, partial shading on SPV array and dust effect for solar PV panel. These simulations are validated using experimental set up to get the various data from solar PV array such as voltage, current and powerReferences
6.REFERENCES:
1. Models Based Study of \ Solar Cells”,
International Vandana Khanna, Bijoy Kishore Das “MATLAB / SIMELECTRONICS Journal of Renewable Energy Research., Vol.3, No.1, 2013.
2. Yuncong Jiang, Qahouq, J.A.A., Orabi, M.
“Matlab/Pspice hybrid simulation modeling of solar PV cell/module”, Applied Power Electronics Conference and Exposition (APEC), 2011 Twenty-Sixth Annual IEEE.
3. Chandani Sharma, Anamika Jain “Solar Panel
Mathematical Modeling Using Simulink”
0 5 10 15 20 25 30 35 40 45 50 0
50
Module Voltage (V)
M
od
ul
e
Po
0 5 10 15 20 25 30 35 40 45 50 0
5 10
P hotovoltaic Module V-I Curve
Module Voltage (V)
M
od
ul
e
Cu
rre
nt
(A
INTERNA TIONA L JOURNA L OF RESEA RCH
AVAILABLE AT
HT T PS://EDUPEDIAPUBLICAT IONS.ORG/JOURNALS
p -ISSN: 2348-6848
E-ISSN:2348-795X Vo lu me 04 Is s u e 06
M ay 2017
Available online: https://edupediapublications.org/journals/index.php/IJR/ P a g e | 1 3 5 8
Internatioonal. Journal of Engineering Research and Applications ISSN: 2248-9622, Vol. 4, Issue 5 ( Version 4), May 2014, pp.67-72.
4. Ekpenyong, E.E and Anyasi, F.I “Remedyto the
Shading Effect on photovoltaic Cell” IOSR Journal of Electrical and Electronics Engineering (IOSR-JEEE) e-ISSN: 2278-1676,p-ISSN: 2320-3331, Volume 8, Issue 2 (Nov. - Dec. 2013), PP 07-15.
5. Huan-Liang Tsai, Ci-Siang Tu, Yi-Jie Su,
“Development of Generalized Photovoltaic
Model Using MATLAB/SIMULINK”,
Proceedings of the World Congress on Engineering and Computer Science WCECS, San Francisco, USA, 2008.
6. Monto Mani *, RohitPillai Impact of dust on solar
photovoltaic (PV) performance: Research status, challenges and recommendations Renewable and Sustainable Energy Reviews journal homepage: www.elsevier.com/locate/rser
7. N. M. Pearsall and R. Hill, “Photovoltaic
Modules, Systems and Applications,” In: M. D. Archer, and R. Hill, Eds., Clean Electricity from Photovoltaics, World Science, Vol. 1, 2002, pp. 1-42.
8. A simple non-linear model for the effect of partial
shade on PV systems. Niket, Thakkar et al. 2010. Honolulu, HI : IEEE Photovoltaics Specialists Conference, 2010.
9. N. Thakkar, D. Cormode, V. Lonij, S. Pulver
and A. Cronin, “ A simple non-linear model for the effect of partial shade on PV systems”, 35th IEEE Photovoltaic Specialists Conference, Honolulu, HI, June 2010.
10.Casanova JZ, Piliougine M, Carretero J,
Bernaola P, Carpena P, Lopez LM. Cardona MS, 2011, Analysis of dust losses in photovoltaic modules, World renewable energy
congress, Sweden,
[http://www.ep.liu.se/ecp/057/vol11/039/ecp57v ol11_039.pdf]; 2985-2992.
11. Mani A Handbook of solar radiation data for
India, New Delhi:Allied Publishers, p 451-462. (1980).
12.Pradhan Arjyadhara, Ali S.M, Jena Chitralekha,
Analysis of Solar PV cell Performance with
Changing Irradiance and Temperature,