HEYDECKER, W. 1965. Report of the Vigour Test Committee. Proc. Int. Seed Test. Ass. 30: 947-960. HYLTON, L. O., JR., AND R. E. BEMENT.
1961. Effects of environment on germination and occurrence of six-weeks fescue. J. Range Man- age. 14: 257-261.
KOTOWSKI, F. 1926. Temperature relations to germination of vege- table seeds. Proc. Amer. Sot. Hort. Sci. 23: 176-184.
LEHMANN, E., AND F. AICHELE. 1931. JUHREN, M., W. M. HIESEY, AND F. W.
Keimungsphysiologie der Graser WENT. 1953. Germination and early growth of grasses in con- controlled conditions. Ecology 34:
% 288-300.
(Gramineen) Ferdinand Enke Publ. Co, Stuttgart.
MORINAGA, T. 1926. Effect of alter- nating temperatures upon the ger- mination of seeds. Amer. J. Bot. 13: 141-158.
NAKAMURA, S. 1962. a. Germination of legume seeds. Preprint 58. 13th Int. Seed Test. Congr. Lisbon. NAKAMURA, S. 1962 b. Germination
STOTZKY, G., AND E. A. Cox. 1962. of grass seeds. Preprint. 13th Int. Seed Test. Congr. Lisbon.
Seed germination studies in MUSU: II: Alternating temperature re- quirement for the germination of Musa babisiana. Am. J. Bot. 49: 763-770.
9
Aerial Photography and Statistical
Analysis fort Studying Behaviour
Patterns of Grazing Animal2
M. L. DUDZINSKI AND G. W. ARNOLD2
Commonwealth Scientific and In- dustrial Research Organization, Di- vision of Mathematical Statistics and Division of Plant Industry, Canberra, A.C.T.
Highlight
Measuremenis and their sfafisfical analysis are suggested and fesfed in the study of sheep distribution in an arid pari of Australia. The use of aerial phoiography and an elecironic compuier make fhe job possible and relatively cheap. The possibility of predicting fhe condifion of a range from patterns of grazing behaviour is suggested.
1 The work would not have been possible without the generous help and personal interest of Mr. Tedd Marr, the owner of Mt. Murchison and Messrs. Frank and Brian Clark, owners of Kayrunnera. We wish to acknowledge also, the skilful pho- tography of Mr. C. Totterdell and precision flying by Mr. H. Debney of Barrier Air Taxis Ltd. Messrs. I. G. Bush and H. Simpson, and Mrs. R. Jarasius are thanked for technical assistance.
2 Present Address-Division of Plant Industry, Commonwealth Scientific and Industrial Research Organiza- tion, W. A. Regional Laboratory, Perth, Western Australia.
In the study of animal be- haviour certain individualistic aspects such as maternal be- haviour, dominance and aggres- sion must be studied at close hand. However, the organiza- tion, dispersion and movement patterns of grazing animals are difficult to study at close hand. They are also dynamic in nature. These aspects of behaviour are particularly ‘important to range management in arid areas.
Arnold and Baas Becking (un- published) h a v e u s e d cinepho- tography to study the causes of dispersion and movement pat- terns. The camera on the ground, however, can only record a lim- ited area and cannot quantify distances between individuals or between groups.
There are two problems in- volved, firstly to obtain a vant- age point from which the organi- zation, dispersion and movement can be seen and secondly, to re- cord the relevant data. This sec- ond point is extremely difficult because what is relevant is often unknown until some analyses have been done.
TADMOR, N. H., D. HILLEL, S. DAS- BERG, S. J. ELLERN, AND Y. HARPAZ. 1964. Establishment and mainte- nance of seeded dryland range un- der semi-arid conditions. Project AlO-CR-45. Res. rep. for period March 1963-March 1964, submitted to U.S.D.A., Volcani Inst. Agric. Res., Rehovot.
WANG, JENYU, 1960. A critique of the heat unit approach to plant re- sponse studies. Ecology 41: 785- 790.
WENT, F. W. 1949. The effect of tem- perature on plant growth. Ann. Rev. Plant Physiol. 4: 347-362. WILSIE, C. P., AND R. H. SHAW, 1954.
Crop adaptation and climate. Ad- van. Agron. 6: 199-252.
Attwood and Hunter (1957) used a telescope to plot positions of sheep on a hill face. This has obvious limitations. The obvious vantage point is an aircraft and the tool a camera to take vertical photographs. Measurements can be made on the photographs. The advent of computers overcomes the major problem of handling and storage of large quantities of data from which relevant infor- mation can be extracted.
Most of the aerial survey work reported in the literature, e.g. Grzymek and Grzymek (1960)) Newsome (1965) and others, has been aimed at the evaluation of population size in relation to area, habitat or movement in- dices. Photographic sampling was generally regarded as un- suitable for the purpose. How- ever, Crofton (1958) used aerial photographs for the detailed study of sheep orientation under intensive grazing.
The use of a light aircraft, a camera, and a digital computer was investigated as a technique for the quantitative evaluation of dispersion of sheep within various environments. Criticism by range managers and research- ers of the validity and impor- tance of the approach is sought.
FIG. 1. Map of north western New South Wales with properties sampled and ’ rainfall isohyets.
were chosen for the work. These were: Kayrunnera, about 120 mi northeast from Broken Hill and Mt. Murchison on the River Darling near Wilcannia (Fig. 1). Another prop- erty, Mulberrygong on the Mur- rumbidgee near Hay, iYas chosen but. few results were obtained be- cause of heavy rain at the time of the first survey.
Kayrunnera (100,000 acres, 8 in. rainfall) on gibber country (facetted pebbles or stone pavement) is simi- lar in many ways to Mt. Murchison
(123,000 acres, 10 in. rainfall) on flat country. The main associations at both are Kochia pyramidata- Kochia sedifolia (Beadle, 1948). At Mt. Murchison there was some old man saltbush (Atriplex num-
mularia) and some herbaceous
plants. Mulberrygong (15’ in. rain- fall) on the other hand, is on the riverine plain and has little bush in the natural grassland (Danthonia caespitosa grassland, Williams, 1961). These habitats are illustrated in Fig. 2. The properties chosen all had air- strips and the sheep were ‘condi- tioned to airplane shadows and noise. The sheep surveyed were all South Australian Merinos remain-
ing on pasture yearlong with no salting or supplementary f eliding. Ewes and rams were kept separate except for an eight week m&ing pe- riod. Animals were mustered twice a year for shearing and *crutching, which was the only contact the sheep had with man. The rest of the man- agement was’ limited to maintenance of fences and maintenance and con- trol of water, latter mostly by means of a light aircraft.
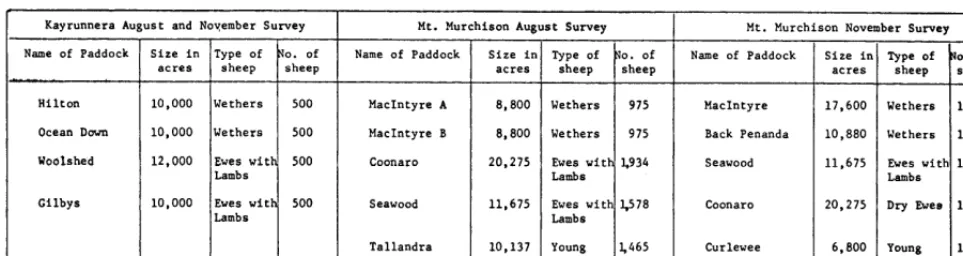
Kayrunnera Carrie’s 28.8 sheep/mil, Mt. Murchison 39.8, and Mulberry- gong 512.0. A map’ of each property, showing paddock. sizes and shapes and position of waterholes, was available. The sex, age, and number of sheep in eat? paddock was known. (Table 1). Two’ paddocks each with ewes and lambs from 5-8 months old, and two *with wethers were used on ‘each property for the surveys. Two surveys were carried out, one in August! and the other in Novem- ber, 1965,
Photqgraphic Methods.-A Cessna 205 light aircraft was used. It is a high-wing craft permitting full visi- bility. One of the 3 doors can be re- moved to allow vertical photography. All the photography was done with
a Hasselblad 500C camera. The lens was a Zeiss Planar with a focal length of 80 MM (3.14 in.). The re- sultant scale at negative stage is 1: 2600. The actual image dimensions on the negative are 2% x 2% in.
The crew consisted of the pilot, the guide (owner or manager of the station), the photographer and senior author.
Ground observations of type and availability of feed were made. A few observations of the sheep graz- ing were made but they could not be approached closer than 400 yards. Experimental Design.-An attempt was made to minimize “local” cli- matic effects on behaviour by choos- ing a period when weather forecasts predicted similar weather over a large area for several days. The sur- vey could only be carried out by completing one property at a time.
The basic hesign could be de- scribed as factorial. Four photo- graphs per paddock were taken. There were two paddocks per sex. Replication in time was provided by one morning and afternoon flight on two consecutive days, i.e. 4 (photo- graphs) : 2’ (paddocks) : (2 sexes): 2 (am., pm.>: 2 (day ‘1, day 2): 2
(stations) = 128 observ’ations for generalizations over two stations. In addition at Mt. Murchison there was a paddock of young ewes and lim- ited data from Mulberrygong.
In November 1965 the design was basically the same as the first sur- vey except that five photographs per paddock were taken at Mt. Murchi- son. (For alteration of paddocks and sheep sampled, see Table 1).
The factorial design then was: 5 or 4 : 2 : 2 : 2 : 2 : 2, except for the afternoon flight on the second day at Kayrunnera which was prevented by a dust storm.
The idea was to photograph at fixed times after dawn and midday drinks. This was based on the indi- vidual grazier’s knowledge of his sheep. The actual times of day and weather conditions are shown in Table 2.
FIG. 2. Close-up photograph of typical vegetation at the three properties surveyed:
Top, Kayrunnera; Center, Mt. Murchison; Bottom, Mulberrygong.
ners were avoided. When a flock of cal photograph was taken. Location sheep was spotted, the altitude was of the flock, and the corresponding checked or corrected to 700 ft.; the negative numbered for identifica- aircraft banked steeply; and a verti- tion, was mapped. Each photograph
would cover 5.35 acres at 700 ft. However the error was probably considerable and no measure of it was obtained.
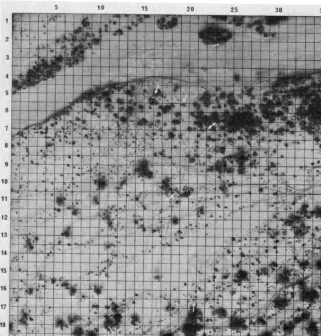
Computational and Statistical Methods. - Each photograph was a statistically independent unit when the sheep were isolated into small groups as they were in these sur- veys at Kayrunnera and Mt. Murchi- son. The photographs were enlarged to 10 x 10 in. A grid of the same size with 0.25 in. spacings was superim- posed. Each sheep was located (Fig. 3) and its coordinates punched in relation to the grid into Hollerith card. A computer program was de- veloped which calculated the punched information from the pho- tograph.
The parameters thus obtained were (1) total numbers of sheep per photograph = flock, (2) mean num- ber of sheep per cell of the grid
(theoretically 12 x 12 ft but would vary with errors in height), (3) mean distance of every sheep from the others, the variance and distri- bution of these distances and the index of spread (SD of distance dis- tribution/v/ where N is the number of sheep per flock). Standard analy- ses of variance were done on these parameters or their transformations.
The distance between sheep within a cell = 0. This produces multimodal distribution of distance from indi- vidual sheep from each other if there are several sub-flocks in a photo- graph. Increasing cell size would give different indices of spread and tend to unimodal distribution.
No movement of stock between paddocks took place at Kayrunnera between the two surveys. Both sur- veys, therefore, are comparable ex- cept for the morning and afternoon contrast. The latter comparison be- came non-orthogonal (unbalanced) because of a dust storm which pre- vented photography on the afternoon of the second day. At Mt. Murchison some changes took place (Table 1). Strictly speaking, no balanced com- parison in the orthodox statistical sense could be made. However, there is no doubt that, with some qualifi- cations, the general difference be- tween the two surveys can be dis- cussed.
Results
Table 1. Names and sizes of sites sampled with iype and numbers of sheep within sites.
Kayrunnera August and November Survey Mt. Murchison August Survey
Name of Paddock Size in Type of Xo. of
acres sheep sheep
Hilton 10,000 Wethers 500 MacIntyre A
Ocean Down / 10,000 IWethers / 500 MacIntyre B
Name of Paddock
Woolshed
Cilbys
Coonaro
Seawood
Tallandra
8,800 ] Wethers 1 975
8,800 / Wethers 1 975
20.275 Ewes wit l,934 Lambs
11,675 Ewes with 5578 Lambs
10,137 Young
I 5465 Ewes
Table 2. Average times of aerial sampling and weather conditions.
was 1 18 and 1.09 for August and
Mean Weather Conditions during Sampling
Time of
Sampling DAY 1 DAY 2
August a.m.
p.m.
November a.m.
p.m.
August a.m.
p.m.
November a.m.
p.m.
8.50 Cloudy, calm Cloudy, calm
3.55 Cloudy, calm Cloudy, light N.W.
winds
8.00 Sunny, calm Overcast, windy
4.35 Overcast Dust Storm
8.00 Light Cloud Very High Cloud
3.30 Overcast Overcast, light N.
winds
10.00 Light rain Cloudy
4.35 Overcast Sunny and Windy
November respectively. There
were no significant ‘differences due to postulated variables nor, generally, between surveys.
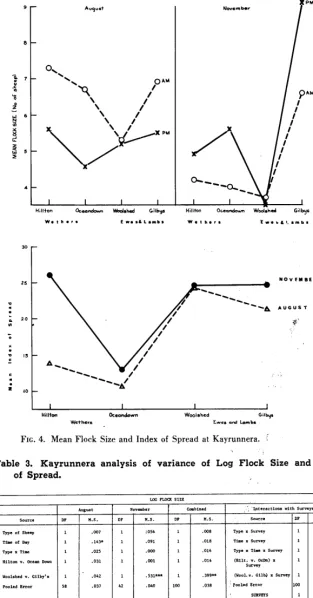
The mean flock sizes, and in- dices of spread for the two sur- veys are plotted for different paddocks in Fig. 4. The analyses of variance are in Table 3.
In August flock size was large in the morning (P < 0.05) but in November this was reversed. In the combined analysis this inter- action is significant (P < 0.05). There was also a significant
(P < 0.05) decrease in flock size from 5.85 to 5.10 from August to November. One striking differ- ence was that of flock size in the two paddocks of ewes.
The significant differences in index of spread were that ewes with lambs were more widely spread than wethers. There was
also a significant difference be- tween the two wether paddocks.
The mean difference between
two surveys is almost significant
at 5%. ’
Patterns at Mt. Murchison. - Flocks were classified into types as wethers, ewes and lambs and young ewes in August and weth-
ers, ewes and lambs, ewes
(young or dry) in November. The mean number of sheep per cell was 1.18 and 1.13 in August
and November respectively -
very similar to Kayrunnera. There were no differences due to any of the postulated variables.
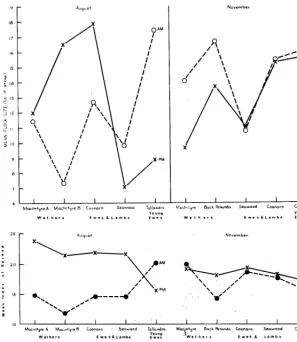
The mean flock sizes and in- dices of spread for the two sur- veys are plotted for different paddocks in Fig. 5. The analyses of variance are in Table 4.
Flock size was about twice that of Kayrunnera. There were only two significant effects in
Mt. Murchison November Survey
Name of Paddock
Machtyre
Back Penanda
Seawood
Coonaro
Curlewee
11,675
20,275 1 Dry Ewes 11,700
11,476 6,800 1 z"
the flock size data, both in Au- gust. These were an interaction between type of sheep and time of day and a difference between two ewe paddocks.
Index of spread effects were also limited to August where there was a significant interac- tion between type of sheep and time of day.
Discussion
Behaviour patterns are dy- namic and cannot be described
from random sampling. Sam-
pling must be related to the vari- ables influencing behaviour. In this work we were not attempt- ing to describe any behaviour pattern in detail but were assess- ing the technique by the preci- sion with which it detected vari- ability in certain behavioural characteristics. We knew from previous observations that the variables c au s in g sub-grouping of a sheep flock were age, breed, topography, vegetation distribu- tion and water locations.
property 01‘ between Kayrun- nera and Mt. Murchison.
It is now appreciated that mean distance to nearest neigh- bow would be a more satisfac- tory and direct measure of con- tiguity of individual animals than mean number of sheep per occupied cell, and could be pro- grammed from coordinates or measured directly with dividers. The convenience of recording position as at the centre of cells also has its disadvantages, and some compromise in cell size to avoid serious errors of grouping is necessary. Greater accuracy would be achieved by use of fine coordinates and abandonment of recording by cell frequencies. The property mean values for three behaviour indices were as follows: Kayrunnera for August and November, Number per Cell 1.18, 1.09, Flock Size 5.9, 5.1, Index of Spread 17.6,ZZ.l respec- tively. The same for Mt. Murchi- son were 1.18, 1.13; 12.0, 13.3; and 18.0, 1’7.9.
ity, was on number of sheep per
cell. This was 1.66 which was sig- than at the two other properties. nificantly higher (P < 0.001)
On the other hand it did not vary significantly at all on a
Table 4. Mt. Murcbison analysis of variance of Log Flock Size and Index of Spread.
AUGUST NOVEMBER
SOUIW DF MS. SOU-W DF MS.
Log Flock Size
Type of Sheep 2 ,014 Type of Sheep 2
Type x Time of Day
,112
2 ,308” Type x Time of Day 2
McInt. “A” v ~~~.. ~_ ,043
McInt. “B” 1 ,006 McInt. v. B. Penda. 1 ,124
Coonaro v. Seawood 1 .553* Coonaro “. Curlewee 1 ,002
Pooled Error 72 ,085 Pooled Error 92 .074
Index of Spread
Type of Sheep 2 .7 2 2.0
Type x Time
Type of Sheep
2 274.9: Type x Time 2 2.4
McInt. ‘A” v.
McInt. “B” 1 59.8 McInt. v. B. Penda. 1 91.3
Coonaro Y. Seawood 1 .3 Coonaro v. Curlewee 1 15.7
Pooled Error 12 36.7 Pooled Error 92 59.4
* = P < 0.05
In Table 5 we compare signifi- cant differences in one charac- teristic (flock size or index of spread) with the difference in the other. Clearly there is no close relation of these two char- acteristics as one would logically expect. In some cases this could be explained on vegetation dis- tribution which could concen- trate a few sheep into a small area. In other cases the sub- grouping of sheep in the flock could give a large index of spread for a large flock. How- ever, differences over pooled data indicate that these two characteristics are basically in- dependent.
Auqust
I
1 I I IW;llton 4emldc.m welshed Cilbys
NOV FMIIER
Hillion
W&hers
FIG. 4. Mean Flock
Table 3. Kayrunnera of Spread.
occ.mdown Woolshcd GilbljS
fwcs and Lambs
Size and Index of Spread at Kayrunnera. -
analysis of variance of Log Flock Size and Index
r
i-
r
L -
IP -
1
1
1
1
1
28
z
1
1
1
1
1
1
57
-
l - PGOS,
LCG FLna SIZE
*“@St t November \ Combined
KS. DP M.S. DP M.6.
.007 1 :056 1 .ws
.143* 1 .091 1 .018
.ozs 1 .OOQ 1 .016
.031 1 .Ofll 1 .014
.042 1 .531** 1 .399*
.037 42 .040 100 .036
25.6 54.9
165.1 606.3
1041.6* 799.s*
Pooled Error
Type I survey 1
Time I survey 1
lype I Day I survey 1
Type I Time 1: survey 1
@Jilt. V. ocm) I 1 survey
(Wool 0. GilbJ x Survey 1
Pooled Error 98
SuRvImS 1
n.s
.os4
.21s*
.009
.016
.17s*
.038
.104*
222.7
105.6
130.8
2.8
331.4
32.2
175.0
568.8"
not just at random. In this work there were 64 observations for main comparisons, i.e. type of sheep, days, time of day. In order to detect a significant difference
(P < 0.05) in flock size or index of spread would require a 25% difference between means. In- creased numbers of photographs would decrease this.
The technique, as described,
would need modification to
study specific problems. For ex- ample to map the population as a whole; to measure distances between sub-groups on single photographs. Further study has to be done of situations where each photograph is not a sta- tistically independent unit, i.e. when the animals are in a single flock in a paddock. The basic
technique could be widely
adapted to analyze both animal and vegetation population distri- bution patterns when quantita- tive measurements between in- dividuals are wanted. However, its main use seems to lie in ani- mal behaviour patterns and the environmental factors that influ- ence them.
Conclusions
It is felt that aerial photog- raphy and the use of digital com- puters provide extremely valu- able facilities for studying pat- terns of animal behaviour. By its very nature, the material is char- acteristically variable. On the average, a 25% difference, to be significant, should be based on about 100 independent observa- tions. These can be collected and stored at the expense of not more than $400-500 including aircraft and travelling expenses for per- sonnel. The economy of sam- pling, i.e. the speed of collection and analysis of results, consider- ing the salaries of personnel, compares rather favourably with any surf ace investigation. The
precision of information on
Novcm her
potential in evaluating param-
August
:
s
I
’ \ /AJAMI’
/I
1’ \
\
F-x PM
I
d
\
/
\
I
x \\
I
/q
\ \
:
’
I/
I+. 5. Mean Flock Size and Index of
aid of an electronic computer, changes, the possibility of pre- conversion of photographs into dicting the condition of a range quantitative indices can be from’ patterns of behaviour can achieved in seconds. now be seriously considered.
Since indices of behaviour are sensitive to environmental
Considering simulation pro- grams, the method we hope, has
c
$read at Mt. Murchison. I 1
Table 5. Comparison of Mean Indices of Behaviour.
Comparison Flock Size Index of Spread
_-
AM August Mt. Murchison PM Ewes August Kayrunnera Wethers
Woolshed November Kayrunnera Gilbey’s
Hillton November Kayrunnera Oceandown
Coonaro
11.7 12.4 5.7 6.1 ‘. 3.6 ‘)
Q >: 4 7.8 1 4.5
j 4.8 . ( 15.2 (
*
15.2 ** 20.9 22.9
** 12.3 24.6 24.7 26.2 :I: 13.0 18.2
August Mt. Murchison Seawood 8.3 18.0
Difference Between Means Significant at * = P < .05 ** = P < .Ol *** = P < .OOl
eters for arid-zone grazing stra- tegies.
LITERATURE CITED
ATTWOOD, P. R., AND R. F. HUNTER. 1957. A method for studying the preferential grazing of hill sheep. Brit. J. Anim. Beh. 5: 149-52. BEADLE, N. 1948. The vegetation and
pastures of western New South Wales with special reference to soil erosion. Govt. Printer, Sydney. CROFTON, H. D. 1958. Nematode para- site populations in sheep on low- land farms. VI. Sheep behaviour and nematode infections. Parasit- ology. 48: 251-260.
GRZYMEK, M., AND B. GRZYMEK. 1960. Census of Plains animals in the Serengeti National Park, Tangan- yika. J. of Wildl. Manag. 24: 27-37. NEWSOME, A. E. 1965. The abundance
of red kangaroos, Megaleia rufa (Desmerset) in Central Australia. Aust. J. Zool. 13: 269-87.
WILLIAMS, 0. B. 1961. Studies in the ecology of the Riverine Plain. III. Phenology of a Danthonia caespit- osa Gaudich grassland. Aust. J. Agric. Res. 12: 247-59.
USDA Reporfs Drop in 1966 Grass- hopper Infesfafions-Less than 11.4 mil. acres of rangeland were found severely infested in survey of 17 Western States conducted last fall by USDA’s Agricultural Research Ser- vice. This is about 5.2 mil. acres less than 16.6 mil. acres found eco- nomically infested previous fall, but still well over 8.7 mil. acres found infested in these States in 1964.
The Journal has received notice that copies of the 1966 Annual Re- port of the office of Water Resources Research are available from the OWRR, Department of the Interior, Washington, D. C. 20240. Limited numbers of the 1965 Annual Report containing background information on this new cooperative program are also available.
Umpqua National Forest Supervi- sor Promo&i--F. Leroy Bond, super- visor of the Umpqua National Forest at Roseburg since January of 1965, has become an assistant regional for- ester for the Forest Service’s South- western Region, Albuquerque, New Mexico.