SELF ESTEEM OF CHILDREN WITH SPECIFIC
SPEECH AND LANGUAGE DIFFICULTIES
Geoff Lindsay
1, Julie Dockrell
2,
Becky Letchford
2and Clare Mackie
1Address for Correspondence:
Professor Geoff Lindsay
Director
CEDAR
University of Warwick
Coventry CV4 7AL
Abstract
This study examines the self esteem of children with specific speech and language
impairment. A sample of 69 children were first identified in Year 3. The present
study focuses on their self esteem as measured by the Self Perception Profile for
Children when the children were in Years 6 and 7. Data are presented for the
children’s self perception and for teachers’ perceptions on the same dimensions. The
children with SSLD had lower ratings of scholastic competence than typically
developing peers, and teachers in Year 6, but not Year 7, rated the children
significantly lower on these two dimensions than the children rated themselves.
Comparisons between measures at Year 3, 6 and 7 revealed substantial continuities
for both children’s and teachers’ perceptions between Year 6 and 7, and for teachers
from Year 3 to Years 6 and 7. The results are interpreted with reference to theories of
self esteem and the educational needs of children with SSLD.
This study was supported by a grant to Professor Julie Dockrell and Professor Geoff
SELF ESTEEM OF CHILDREN WITH SPECIFIC SPEECH AND LANGUAGE DIFFICULTIES
Geoff Lindsay, Julie Dockrell, Becky Letchford and Clare Mackie
Children with language impairment not only experience difficulties in
communication, evidence is accumulating that they are also likely to have other
significant problems. This evidence is most evident in the link between language
impairment and literacy (Beitchman, et al, 1996; Botting, et al, 1998; Dockrell and
Lindsay, 1998; Stothard, et al, 1998). Evidence is now indicating the association
between oral language problems and social/emotional/behavioural development. This
has been reported by practitioners when describing the problems experienced by
children with specific speech and language difficulties (SSLD) (Dockrell, et al, 1997),
and also when identifying the range of difficulties present in individual children
whom they have identified with SSLD (Dockrell and Lindsay, 2000; Botting and
Conti-Ramsden (2000).
Evidence on the association between language impairment and
social/emotional/behavioural development also comes from clinic samples. Levy, et
al, (1996) report a strong relationship between attention deficit hyperactivity disorder
(ADHD) with both speech and reading difficulties. Cohen, et al, (1998) report on a
study of 380 children aged 7 – 14 years referred for child psychiatric services with
identified and unsuspected language impairment. They found greater deficits in social
cognitive processing among those with language impairment than those whose
language was developing normally.
A study by Lindsay and Dockrell (2000) of 69 children with SSLD also found a
higher prevalence of behaviour difficulties than would be expected in a typically
developing group of children of the same age (7-8 years). Using the Strengths and
Difficulties Questionnaire (Goodman 1994, 1997; Yude, et al, 1998) teachers rated
44.8% of the sample having problems with hyperactivity and 27.1% having peer
found that parents reported similar levels of difficulty for hyperactivity (44.6%) but
parents were more likely to report peer problems (46.2%) and conduct problems
(36.4).
In addition to behaviour problems, there has also been recent interest in children’s self
perceptions. There is a substantial body of research that has investigated this domain
among both typically developing children and those with a range of difficulties. This
field concerns the set of attitudes and beliefs that an individual holds towards the self
(Coopersmith, 1967). To some extent this is influenced by the distance between the
self-image and the person’s ideal self, that is between what the person thinks they
themselves are like and what they would wish to be. Harter (1999) argues that self
esteem is influenced in interactions: others’ behaviour affects the child’s self
perceptions, with negative feedback or rejection presenting a risk of low self esteem.
Studies have also indicated that it is necessary and useful to distinguish different
elements of self-image as well as considering a global self-esteem or self-worth
measure (Harter, 1989). Indeed the earlier interpretation of self concept as
uni-dimensional has been superseded by a consensus on multi-uni-dimensional models of the
self (Harter, 1999). These dimensions change as a child develops. Harter and Pike
(1984) report that four – to - seven year old children can make reliable judgements
about the following domains: cognitive competence, physical competence, social
acceptance, and behavioural conduct. However, these dimensions are not fully
differentiated. For example, factor analyses reveal the cognitive and physical items
combine into one competence factor, while the social acceptance and behavioural
conduct items combine into a second. Harter (1989) argues it is not until middle
childhood that children can make meaningful and reliable judgements about the
global construct of self-worth: even though they may possess a sense of self-worth,
they do not have a concept that they are able to articulate such that it can be tapped in
self-report measures.
Other studies have presented evidence for a relationship between self perception and
performance. For example, academic performance has been found to correlate with
of causality. It appears that there is a reciprocal interactive relationship; that is,
perceptions of perceived competence and self-worth both impact on the behaviour
itself, e.g. academic performance, while success or lack of it impacts on perceptions
(Marsh, 1997). Some authors have argued that causality is predominantly from
achievement to self concept (Byrne, 1996).
A recent study by Muijs (1997) of 1001 children of similar age (mean age 9:5 at time
1 and 10:5 years at time 2) provides useful evidence on this issue. He found from
regression analyses that school achievement at time 1 was a stronger predictor of
academic self concept a year later than the other way round. A simple structural
equation model supported this. The strongest predictors of school achievement from
time 1 to 2 were academic achievement (time 1 to time 2 r = 0.79) and academic
self-concept ( time 1 to time 2 r = 0.55). However, while academic achievement at time 1
predicted academic concept at time 2 at r = 0.26, the path for academic
self-concept time 1 to academic achievement time 2 was only 0.11. Hence, although
academic self-concept affects academic achievement, a stronger relationship is found
with academic achievement affecting academic self concept a year later, at least
among this large sample of Flemish primary school children. The weight of evidence
(e.g. Muijs, 1997) supports the view that while there is an influence of academic self
concept on academic achievement, the more powerful relationship is the influence of
academic achievement on academic self concept.
The Muijs (1997) study, and that reported here both indicate the importance of
separating elements in self-concept. A number of studies have failed to find clear
evidence of relationships between global self-concept measures with academic
attainment in typically developing children (e.g. Wylie, 1979), while there are now a
number of studies which indicate that academic achievement is linked to academic
self concept. Gresham and MacMillan (1997) also conclude that students with a
range of mild learning disabilities have lower academic self-concepts but not global
self-concept, than typically developing peers. In particular, lowered academic self
concept, but also perceptions of peer relationships have been revealed; and these have
Children with language difficulties may be considered to be at higher risk for
impaired self esteem. Not only is there a known link between language difficulties
and lower levels of academic attainment, but also impaired communication ability
may influence perceived competence directly. For example, language difficulties
may, of themselves, lead to other children having lower estimation of a child’s
competence. Also, a child with language difficulties is likely to have more difficulty
in social interactions, resulting in reduced ability to engage in those which either
demonstrate competence per se, or allow negotiation of perceptions.
Furthermore, it might be hypothesised that a similar mechanism operates for social
acceptance. A child with SSLD might perceive their social skills as lower than those
of typically developing peers, given their impaired communication ability. This in
turn might affect the behaviour of peers towards them, so reducing in absolute terms
their level of social acceptance. Hence, there are reasonable grounds for
hypothesising that children with SSLD might be subject to these influences in each
direction for social acceptance. Furthermore, given the association between learning
difficulties and behaviour problems, a similar two-way influence might be present in
this domain also. This suggests an interactive effect between these factors.
Conti-Ramsden and Adams (1995) support the latter perspective, suggesting that peer
interaction between children with specific language impairment (SLI) and typically
developing peers is impaired and mainly negative, with the SLI children having
difficulties making their views known and influencing the other children. However,
in a study of 14 children aged 8 – 14 years who probably meet the criteria for primary
language difficulty, McAndrew (1999) found no significant difference between the
mean scores of the sample and the standardization samples for either the Coopersmith
Self-Esteem Inventory (Coopersmith, 1967) or the Piers-Harris Children’s Self
Concept Scale (Piers, 1984). These are uni-dimensional measures producing a global
self esteem estimate and there are concerns about their reliability and validity (Wylie,
In the present paper we address self esteem in a sample of children with specific
speech and language difficulties. The present paper provides information on self
perceptions of the children at Years 6 and 7, when they were about 11 and 12 years of
age respectively. Comparisons with their self esteem when assessed in Year 3 at
about 8 years of age are also reported (Lindsay and Dockrell, 2000).
Methodology
Sample
A sample of 69 children (17 girls, 52 boys) with specific speech and language
difficulties was identified at Year 3 (mean age at assessment 8;3, range 7;6 – 8;10).
The sample included 59 children from two local education authorities, identified by
professionals, and 10 from residential schools for children with SSLD. The present
study comprised 67 of the same children at Year 6, mean age at assessment of 10;9
(range 10;2 to 11;5) and 68 in Year 7, mean age as assessment 12;1 (range 11;5 to
12;7).
In addition, two comparison samples were created in Year 6, where practical. The
first was to allow the self perceptions of the SSLD sample to be compared with those
of typically developing peers in the UK, to provide a more appropriate comparison
than with the original standardisation sample from the United States. The second
comparison sample of children, with comparable levels of special educational needs
but not in the same domain of specific speech and language difficulties, was to allow
an examination of a more generalised SEN effect.
For each SSLD child in mainstream a typically developing child was selected by the
teacher, who was asked to choose a child from the class of the same gender, and who
was in the average range with no special educational needs: N = 42, mean age 11;4
(range 10;5 to 11;6), 29 boys, 13 girls. Teachers were also asked to select a
same-gender child from the class who was at the same stage of the Code of Practice, e.g.
had a statement for problems other than SSLD, or at Stage 3 or 4 if that was the case
Such comparisons were not always possible, e.g. they were impossible to select in
special language schools, hence the smaller sample sizes for the comparison groups.
Attainment of the SSLD group
When originally assessed in Year 3, mean age 8:3, the children had significantly
impaired development on a range of abilities including language and literacy
(Dockrell and Lindsay, 1998). The re-assessments in Years 6 confirmed the
persistence of these difficulties. The children’s mean language standard scores
continued to be significantly below the population mean (e.g. British Picture
Vocabulary Scale: mean standard score 81.9, SD 10.8; British Ability Scales Verbal
Composite mean 81.1, SD 16.2), Test of Reception of Grammar mean 81.7, SD 12.5.
Attainment scores were also depressed, e.g. BAS II Word Reading mean 79.1, SD
12.8; BAS II Spelling mean 81.8, SD 15.3. Hence, on a range of language and
literacy measures the SSLD sample mean was at about the 10th centile, representing a substantial degree of impairment in each domain. The overall picture of the
individual assessments therefore confirms that the sample of children identified at
Year 3 continued to have substantial language and literacy difficulties in Year 6.
Procedure
The children originally completed a measure of self esteem at Year 3. In addition,
teachers also completed a parallel self esteem measure, and teachers and parents
completed rating scales of social-behavioural development, and were interviewed
(Lindsay and Dockrell, 2000; Dockrell and Lindsay, 2001). The present study
repeated this design, with self esteem measures at Year 6 and 7 for the children and
for teachers.
Measures
The present paper is primarily concerned with self perceptions or self-esteem. At
Year 3 this was measured using the Pictorial Scale of Perceived Competence and
Social Acceptance for Young Children (PSPCSA) (Harter and Pike 1984)). At Years
was used. Each has acceptable psychometric properties (Harter, 1982; Harter and
Pike, 1984; McGuire, 1994).
The PSPCSA comprises four scales each with six items: cognitive competence,
physical competence, peer acceptance, and maternal acceptance. The version for 6/7
year olds, used in the first part of the study, comprises separate report booklets for
boys and girls, with comparable activities but boy or girl figures respectively. The
child chooses one of two responses to a verbal statement from the researcher, and they
indicate whether they are like this child a lot or a little. Hence each of the 24 items
has a possible range of 1-4 and each scale a possible range of 6-24. The teacher’s
version excludes the maternal acceptance scale, but is otherwise identical. It is
possible to compare a child’s self perception with the teacher’s perceptions of the child’s actual behaviour.
The Self Perception Profile of Children comprises six subscales, addressing five
specific domains and a global measure: scholastic competence, social acceptance,
athletic competence, physical appearance, behavioural conduct, and global self-worth.
Each subscale comprises six items. Children are presented with two written
statements as alternatives and asked to select which is most like them. They then
choose whether this statement is ‘really true of me’ or ‘sort of true of me’. Hence, as
with the PSPCSA, there is a four point scale for each item, and a possible range of
6-24 for each subscale. In each case, changes were made to the wording of the
measures both to anglicise and to simplify language without altering meaning. In
addition, the SPPC was read to the child by the tester to ensure the child understood
and their responses were not compromised by their poor literacy skills.
A further modification was to colour code the child’s answer sheet. The responses to
the left hand statement were coded dark green for ‘really true for me’ and light green for ‘sort of true for me’. By comparison, the right hand statements were coded dark
and light purple. Finally, the title of the sheet was ‘What I Am Like’. These changes
were made to improve user-friendliness of the SPPC for children with speech and
The teacher version parallels the child version, but the teacher rates their perception of
actual behaviour not how the teacher thinks the child would answer. The number of
items per subscale is 3 (with potential range of 3-15) and there is no global self worth
scale.
The SPPC manual (Harter, 1985) does not provide a single set of standardisation data:
rather, data are presented for two or three comparative samples. Consequently the
largest sample was chosen as the standardisation norms against which to compare
results from the present study.
Results
Investigation of the distributions of the mean subscale scores for the SPPC revealed
that the majority deviated significantly from a normal distribution
(Kolmogorov-Smirnoff one sample test). Consequently non-parametric analyses were carried out
apart from the comparison of the SSLD sample with the original standardisation
where a t-test was used, the non-parametric equivalent (Mann-Whitney test) not being
practical as only means and standard deviations were available for the standardisation,
not raw scores. To investigate whether the use of a parametric test in this case was
likely to lead to substantially different results, t-tests were also carried out to duplicate
the Mann-Whitney analyses presented below. In all cases, the results were essentially
the same with respect to levels of significance. Consequently, the use of the
parametric t-test for the comparison with the standardisation was considered
acceptable.
Comparison with standardisation samples
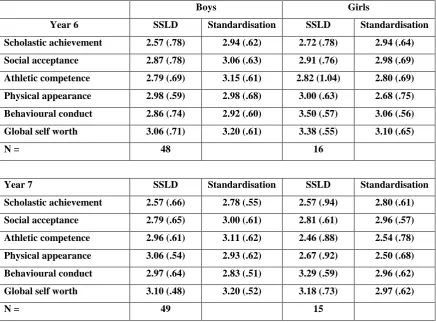
Table 1 presents the mean scores and standard deviations for boys and girls separately
for the SSLD sample children compared with the standardisation sample at Years 6
and 7.
The children’s perceptions of dimensions measured by the SPPC are all positive in
that all means are above 2.5 on the 1-4 scale (see Table 1). Both boys and girls in the
SSLD sample rate their scholastic competence and social acceptance lower than the
standardisation sample at both Year 6 and Year 7. This is also the case for athletic
competence for the boys at each age, while the SSLD sample girls rate themselves
higher than the standardisation for physical appearance, behavioural conduct and
global self worth at both ages. However, the only mean difference to reach statistical
significance was for scholastic competence for Year 6 boys (p< .05).
There are indications of an age effect in the SSLD sample, with the girls consistently
rating themselves higher at Year 6 than Year 7. This parallels an age effect reported
by Harter (1985) for the standardisation sample, where there were significant
decreases between these ages for both girls and boys for scholastic competence and
global self worth. However, no consistent age effect was found for boys in the SSLD
sample.
Further analyses were undertaken comparing the Year 7 SSLD sample with the two
comparison samples: with the typically developing children alone, using the
Mann-Whitney test, and all three samples together, using a Kruskall-Wallis one-way
analysis of variance for independent groups. Comparison of the Year 7 SSLD sample
with the matched typically developing children revealed no significant differences
except on scholastic competence (U = 974.5 (z = 2.23), p = 0.026) and social
acceptance (U = 711 (z = 3.645), p< 0.001): in both cases typically developing
children rated themselves more positively.
A similar finding was derived from the Kruskall-Wallis one-way analysis of variance
where for scholastic achievement the SSLD group had a lower mean score than that of
the typical children, but the SEN comparisons had the lowest score of the three (ϰ 2 =
14.833, df 2, p<.001) indicating the poorest perception of scholastic achievement. A
comparable pattern was found for behavioural conduct (ϰ 2 =6.686, df 2, p= .035)
while for social acceptance it was the SSLD group which rated themselves lowest,
Hence the evidence from two comparisons, with the original standardisation and with
typically developing same gender peers in the same classes, suggests that children
with SSLD have poorer self perceptions with respect to scholastic achievement and
peer acceptance. In addition, they have poorer perceptions of social acceptance than
children with other special educational needs of similar severity.
Gender There were no significant gender differences at either Year 6 or Year 7 (p >
.05) other than for behavioural conduct for Year 6 only, where boys rated themselves
significantly worse than did the girls (Mann-Whitney U 171 (z = 3.25), p < .001).
This replicates the standardisation finding. However, in the standardisation sample
boys also had more positive self perceptions than girls of athletic competence,
physical appearance and global self worth, whereas in the SSLD sample there were no
significant differences. Given the general lack of gender differences, subsequent
analyses will be presented for the total sample.
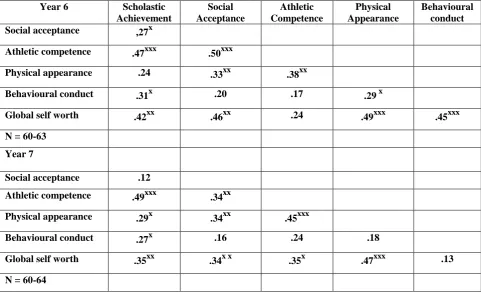
Inter-relationship of subscale scores
Table 2 presents the correlations between the subscale of the SPPC for both Year 6
and Year 7. Spearman’s rho was used for all correlation analyses. At both times
there is a high degree of inter-correlation of subscales with 11 out of 15 correlations
significant at Year 6, and 10 at Year 7. In each case there is a significant relationship
at both Year 6 and Year 7 between the scholastic achievement subscale and athletic
competence (r = .47, p< .001 at Year 6; r = .49, p< .001 at Year 7), behavioural
conduct (r = .31, p = .013; r = .27, p = .032) and global self worth (r = .42, p = .001; r
= .35, p = .005). Scholastic achievement was also significantly correlated with social
acceptance at Year 6 (r = .27, p = .031) but not at Year 7 (r = .12, p = .357).
Conversely, scholastic competence was correlated significantly with physical
appearance at Year 7 (r = .29, p = .021) but failed to reach significance at Year 6 (r =
.24, p = .058).
Inspection of Table 2 reveals that social acceptance was also correlated at both Year 6
appearance (r = .33, p = .009) and global self worth (r = .46, p < .001; r = .34, p =
.007).
A further analysis of the SPPC completed by the typical comparison group in Year 7
(n = 39-41) revealed a similar pattern in general. For example, there was a significant
relationship between scholastic competence and athletic competence (r = .32, p =
.044), behavioural conduct (r = .50, p< .001) and global self worth (r = .58, p < .001),
but no significant relationship with social acceptance (r = .14, p = .382). The
correlation with physical appearance was similar, but owing to the smaller sample
size failed to reach significance (r = .27, p = .094). However, unlike the SSLD
sample, there was no significant correlation (p >.05) between social acceptance and
any other subscale.
Table 2 here
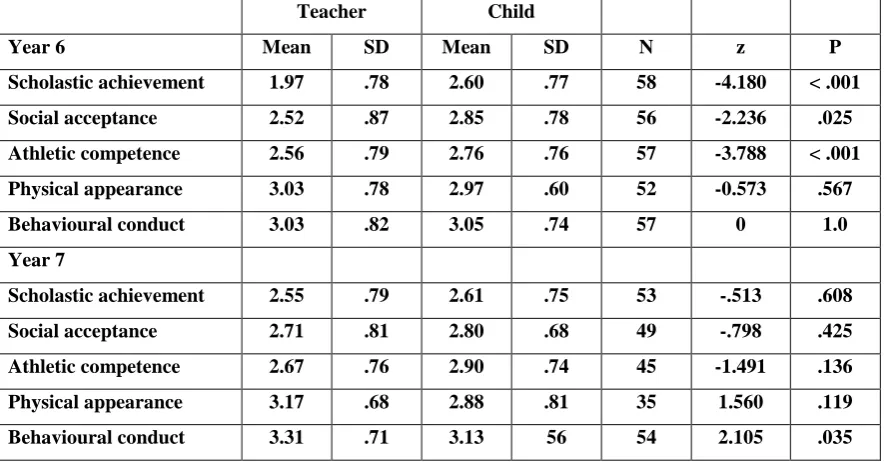
Comparison of children’s and teachers’ perspectives
Comparisons of teacher and child ratings are presented in Table 3 for the SSLD
sample in Year 6 and Year 7. Teachers gave significantly lower scores on scholastic
competence, social acceptance and athletic competence at Year 6 only indicating they
rated the children as less adequate than the children rated themselves. At Year 7 only
behavioural conduct was significantly different, with teachers rating the children
better behaved than the children rated themselves. Also, in general, the correlations
between teacher and child ratings were non-significant (p > .05) except for athletic
competence (r= .41, p= .002) and behavioural conduct (r= .31, p = .019)
A methodological issue also worthy of note was the reluctance of teachers to
complete the physical appearance scale of the PSSC, resulting in just 40-42 teachers
completing the three items compared with 54-58 for other items. Comments from the
teachers indicated that this reflected their discomfort at commenting on the child’s
physical appearance, as required by these items. Consequently, there is a question
Table 3 here
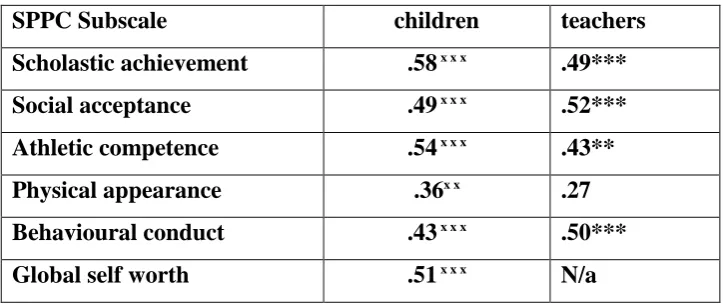
The Stability of Self Perceptions
The stability of self perceptions is indicated by Table 4 where the scores for the SSLD
sample are compared at Years 6 and 7. All subscales for the children’s self
perceptions show high levels of stability which are highly significant (p < .01) in all
cases with scholastic competence showing particularly high stability (r = .58, p <
.001). The teachers’ ratings show a similar pattern, except for physical appearance.
However, as noted above, a substantial minority of teachers declined to complete
items on this scale, and the sample size for the correlation analysis was just 34,
compared with 43-51 for the other scales.
Table 4 here
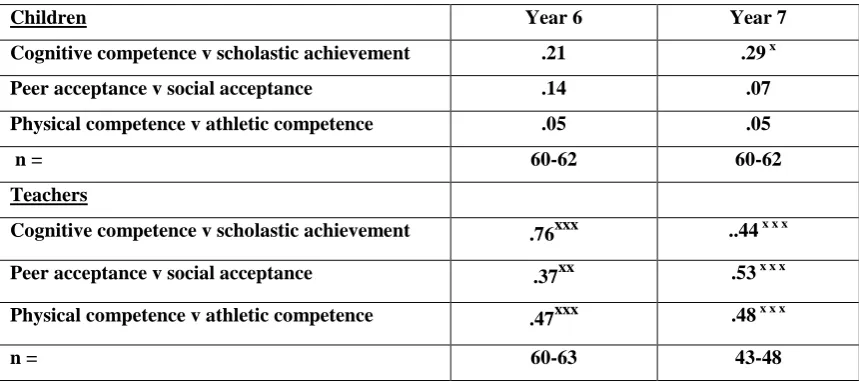
Evidence on longer term stability is provided in Table 5. The ratings recorded by the
children at Year 3 on the Pictorial Scale of Perceived Competence and Social
Acceptance for Young Children (PSPCSA) are compared with their ratings at Year 6
and 7 on the SPPC for the three domains with comparable scales: cognitive
competence v scholastic achievement; peer acceptance v social acceptance; and
physical competence v athletic competence. Information is also available for
teachers’ judgements at both Years 6 and 7.
Table 5 here
Table 5 indicates that there is low stability for children’s self perceptions from Year 3
to Years 6 and 7, and that only cognitive competence/scholastic achievement
produces a significant correlation, and only from Year 3 to Year 7 (r = .29, p = .02).
However, the correlations between teacher judgements at Year 3 compared with both
Years 6 and 7 are all significant, with a very high correlation for cognitive
stability are particularly noteworthy as different teachers rated the children on each
occasion.
Discussion
The present study of this sample of children with specific speech and language
difficulties (SSLD) at Years 6 and 7, confirms patterns revealed when they were in
Year 3. The children’s mean scores on all subscales of the Self Perception Profile for
Children (SPPC) at both Years 6 and 7 were all above the scale mean of 2.5,
indicating relatively positive self perceptions as defined by the structure of the scale.
However, relative both to the standardisation sample, and to the typical comparison
group in the present study, the SSLD group at Year 6 had lower ratings of their
scholastic competence and social acceptance; indeed their perceived social acceptance
was lower than that of the SEN comparison group. This finding differs from that
reported by McAndrew (1999) who found no significant differences between the
language-disorder group and the standardisation samples for her measures of self
esteem. Furthermore, the teachers’ views of the children’s status at Year 6 on these
two variables as well as their athletic competence, indicated even lower levels of
performance. This also replicates the finding at Year 3 for comparable scales on the
Pictorial Scale of Perceived Competence and Social Acceptance of Young Children
(PSPCSA). On the other hand, the perceptions of global self worth of these children
with SSLD do not differ from either the standardisation sample or the typically
developing comparison group. This replicates findings with a range of children with
mild learning disabilities reported by Gresham and MacMillan (1997).
Unlike the standardisation sample, the present SSLD sample showed a lack of gender
differences at Years 6 and 7. In the former, boys tended to present more positive self
perceptions on most subscales. Only with respect to behavioural conduct is there a
similar finding across the two samples, at Year 6 only, with girls seeing themselves as
better behaved in both. This lack of gender differences was also found at Year 3 on
the PSPCSA when the only significant findings were for maternal acceptance, with
The reason for the lack of gender difference in the present sample is not immediately
clear. It may be that the difficulties experienced by the children are so marked they
serve to rule out any gender differences. Alternatively the language and literacy
assessments indicated that the girls were performing significantly worse than the
boys. This reduced level of performance in the girls may serve to reduce further their
views of themselves and their attributes.
There are patterns of stability reflected in these results, which are evidenced by the
analyses of the inter-relationship of subscales across Year 6 and 7 (see Table 2) and
the correlations between the children’s ratings of themselves between years 6 and 7 (see Table 4). Correlations between children’s ratings of their cognitive/scholastic
competence/scholastic achievement are particularly stable with significant correlation
between Year 3 and Year 7 as well as Year 6 and 7. There is also evidence from
teachers’ perceptions of the children’s behaviour on the same domains having
stability from Year 3 to Years 6 and 7; cognitive competence/scholastic achievement
is particularly highly correlated at Year 6 (r = 0.76), and there is a comparable pattern
of teachers’ ratings being lower than children’s self-perceptions at Year 3 (PSPCSA)
and Year 6 (SPPC), as shown in Table 3.
The present study at Year 6 and 7, therefore, has replicated findings on the same
sample when in Year 3. These children with SSLD not only have impaired
communication ability, and reduced levels of achievement, they also rate themselves
lower with respect to their academic ability and achievement, and their relationships
with peers. Furthermore, these patterns have been formed to persist over the period
from Year 3 to Year 7, indicating a substantial degree of stability.
Conclusions
The present study has demonstrated that children with specific speech and language
difficulties at the ages of about 10 to 11 years not only have educational difficulties,
they also have lower estimations of their academic ability and their competence in
peer relationships. Furthermore, these characteristics are persistent, with evidence of
The study contributes both to the general literature on self concept, supporting
evidence which demonstrates the need to be analytic and investigate specific domains
of self perception, not just global self concept. It also extends the research on
children with a variety of learning difficulties to those with specific speech and
language difficulties.
With respect to action, the weight of evidence favours the interpretation that academic
self concept is primarily determined by academic achievement rather than the
opposite way round (e.g. Muijs, 1997). This poses a challenge to professionals
working with children with SSLD, given their significant educational difficulties.
However, despite the substantial under achievement of these children, their academic
self perception is still positive albeit significantly lower than that of typically
developing children. This suggests that either these children are denying, in relative
terms, their difficulties, the ‘aggrandisement of self’ hypothesis (Edgerton and
Sabagh, 1962), or that the experiences the children have are sufficiently supportive in
relative terms to ameliorate the negative impact of their difficulties. For example,
they may produce their judgements on the basis of progress rather than absolute levels
of achievement.
There are also implications with respect to perceived social acceptance. If social
acceptance is related, at least in part, to success at school at this stage of childhood,
then lower academic achievements are likely to affect perceptions of social
acceptance also. This effect may be ameliorated by strengths in other domains, and
the correlation between social acceptance and athletic competence suggests that the
latter may act in this way. Indeed, interviews with teachers when the children were in
Year 3 suggested this was operating in some cases (Dockrell and Lindsay, 2001).
However, given that teachers rate the children’s social acceptance lower than the children rate themselves, there is a need not only to improve children’s perceptions
but their actual social skills also.
The present study provides further evidence for the multiple and aggregating effects
communication difficulties, they have educational problems, and are also more likely
to have problems with behaviour (Lindsay and Dockrell, 2000) and self esteem. The
References
Beitchman, J.M., Wilson, B., Brownlie, E.B., Walters, H., & Lancee, W: 1996.
Long-term consistency in speech/language profiles. 1. Developmental and academic
outcomes. Journal of American Academy of Child and Adolescent Psychiatry,
35, 804-814.
Botting, N. & Conti-Ramsden, G: 2000. Social and behavioural difficulties
in children with language impairment. Child Language Teaching and Therapy
16,105-120
Botting, N., Crutchley, A. & Conti-Ramsden, G.:1998 Educational transitions of
7-year-old children with SLI in language units: a longitudinal study.
International Journal of Language and Communication Disorders, 33, 177-197.
Byrne, D: 1996 Measuring self-concept across the life-span: Issues and
instrumentation. Washington, D.C.: American Psychological Association.
Cohen, N.J., Barwick, M.A., Horodezky, N.B., Vallance, D.D. & Im, N: 1998.
Language, achievement and cognitive processing in psychiatrically disturbed
children with previously identified and unsuspected language impairments.
Journal of Child Psychology and Psychiatry, 39, 865-877.
Conti-Ramsden, G. and Adams, C: 1995 Transitions from the clinic to the school: The
changing picture of specific language impaired children from pre-school to
school age. Journal of Speech and Language Studies.5, 1-11.
Coopersmith, S: 1981 The self-esteem inventories (SEI manual) Palo Alto California:
Consulting Psychologist Press.
Coopersmith, S: 1967 The antecedents of self-esteem. Palo Alto, California:
Consulting Psychologists Press.
Dockrell, J. & Lindsay, G: 1998. The ways in which speech and language difficulties
impact on children’s access to the curriculum. Child Language Teaching and
Therapy. 14, 117-133.
Dockrell, J. and Lindsay, G: 2001 Children with specific speech and language
Dockrell, J., George, R., Lindsay, G., and Roux, J: 1997 Problems in the identification
and assessment of children with specific speech and language difficulties,
Educational Psychology in Practice.12, 29-38.
Goodman, R: 1994. A modified version of the Rutter parent questionnaire including
items on children’s strengths. Journal of Child Psychology and Psychiatry. 35, 1483-1494.
Goodman, R: 1997 The strengths and difficulties questionnaire: a research note.
Journal of Child Psychology and Psychiatry. 38, 581-586.
Gresham, F.M., MacMillan, D.L: 1997 Social competence and affective
characteristics of students with mild disabilities. Review of Educational
Research. 67 (4), 377-415.
Harter, S: 1999 The construction of self: A developmental perspective. London: The
Guilford Press.
Harter, S: 1985 Manual for the self-perception profile for children. Denver, Co.:
University of Denver
Harter, S. & Pike, R: 1984. The pictorial perceived competence scale for young
children. Child Development. 55, 1969-1982.
Harter, S: 1989. Causes, correlates and the functional role of global self-worth: a
life-span perspective, In J. Kolligian and R. Sternberg (eds) Perceptions of
competence and incompetence across the lifespan. (pp 67-97). New Haven,
CT : Yale University Press.
Levy, F., Hay, D., McClaughlin, M., Wood, C., & Walman, I: 1996. Twin-sibling
differences in parental reports of ADHD, speech, reading, and behaviour
problems. Journal of Child Psychology and Psychiatry. 37(5), 569-578.
Lindsay, G. and Dockrell, J: 2000 The behaviour and self-esteem of children with
specific speech and language difficulties, British Journal of Educational
Psychology. 70, 583-601.
Marsh, H., Craven, R. & Debus, R: 1991. Self-Concepts of young children 5 to 8
years of age: measurement and multidimensional structure. Journal of
Educational Psychology. 83, 377-392.
McAndrew, E: 1999: The relationship between self-esteem and language disordered
McGuire, S: 1994 Measuring self-concept in children, Association of Child
Psychology and Psychiatry Review. 16 (2), 83-87.
Muijs, R.D: 1997 Symposium: Self-perception and Performance. Predictors of
academic achievement and academic self-concept: a longitudinal perspective.
British Journal of Educational Psychology. 67, 263-277.
Piers, E.V: 1984 Piers-Harris children’s self concept scale: Revised manual. Los
Angeles, CA: Western Psychology Services.
Stothard, S., Snowling, M., Bishop, D.V.M. , Chipchase, B. and Kaplan, C: 1998.
Language Impaired Preschoolers: A follow-up into adolescence. Journal of
Speech, Language and Hearing Research. 41, 407-418.
Wylie, R.C: 1979 The Self-concept Volume 2: Theory and research on selected topics.
Lincoln: University of Nebrasko Press.
Wylie, R.C: 1989 Measures of Self-concept. Lincoln: University of Nebraska Press.
Yude, C., Goodman, R. & McConachie, H: 1998. Peer problems of children with
hemiplegia in mainstream primary schools. Journal of Child Psychology and
Table 1
Means (standard deviations) of children with SSLD at Year 6 and 7 on the Self Perception Profile for Children compared with the standardisation
Boys Girls
Year 6 SSLD Standardisation SSLD Standardisation
Scholastic achievement 2.57 (.78) 2.94 (.62) 2.72 (.78) 2.94 (.64)
Social acceptance 2.87 (.78) 3.06 (.63) 2.91 (.76) 2.98 (.69)
Athletic competence 2.79 (.69) 3.15 (.61) 2.82 (1.04) 2.80 (.69)
Physical appearance 2.98 (.59) 2.98 (.68) 3.00 (.63) 2.68 (.75)
Behavioural conduct 2.86 (.74) 2.92 (.60) 3.50 (.57) 3.06 (.56)
Global self worth 3.06 (.71) 3.20 (.61) 3.38 (.55) 3.10 (.65)
N = 48 16
Year 7 SSLD Standardisation SSLD Standardisation
Scholastic achievement 2.57 (.66) 2.78 (.55) 2.57 (.94) 2.80 (.61)
Social acceptance 2.79 (.65) 3.00 (.61) 2.81 (.61) 2.96 (.57)
Athletic competence 2.96 (.61) 3.11 (.62) 2.46 (.88) 2.54 (.78)
Physical appearance 3.06 (.54) 2.93 (.62) 2.67 (.92) 2.50 (.68)
Behavioural conduct 2.97 (.64) 2.83 (.51) 3.29 (.59) 2.96 (.62)
Global self worth 3.10 (.48) 3.20 (.52) 3.18 (.73) 2.97 (.62)
Table 2 The Inter-relationship of the Subscales of the Self Perception Profile for Children at Years 6 and 7
Year 6 Scholastic Achievement
Social Acceptance
Athletic Competence
Physical Appearance
Behavioural conduct Social acceptance ,27x
Athletic competence .47xxx .50xxx
Physical appearance .24 .33xx .38xx
Behavioural conduct .31x .20 .17 .29 x
Global self worth .42xx .46xx .24 .49xxx .45xxx
N = 60-63
Year 7
Social acceptance .12
Athletic competence .49xxx .34xx
Physical appearance .29x .34xx .45xxx
Behavioural conduct .27x .16 .24 .18
Global self worth .35xx .34x x .35x .47xxx .13
N = 60-64
x
Table 3 Comparison of teachers’ v children’s rating on the Self Perception Profile for children, Years 6 and 7
Teacher Child
Year 6 Mean SD Mean SD N z P
Scholastic achievement 1.97 .78 2.60 .77 58 -4.180 < .001
Social acceptance 2.52 .87 2.85 .78 56 -2.236 .025
Athletic competence 2.56 .79 2.76 .76 57 -3.788 < .001
Physical appearance 3.03 .78 2.97 .60 52 -0.573 .567
Behavioural conduct 3.03 .82 3.05 .74 57 0 1.0
Year 7
Scholastic achievement 2.55 .79 2.61 .75 53 -.513 .608
Social acceptance 2.71 .81 2.80 .68 49 -.798 .425
Athletic competence 2.67 .76 2.90 .74 45 -1.491 .136
Physical appearance 3.17 .68 2.88 .81 35 1.560 .119
Table 4 Comparison of Self Perception Profile for Children at Years 6 and 7
SPPC Subscale children teachers
Scholastic achievement .58 x x x .49***
Social acceptance .49 x x x .52***
Athletic competence .54 x x x .43**
Physical appearance .36x x
.27
Behavioural conduct .43 x x x .50***
Global self worth .51 x x x N/a
n = 58-69
Table 5 Children’s and Teachers’ ratings of competence and acceptance at Year 3, compared with Years 6 and 7
Children Year 6 Year 7
Cognitive competence v scholastic achievement .21 .29 x
Peer acceptance v social acceptance .14 .07
Physical competence v athletic competence .05 .05
n = 60-62 60-62
Teachers
Cognitive competence v scholastic achievement .76xxx ..44 x x x
Peer acceptance v social acceptance .37xx .53 x x x
Physical competence v athletic competence .47xxx .48 x x x
n = 60-63 43-48
X