Article
Mapping Frictions Preventing from Bicycle
Commuting
Diego Pajarito1,†,‡* and Michael Gould1,‡
1 Universitat Jaume I; {pajarito, gould}@uji.es
* Correspondence: pajarito@uji.es; Tel.: +34-603-610-372 † Avda. Sos Baynat S/N, 12071, Castelló de la Plana, Spain. ‡ These authors contributed equally to this work.
Abstract:Urban cycling is a sustainable transport mode that cities currently try to expand. However, cities still do not take advantage of geospatial technologies to understand cycling mobility based on the behavioural patterns and difficulties faced by cyclists. This study analyses a geospatial dataset crowdsourced by urban cyclists using an experimental geo-game. About 20 participants per city recorded bicycle trips during one week and, by aggregating them, we found not only the cyclists’ preferred streets but also the frictions faced during cycling. We successfully identified 284 places potentially having frictions: 71 in Münster, Germany; 70 in Castelló, Spain; and 143 in Valletta, Malta. At such places, there were a representative number of trip sections with speed lower than 5 km/h compared to the sections with cycling speed. We described the potential frictions preventing from bicycle commuting based on the distance to bicycle paths, surrounding infrastructure, and location in the urban area.
Keywords:urban cycling; geo-game; spatial analysis; frictions; LBS; GPS
1. Introduction
Bicycling is an excellent complement for urban transport systems and many cities worldwide try to encourage commuter cycling [1,2]. However, most pro-cycling policies seem to follow a traditional top-down approach, high-level campaigns not considering individual cyclists. Given the massive citizen adoption of mobile devices, modern geospatial technologies can play a crucial role in understanding mobility patterns. These technologies are capable of identifying not only behavioural patterns but also the obstacles forcing cyclists to deviate from their desired routes, which has been largely unexplored in the literature.
Equally as important as the geospatial technology capacities, researchers lack common definitions of the typical obstacles urban cyclists face and few studies have dealt with the impact of so-called instead of we term frictions. This study aims to programmatically identify and classify the frictions inhibiting cycling commuting, validate methods for supporting data-driven policy-making, and comparing cycling patterns among three European cities.
Mobility conditions, traffic, and pollution in many cities are forcing people to leave cars at home and cities to provide and promote alternative modes of transport. In parallel, the creation of location-based services has favoured businesses and researchers trying to understand and optimise urban mobility. Cycling’s integration with mobile devices is well established, in developed countries, but mainly for sporting purposes rather than for commuters. Such a scenario motivated us to explore the analysis of urban cycling patterns from crowdsourced location information and to develop tools for fostering bottom-up, data-driven policies for urban cycling.
This study analysed crowdsourced bicycle trips from three European cities with different cycling environments, from an almost non-existent one in Valletta, to an evolving plan in Castelló, to an internationally recognised pro-cycling environment in Münster. We analysed the proportion of trip
segments at walking speed (less than 5 km/h) with respect to segments at cycling speed (typically between 10 and 20 km/h?), and we identified 284 locations with potential cycling frictions: 71 in Münster; 70 in Castelló; and 143 in Valletta. We classified and described how such impediments could prevent citizens from bicycle commuting considering trip origin and destination, distance to bicycle paths, location within the urban area, city infrastructure and the surrounding landmarks.
This article continues with a compilation of the related work considered for this study, the methodology for the identification of frictions, and the description of the crowdsourced datasets. Next, we present results for frictions inhibiting bicycle commuting, cycling patterns, and the use of bicycle paths. Afterwards, we discuss four main topics: friction and trip concepts, grid-based methodology, sample size, and method replication, prior to conclude the paper with the study limitations, conclusions and recommendations.
2. Related Work
The analysis of cycling conditions usually belongs to transport engineering studies [1]. Transport analysis usually pursues the optimisation of urban resources such as space, fuel, air quality, noise, among others [3]. Indeed, such studies are the primary data sources available at the three cities of our study which feed national and regional statistics [4,5]. Previous work analysing"100 years of urban cycling–policy, use, and practice in 14 European cities in 9 countries"[1] helped to summarize the role of bicycles in Europe, its dominance before the 1950’s car revolution, and its attempts to return during the last two decades. Such a trend is more evident in cities such as Copenhagen [6] or Amsterdam [7]. Sustainable options such as cycling seem very promising in urban areas instead of traditional transport modes due to considerably fewer requirements for adoption and maintenance [8]. To better comprehend mobility based on physical activity or active mobility researchers created indexes to measure the restrictions faced by pedestrians, lately called"walkability"indexes [9]. More recently cycling researchers expanded this idea to evaluate cycling conditions considering infrastructure, interaction with motorised vehicles, and cultural adoption across cities [10,11]. Thus the attention to the strong relationship between walking and cycling, two popular activities usually recommended for increasing physical activity [12,13] and widely studied from the medical perspective [13]. Our research used measures for walking and cycling. Walking speed"ranged from 4.58 Km/h (127.2 cm/s) for women in their seventies to 5.26 Km/h (146.2 cm/s) for men in their forties"[14], and cycling speed ranges between 12 and 20 km/hour [15] due to the different conditions faced in urban environments. There are very few published studies dealing with the use of mobile applications for promotion of urban cycling [16]. However, there has been work on more general applications of gamification and lately geo-games as effective tools for encouraging behavioural change and promote physical activity [17–20]. Current cycling applications use gamification to not only promote physical activity but also crowdsource cycling information. Such an approach collects more data than web-based tools likeOpenCycleMap, the cycling branch ofOpenStreetMap[21,22]. This trend emphasizes social interaction and cycling performance with examples such asStravaorEndomondo[23,24], rather than data collection popular in older applications such asWikiloc[25]. Our research attempts to fill the gap between the competition and performance approach of cycling applications and the need for obtaining better data about commuting cyclists for policy-making, usually dominated by top-down strategies [1,7,26,27].
Unfortunately, cycling applications still offer limited information for policy makers and transport analysts [35–37], meaning a considerable potential for data-driven policy-making for urban cycling. The complexity of cycling commuters and the positive impact of bicycles in urban mobility challenge city managers and policy-makers to better understand and describe cycling patterns [38]. Also, the benefits for encouraging physical activity brought us back to the convenience to motivate people to cycle through mobile phones [39–41].
3. Methodology
For this study, we considered the conjunction of location-based services, bicycle commuting and spatial analysis. Our approach took advantage of concepts and tools from the three areas to provide a multi-disciplinary alternative relevant to all of them.
3.1. Data
The study analyses a geospatial dataset crowdsourced by about 60 urban cyclists during the summer of 2017 in three European cities: Castelló in Spain, Münster in Germany, and Valletta in Malta. They usedCyclist Geo-C, an experimental mobile gamified application, or geo-game, to record their bicycle trips during a one week period. The application recorded participants’ locations during each bicycle trip and up to three tags to describe their experience upon arrival. The geo-game used the capabilities ofAndroidand theGoogle Fit APIto record participants’ location, speed and cycled distance [42].
We considered two types of data for the study, the original records of theCyclist Geo-Cgeo-game prototype and the aggregated dataset describing the trips. AppendixAdescribes the two of them and its data structure.
The first dataset contained a list of time-stamped coordinates of cyclists location during the experiment, a list of time-stamped measurements processed by theGoogle Fit API[43], the list of trip start and stop times reported by participants using the geo-game, and the list of tags describing each trip. These four files were the input of the geospatial analysis which generated the new geospatial dataset.
The second dataset is the result of aggregating the time-stamped coordinates, measurements and tags. It has the coordinates integrated with the measures of speed and distance coming from the Google Fit API. The trip segments defined by lines connecting a pair of following user locations. The trips were the joint set of ordered segments with differences in time lower than 5 minutes and 1 Km. Finally, the set of trips origin and destination.
In addition to the previous datasets, our analysis relied on a comparable framework which considered the existing or planned bicycle paths and urban boundaries. We acquired the bicycle paths in Münster from theOpenstreetmap[21] database, in Castelló from the city transport authority [44], and in Valletta from the Malta bicycle network plan [45]. For the urban boundaries, we used data fromOECDfunctional urban areas - FUA [46] and urban morphological zones - UMZ [47]. These datasets served for representing comparable areas of study composed by the three urban areas and the existing or planned bicycle lanes.
3.2. Methods
The spatial analysis of the dataset consisted of two complementary parts. In the first part, we used thePython Geojsonlibrary to createlinestringobjects [48] that linked two consecutive coordinates, their timestamps, speed and distance as automatically recorded by the geo-game. Then trips were represented aslinestringobjects which started from an origin point, joined the sequence of segments until finding the next segment with either a timestamp five minutes after or a distance longer than one kilometre. Both origin and destination points were also stored asGeojsonobjects.
[49]. The grid comes out after creating individual arrays with the local coordinate system; they were 30 metres side hexagons merged into a single layer with the WGS84 reference system. The merged grid supports spatial analysis using GPS tracks and other GIS compatible layers such as bicycle paths and urban areas. We calculated, at each grid spot, summary statistics for the intersecting segments and trips in order to identify cycling, walking and non-cycling patterns, trips origin and destination, and the grid location within the urban area. We classified the segments as walking segments with walking speed of less than 5 km/h [14]; otherwise, as cycling segments with a cycling speed between 5 and 50 km/h [15]; and non-cycling segments, when they have a speed greater than 50km/h.
To define the frictions that inhibit bicycle commuting, we considered a scenario in which a cyclist faced an obstacle or a circumstance that forced to either slow down or stop cycling and walk the bike. In this case the cyclist cannot maintain a constant cycling speed during the trip [50]. Based on that, if a participant cycles uniformly, we can expect the same number of trips and segments crossing at each spot. Consequently, if a participant faces an obstacle or circumstance, we can expect more segments than trips. It could happen due to the GPS effect of recording multiple locations when the sensor moves slowly or stays in the same location [51].
We defined threefrictions levels. As first level frictions, we selected the grid cells intersecting at least one walking segment. As second level frictions, we chose the first level frictions located farther than one hundred metres from a trip origin or destination (we considered participants at these areas had more chances to walk their bikes or slow down the speed). Finally, we calculated thefriction intensityas a ratio of the number of walking segments per cycling segments. As third level frictions, we identified grid cells having ratios between one half and two (50% - 200%). With this criterion, we aimed to where a significant proportion of participants did not record cycling speeds.
Using the spatial aggregation functions (such as distance, intersection, union, etc.) available in PostGIS 2.2 and QGIS 3.0, we proceed to merge adjacent third level friction cells and calculate descriptive statistics. We considered these places as the potential locations of frictions and described them based on the surrounding environment, distance to bicycle paths, urban infrastructure, street network, and landmarks. We then classified these places according to the size of grid areas and the proportion of walking and cycling segments.
Finally, we described the cycling patterns taking into account the distance travelled by the participants, the speed and time of the trip (day of the week and hour of the day). For this description, we classified as recorded on a bike path those segments located within 30 metres of it. Also, we geographically analysed the bike paths used, and not used, by participants as well as the correspondent cycling speed. Consequently, we compared the differences in such values between cities.
4. Results
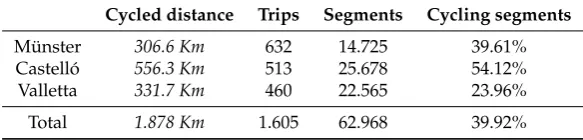
The first part of the analysis produced a dataset containing 1.605 trips made out of 62.968 segments and described in Table1. While Münster had a higher number of trips, Castelló and Valletta had almost two times more segments. Cycled distance in Castelló was more than five hundred, whereas in Münster and Valletta it was about three hundred kilometres. Additionally, the rate of cycling segments was higher in Castelló which more than doubled Valletta’s.
Table 1.Distribution of bicycle trips and segments recorded during the experiment.
Cycled distance Trips Segments Cycling segments
Münster 306.6 Km 632 14.725 39.61%
Castelló 556.3 Km 513 25.678 54.12%
Valletta 331.7 Km 460 22.565 23.96%
4.1. Frictions preventing from bicycle commuting
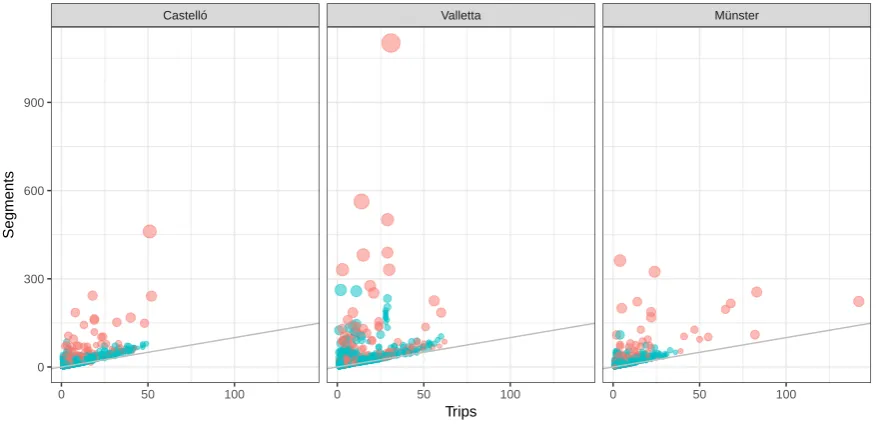
We covered each city study area with a 30 metre hexagonal grid as a way to aggregate or bin the number of trips and segments as well as to identify the cycling patterns. We estimated the friction intensity at each grid cell or the ratio of walking segments per cycling segments described in the Methodology section3. We plotted out the number of walking and cycling segments, if they were equal, we should expect thex = y line pattern. However, Figure1 shows the grid cells diverging from that expected line, especially those cells which do not have neither origins nor destinations. Our first level frictions corresponded to the set of cells deviating from the line.
Castelló Valletta Münster
0 50 100 0 50 100 0 50 100
0 300 600 900
Trips
Segments
Cycling segments 0 250 500 750
Has Origin/Destination No Yes
Figure 1.Relationship between trips and segments in the three cities.
In general, grid cells were intersected by fewer than fifty trips and one hundred segments but, when grid cells had trips origin/destination, the number of segments was up to ten times higher. This means that participants recorded more segments than trips while they were starting or finishing a trip. Since they either remained in the same location or had a slow speed, the GPS recorded multiple locations that afterwards became segments. Therefore, the analysis did not consider those grid cells as frictions. The city of Valletta showed more grid cells with a high number of segments than the other two cities, a potential signal of a higher number of frictions.
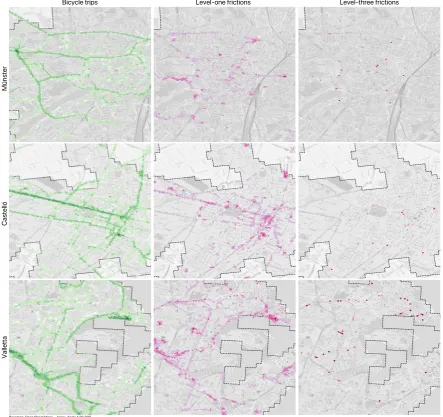
Our results went beyond the traditional perspective of mapping cyclists preferred/non-preferred streets, mainly due to our focus on places inhibiting cyclists movement. Figure2shows, on the left, the conventional cycling representation and the cyclists’ preferred streets; on the centre the first level frictions or grid cells with walking segments; and on the right, the third level frictions where cycling intensity was between 50% and 200%.
The differences seen in Figure2 are the result of analysing not only cycling but also walking. The frictions (on the centre and right part of the figure) complements the view of cycling distribution; they indicate places where participants not only cycled but also decreased their speed or stopped during the trip. Level three frictions did not consider trip origins or destinations due to the higher probability of participants waking before starting or after finishing a trip.
M
ün
st
er
C
as
te
lló
Basemap: Open Street Maps Aprox. Scale 1 20.000
V
al
le
tt
a
Bicycle trips Level-one frictions Level-three frictions
Figure 2.Bicycle trips, frictions of level one and level three.
a selection of places having third-level frictions usually associated with street intersections forcing cyclists to decrease their speed. Additionally, in Münster, we found frictions when participants moved from dedicated bicycle paths to local streets, intersecting highways, or at the surroundings of the city lake. In Castelló we found such places at cumbersome turns in bicycle paths, roundabouts, or at the entrance to a city park. Finally, in Valletta, we found frictions usually associated with steep slopes, grade separations such as the underpass leading to the university.
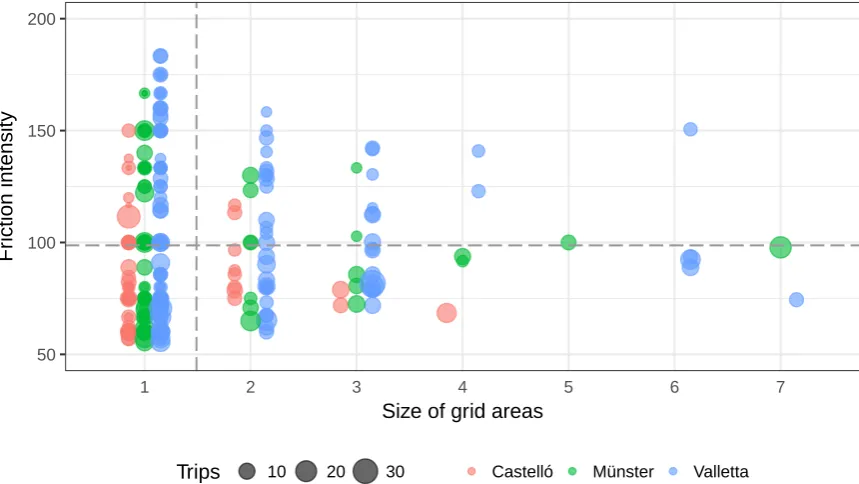
After the aggregation of adjacent grid cells, we classified friction intensity considering the size of affected grid areas and the average friction intensity. We found almost half of these areas in Valletta with 143 places, Münster with 71, and Castelló, with 70. Third level frictions in Valletta usually came from the steep slopes faced by participants, which makes the cycling environment different to the ones in Münster or Castelló. Figure4shows the four quadrants of the size of grid areas and intensity. The analysis focused on the top two, due to the higher number of walking segments.
Cycling constraints Intersection City specific Intersection Landmarks
M
ün
st
er
C
as
te
lló
Basemap by Open Street Map Approximated scale 1 2.000
V
al
le
tt
a
Figure 3.Bicycle trips, level one and level three frictions.
50 100 150 200
1 2 3 4 5 6 7
Size of grid areas
Fr
iction intensity
Trips 10 20 30 Castelló Münster Valletta
- HFI), they were mostly at intersections controlled by traffic lights; in Castelló (29 GA with HFI), they were mostly at intersections, roundabouts and the pedestrianised downtown; and in Valletta (76 GA with HFI), they were mostly across streets with steep slopes, street intersections and grade separations. Our results combined the programmatically functions and a visual examination for describing the cycling environment.
4.2. The cycling patterns identified
We identified cycling patterns from the trips distribution in time on the one hand, and the use of bicycle paths on the other. The patterns start from participants’ cycled distance across the days of the week and during the day following a commuting pattern. Besides the different levels of use of the bicycle paths at the three cities.
4.2.1. Trip patterns
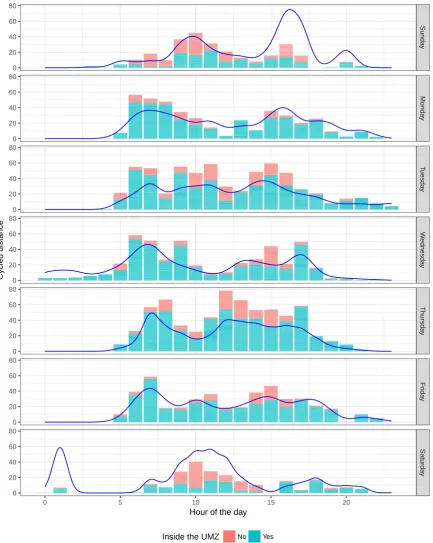
For the trips distribution, we considered the distance cycled per day of the week and hour of the day. Figure5 shows the cycled distance during the experiment of the three cities differentiated by its location in or out of the UMZ. Cycling was more intense on weekdays than on weekends and the trips concentrated more during working hours. These two features belong to commuter patterns and, in this case, the trips also followed a bimodal distribution [52,53].
After identifying the segments using a bicycle path, we found participants from Münster recording 65.54% of the cycled distance on a path, while participants in Castelló did it for the 30.58%. Although Valletta has no bicycle paths, we used the streets selected at the Malta Transport Plan (2018) for building a bicycle path and found participants recording 13.55% of the cycling distance on those streets. In general, participants in Münster tended to cycle through the streets with bicycle paths, due to the city’s high-quality cycling network, while participants in Castelló cycled often through existing bicycle paths despite the reduced coverage of the network.
Using segments speed, we examined the hourly distribution of trips per city. Figure6shows trips usually starting after 6 in the morning, with some trips in Münster recorded early in the morning and a participant in Valletta who continuously recorded non-cycling segments all night long. Participants from Castelló recorded more trips between 16 and 18 hours while in Münster and Valletta they recorded more trips during the morning or afternoon, probably due to their local commuting times. In Münster, we found a periodic concentration of trips during the day which could mean a more structured cycling scheduling.
Additional to the hourly distribution of trips, we found that Valletta had the lowest cycling speed between the three cities, 14.6 km/h on average, while Castelló and Münster had a higher cycling speed, 15.0 Km/h and 14.8 Km/h. Looking into the location of trips, participants from Münster and Valletta recorded most of the segments within the urban area (89.17% and 93.94%) while participants in Castelló recorded more than one half of the cycling distance within the urban area (65.09% during weekdays, 41.36% during weekends), decreasing during the weekends due to the sport practices in the countryside. Another explanation for such a result came from the differences in Castelló’s UMZ which was smaller and had more disperse areas than the UMZ of the two other cities. Although the UMZ came from the same source, the differences in the shape and area of the UMZ not only explain the shorter cycled distance within the UMZ but also show how the participants commuted and connected with the surrounding cities.
4.2.2. Use of bicycle paths
Sunda
y
Monda
y
T
uesda
y
W
ednesda
y
Thursda
y
Fr
ida
y
Saturda
y
0 5 10 15 20
0 20 40 60 80
0 20 40 60 80
0 20 40 60 80
0 20 40 60 80
0 20 40 60 80
0 20 40 60 80
0 20 40 60 80
Hour of the day
Cycled distance
Inside the UMZ No Yes
Figure 5.Hourly distribution of cycled distance per day of the week.
Castelló
V
alletta
Münster
0 6 12 18 24
10 20 30 40 50
10 20 30 40 50
10 20 30 40 50
Hour of day
Speed in Km/h
Figure 6.Hourly distribution of cycling speed.
Castelló
Münster Valletta
0 100 200 300 400
Distance (m)
In bicycle Path No Yes
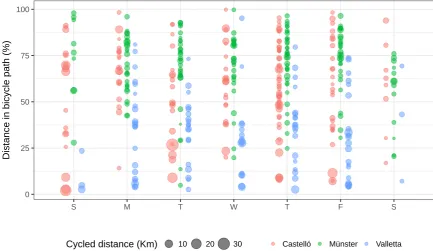
Trying to find the differences within cities, we used the cycling distance recorded on a bicycle path per trip per day of the week. Figure8shows Castelló with high variability across the days and more trips using bicycle paths on Sundays. The figure shows Münster with most of the trips having over 50% of the cycled distance on a bicycle path and fewer trips on Saturdays and Sundays. Finally, most of the trips in Valletta with very little distance on a planned bicycle path and very few trips on Saturdays or Sundays.
0 25 50 75 100
S M T W T F S
Distance in bicycle path (%)
Cycled distance (Km) 10 20 30 Castelló Münster Valletta
Figure 8.Cycled distance, proportion per trip.
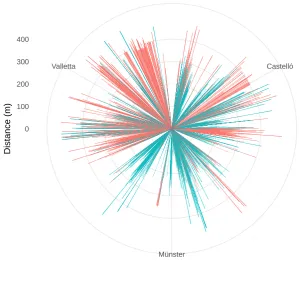
We aggregated the trips and segments recorded on a bicycle path and mapped them to visualise the paths participants used. Figure 9 shows the bicycle paths in blue, in green the paths where participants recorded at least one trip, and in red the segments recorded out of bicycle path. We found the segments out of the paths mostly at the city centres. In Münster, few segments crossed by the city centre while in Castelló the city centre concentrated most of the segments out of a bicycle path. Although the majority of trips in Valletta were out of the planned bicycle network, we saw trips at some of the streets of the plan and also across the surroundings.
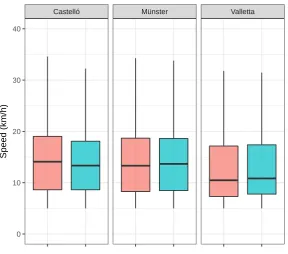
In order to examine the difference in speed, we compared the average cycling speed of segments recorded in and out bicycle paths. Figure10shows Münster had a slightly higher speed in bicycle paths while Castelló the higher speed was out of the bicycle path. Such a difference can come from the fact of participants cycling out of the urban areas of Castelló. For Valletta, this comparison only pretends to serve as a baseline to contrast future urban interventions on bicycle paths. Although we found a non-statistically significant difference, comparing cycling speeds in the bicycle paths deserves additional analysis and demands field-work validation.
5. Discussion
Basemap: Open Street Maps Aprox. Scale 1 50.000
Valletta
Münster Castello
Figure 9.Use of bicycle paths during the experiment.
Castelló Münster Valletta
0 10 20 30 40
Speed (km/h)
In bicycle path No Yes
Figure 10.Use of bicycle paths during the experiment.
outcomes, the existing alternatives to understand cycling commuting and present planned future work.
location data crowdsourced through mobile phones. Second, we identified the frictions constraining those trips by analysing the deviation from an ideal cycling scenario. Although we are aware of the possibilities of improvement of our method, we considered an achievement the possibility of programmatically identify the 1.605 bicycle trips and 284 frictions of this study.
The definition of"frictions"was more relevant than the definition of"bicycle trips". The analysis of urban cycling needed to go beyond the geographic perspective in order to understand frictions not only as a geometry happening at a particular time. We, therefore, used an ideal cycling scenario to compare with the crowdsourced trips and estimated the existing deviation in speed to drive our analysis. In practice, we defined a procedure with three levels that not only allowed us to identify frictions but also brought up criteria for their description. The two additional levels of frictions increased consistency by considering more than the number of walking segments, origins, destinations, and adding thefriction intensity ratio. The identified frictions were located at places with segments recorded at low speeds induced by an external factors.
Our methodology joined three main components: the crowdsourced bicycle trips, a hexagonal grid, and the spatial aggregation of trips and segments to identify frictions. The grid-based approach normalises the analysis and provides comparable results between cities. The advantages of using a grid went beyond visualisation; it enabled mixed geographical and numerical comparisons within cities. Consequently, we used it to calculate the summary statistics for segments at each grid cell and compare the number of walking and cycling segments. The grid expanded the traditional view of overlapping lines or heat maps used for cycling visualisation. Such structure and the summary statistics supported the visualisation of streets preferred by cyclists and revealed hidden patterns coming from non-cycling segments. Figure2is the example of a single layer showing three different views. Additionally, the grid supported data visualisation out of the geographic domain, some examples of non-geographical visualisations are in Figure4 and Figure8. Such a combination of geographic and numeric visualisation is not common in cycling analysis, the majority of cycling studies, as well as some transport studies, usually stick to one of the two alternatives [54].
Using bicycles for commuting is a transport mode with exciting mobility patterns. Our results are intentionally comparable with mobility studies from other transport modes, especially concerning the hourly distribution of trips across the days of the week shown in Figure5. Despite the differences in methodology between our study and conventional transport studies, our insights into participants’ commuter behaviour are comparable and offer higher detail. We consider our approach can, therefore, complement conventional transport studies.
Due to small sample size of our study, we did not extrapolate our conclusions to a city level. However, considering our focus on identifying frictions inhibiting cyclists commuting, we focused our analysis on the urban areas, the description of the cycling environment, and potential benefit of our outcomes for policy-makers. We provided a simple estimator of friction intensity and considered it an objective view of the use of bicycles and the restrictions faced in the cities. Although our methodology identified the frictions faced by participants during cycling and provided a replicable method for other cities, it does not cover the validation fieldwork. In addition to this, we foresee methodological improvements for geometry and temporal processing that do not reduce the consistency of our results.
The common framework focused on urban areas allowed us to compare the cycling patterns between cities even if they differed in cycling culture or infrastructure. We tested the framework analysing three different contexts: the almost non-existent cycling environment in Valletta, an evolving cycling environment in Castelló, and the internationally recognised pro-cycling environment in Münster. Moreover, our results translated into numbers stand out the differences between cities when it comes to cycled distance in bicycle paths: zero in Valletta (95.7 Km in the streets planned to have them), 265.9 Km in Castelló, 235.5 Km in Münster. Besides, we evaluated the use of bicycle paths. In Münster, participants left uncovered about 65% of the bicycle paths; in Castelló, it was about 30% of the network without trips; In Malta, participants did not record a trip on 50% of the streets planned to build bicycle paths. Despite the existing bias coming from the small sample size and trips’ repetition associated with commuting patterns, our study successfully supported the evaluation of the use of bicycle paths in the three cities.
In order for other researchers to reproduce our study [55], the set of functions used in the study are available in an open repository (see supplementary materials). Such compilation used popular programming languages for implementing data analysis and simplified the task of reproduction in future studies. We deliberately used open source GIS tools to avoid complex requirements for future analysis and did not restrict to the use of any GIS software. The compilation of tools and datasets are a contribution to future research on urban cycling and is part of theOpen City Toolkit[56,57]. Our study served as a testbed to validate the convenience of open and reproducible research for urban cycling.
Apart from the planned research outcomes, the study opened up the alternatives for future cycling-related research. We found the need for improvement the process of data cleaning when it comes to datasets collected with mobile phones and GPS which could extended the scope of future analysis. Data cleaning should focus on a better definition of bicycle trips, the identification of origins, destinations, and stops. There are additional descriptors that can be obtained from our datasets such as bearing angle, effective cycled distance or the connection with different transport modes. Although our research scope did not consider the trajectory analysis, our dataset can feed such methods which are gaining in popularity but lack valid data for validation.
Due to the promising idea of having open datasets for urban cycling, our study produced a set of documented tools that can extend or feed emerging and popular fields such as machine-learning, parallel processing, or artificial intelligence. Moreover, considering the limitations of the majority of cities to successfully implement such tools, we aim to offer our experience and data to simplify the technical evaluation of data analysis for bicycle commuting.
6. Conclusions
The study successfully identified 284 places with potential frictions inhibiting bicycle commuting: 71 in Münster, Germany; 70 in Castelló, Spain; and 143 in Valletta, Malta. Participants at those places recorded bicycle trips but some other segments were recorded at low speed indicating a deviation from an ideal cycling scenario. We technically selected the places having a friction intensity between 50% and 200% which meant the number of walking segments (speed less than 5 km/h) represented between one half and two times the number of cycling segments (speed between 5 and 50 km/h). We therefore described the potential frictions considering the distance to bicycle paths, surrounding infrastructure, and location in the urban area.
bigger sample size, our method would have produced results to better represent cycling dynamics at such scale.
Despite the generic definition of"frictions"used for this study, it supported our methodology and the reproducibility of the experiment. However, future works should include improvements such as the fieldwork validation and probably co-validation from participants. The experiment setup is suitable for collecting bicycle trips with mobile phones, identifying and describing the frictions inhibiting bicycle commuting and general cycling patterns. The use of a grid-based analysis and a common framework for the urban areas guaranteed the comparability of the results among cities. Also, it expands the commonly adopted approach of analysing trips units by spatially aggregating trip segments.
Supplementary Materials: More information about the Open City Toolkit is available online athttp://geo-c. eu/opencitytoolkit, the source code of the Cyclist Geo-C mobile App is available online at:https://github.com/ GeoTecINIT/Mag-ike, the dataset and the functions used for the study are available online at: https://github. com/GeoTecINIT/CyclingPathAnalysis
Acknowledgments: Authors of this document gratefully acknowledge funding from the European Union through theGEO-C project(H2020-MSCA-ITN-2014, Grant Agreement Number 642332,http://www.geo-c.eu/); from theCitizen Science COST Action CA15212www.cs-eu.net; and from theAGILEbursaries for ESRshttps: //agile-online.org. The experiment has been satisfactorily granted by the Committee of Ethics atUniversitat
Jaume Iwith the reference number 04/2018 and the Committee of Ethics at the Institute for Geoinformatics,
University of Münster.
Conflicts of Interest:“The authors declare no conflict of interest.”. “The founding sponsors had no role in the design of the study; in the collection, analyses, or interpretation of data; in the writing of the manuscript, and in the decision to publish the results”.
Abbreviations
The following abbreviations are used in this manuscript:
LBS: Location-based services FUA: Functional urban areas GPS: Global Positioning System OCT: Open City Toolkit
OECD: Organisation for Economic Co-operation and Development UMZ: Urban morphological zones
WGS84: World Geodetic Reference System
Appendix A.
File Field Description
Cyclist_Location.csv
Device Code identifying the user/device recording the location Latitude Location latitude in decimal degrees
Longitude Location longitude in decimal degrees Altitude Location altitude in metres
Precision Location precision or accuracy of the location reported by the device
time_gps Recording time in format:’YYYY-MM-DDThh:mm:ss.sssZ’
Cyclist_Measurement.csv
Device Code identifying the user/device recording the measurement Time_device Recording time in format:’YYYY-MM-DDThh:mm:ss.sssZ’
Measurement Kind of measurement recorded: last recorded distance, distance from the trip start, last recorded speed. The kind of measurement defines the measurement units: metres (m) or metres per second (ms)
value Measurement value
Cyclist_Trip.csv
Device Code identifying the user/device recording the trip Trip_count Number identifying the trip
Start_point.0 Start point longitude Start_point.1 Start point latitude End_latitude End point latitude End_longitude End point longitude
Trip_start Time when the trip started in format:
’YYYY-MM-DDThh:mm:ss.sssZ’
Trip_stop Time when the trip ended in format:
’YYYY-MM-DDThh:mm:ss.sssZ’
Cyclist_Tag.csv
Device Code identifying the user/device recording the tag
Trip_count Number identifying the trip number associated with the tag Tag_count Number identifying the tag
Text Raw tag text
Bibliography
1. Oldenziel, R.; Emanuel, M.; de la Bruheze, A.A.A.; Veraart, F. Cycling Cities: The European Experience; Foundation for the History of Technology and Rachel Carson Center for Environment and Society: Eindhoven, 2015; p. 256.
2. Handy, S.; van Wee, B.; Kroesen, M. Promoting Cycling for Transport: Research Needs and Challenges.
Transport Reviews2014,34, 4–24.
3. Rodrigue, J.P.; Comtois, C.; Slack, B.The Geography of Transport Systems; 2013.
4. Jacobsen, P. Safety in numbers: more walkers and bicyclists, safe walking and biking. Inj Prev2003,
9, 205–209.
5. Küster, F.; Blondel, B. Calculating the economic benefits of cycling in EU-27. European Cyclists’ Federation
2013, pp. 1–8.
6. Nielsen, T.A.S.; Skov-Petersen, H.; Agervig Carstensen, T. Urban planning practices for bikeable cities – the case of Copenhagen. Urban Research & Practice2013,6, 110–115.
7. Pucher, J.; Buehler, R. Making Cycling Irresistible: Lessons from The Netherlands, Denmark and Germany.Transport Reviews2008,28, 495–528.
8. Cohen-Blankshtain, G.; Rotem-Mindali, O. Key research themes on ICT and sustainable urban mobility.
International Journal of Sustainable Transportation2016,10, 9–17.
9. Leslie, E.; Coffee, N.; Frank, L.; Owen, N.; Bauman, A.; Hugo, G. Walkability of local communities: using geographic information systems to objectively assess relevant environmental attributes. Health & place
2007,13, 111–22.
report, Initiative for Bicycle and Pedestrian Innovation Center for Transportation Studies, Portland State University, Portland, OR, 2012.
11. Pooley, C.G.; Jones, T.; Horton, D.; Jopson, A.; Mullen, C.; Chisholm, A.; Constantine, S. Understanding walking and cycling: Summary of key findings and recommendations. Technical report, Lancaster Environment Centre, Lancaster University, 2011.
12. Bleser, G.; Steffen, D.; Reiss, A.; Weber, M.; Hendeby, G.; Fradet, L. Personalized Physical Activity Monitoring Using Wearable Sensors; 2015; Vol. 8040, pp. 99–124.
13. op den Akker, H.; Jones, V.M.; Hermens, H.J. Tailoring real-time physical activity coaching systems: a literature survey and model. User Modeling and User-Adapted Interaction2014,24, 351–392.
14. Gong, L.; Sato, H.; Yamamoto, T.; Miwa, T.; Morikawa, T. Identification of activity stop locations in GPS trajectories by density-based clustering method combined with support vector machines. Journal of
Modern Transportation2015,23, 202–213.
15. Bigazzi, A.Y. Determination of active travel speed for minimum air pollution inhalation. International
Journal of Sustainable Transportation2017,11, 221–229.
16. Pajarito, D.; Gould, M. Smart Mobility, the Role of Mobile Games. InLecture Notes in Computer Science; 2017; pp. 44–59.
17. Rissel, C. Health benefits of cycling. InCycling Futures; Bonham, J.; Johnson, M., Eds.; The University of Adelaide Press, 2015; chapter 3, pp. 43–62.
18. Schlieder, C.; Kiefer, P.; Matyas, S. Geogames: Designing Location-Based Games from Classic Board Games. IEEE Intelligent Systems2006,21, 40–46.
19. Coombes, E.; Jones, A. Gamification of active travel to school: A pilot evaluation of the Beat the Street physical activity intervention. Health & Place2016,39, 62–69.
20. Ahlqvist, O.; Schlieder, C. Introducing Geogames and Geoplay: Characterizing an Emerging Research Field; 2018; pp. 1–18.
21. contributors, O. OpenStreetMap, 2017.
22. Haklay, M.; Weber, P. OpenStreetMap: User-Generated Street Maps. IEEE Pervasive Computing2008,
7, 12–18.
23. Strava, I. Strava, 2018.
24. Under Armour, I. Endomondo, 2018. 25. Wikiloc Outdoor, S. Wikiloc, 2018.
26. Grant-Muller, S.; Gal-Tzur, A.; Minkov, E.; Kuflik, T.; Nocera, S.; Shoo, I. Transport Policy: Social Media and User-Generated Content in a Changing Information Paradigm. InSocial Media for Government
Services; Nepal, S.; Paris, C.; Georgakopoulos, D., Eds.; Springer International Publishing: Cham, 2015;
pp. 325–361.
27. Garrard, J. Evaluating cycling promotion interventions. InCycling Futures; Burton, R., Ed.; University of Adelaide Press: Adelaide, 2015; pp. 429–452.
28. Claudel, M.; Nagel, T.; Ratti, C. From Origins to Destinations : The Past , Present and Future of Visualizing Flow Maps. Built Environment2015,42, 200.
29. Meier, S. Visualizing Large Spatial Time Series Data on Mobile Devices: Combining the HeatTile System with a Progressive Loading Approach; 2015; pp. 161–173.
30. Adrienko, N.; Adrienko, G. Spatial generalization and aggregation of massive movement data. IEEE
Transactions on Visualization and Computer Graphics2011,17, 205–219.
31. Sainio, J.; Westerholm, J.; Oksanen, J. Generating Heat Maps of Popular Routes Online from Massive Mobile Sports Tracking Application Data in Milliseconds While Respecting Privacy. ISPRS International
Journal of Geo-Information2015,4, 1813–1826.
32. Strava, I. Global Heatmap, 2018.
33. Nelson, T.A.; Denouden, T.; Jestico, B.; Laberee, K.; Winters, M. BikeMaps.org: A Global Tool for Collision and Near Miss Mapping.Frontiers in Public Health2015,3, 53.
34. Snizek, B.; Sick Nielsen, T.A.; Skov-Petersen, H. Mapping bicyclists’ experiences in Copenhagen. Journal
of Transport Geography2013,30, 227–233.
36. Burke, J.; Estrin, D.; Hansen, M.; Parker, A.; Ramanathan, N.; Reddy, S.; Srivastava, M.B. Participatory Sensing.UCLA: Center for Embedded Network Sensing2006.
37. Zeile, P.; Resch, B.; Loidl, M.; Petutschnig, A.; Dörrzapf, L. Urban Emotions and Cycling Experience – enriching traffic planning for cyclists with human sensor data. GI_Forum2016,1, 204–216.
38. Pucher, J.; Dill, J.; Handy, S. Infrastructure, programs, and policies to increase bicycling: An international review. Preventive Medicine2010,50.
39. Halko, S.; Kientz, J.A. Personality and Persuasive Technology: An Exploratory Study on Health-Promoting Mobile Applications; Springer Berlin Heidelberg: Berlin, Heidelberg, 2010; Vol. 6137,
Lecture Notes in Computer Science, pp. 150–161.
40. Barratt, P. Healthy competition: A qualitative study investigating persuasive technologies and the gamification of cycling.Health and Place2017,46, 328–336.
41. Wojan, T.R.; Hamrick, K.S. Can Walking or Biking to Work Really Make a Difference? Compact Development, Observed Commuter Choice and Body Mass Index. PloS one2015,10, e0130903.
42. Pajarito, D.; Degbelo, A.; Gould, M. Collaboration or Competition: the Impact of Incentive Types on Urban Cycling.Submitted for publication.
43. Google Inc.. Google Fit, 2017.
44. Ayuntament de Castelló. PLAN DIRECTOR DE LA BICICLETA DE CASTELLÓN. Technical report, Ayuntament de Castelló, Castellón de la Plana, 2016.
45. Land Transport Authority. Land Transport Master Plan, 2013. 46. OECD. Functional urban areas by country, 2017.
47. European Environment Agency. Urban morphological zones, 2006.
48. Butler, H.; Daly, M.; Doyle, A.; Gillies, S.; Schaub, T.; Schmidt, C. The GeoJSON format specification.
Rapport technique2008,67.
49. Birch, C.P.; Oom, S.P.; Beecham, J.A. Rectangular and hexagonal grids used for observation, experiment and simulation in ecology.Ecological Modelling2007,206, 347–359.
50. Orellana, D.; Wachowicz, M. Exploring Patterns of Movement Suspension in Pedestrian Mobility.
Geographical Analysis2011,43, 241–260.
51. Orellana, D. Exploring Pedestrian Movement Patterns. PhD thesis, Wageningen University, 2012. 52. St-Louis, E.; Manaugh, K.; Van Lierop, D.; El-Geneidy, A. The happy commuter: A comparison of
commuter satisfaction across modes. Transportation Research Part F: Traffic Psychology and Behaviour2014,
26, 160–170.
53. Kingham, S.; Tranter, P. Cycling and sustainable transport. InCycling Futures; Bonham, J.; Johnson, M., Eds.; The University of Adelaide Press, 2015; chapter 7, pp. 131–152.
54. Tolley, R.; Turton, B.J.Transport Systems, Policy and Planning: A Geographical Approach; Routledge, 2014; p. 420.
55. Nüst, D.; Granell, C.; Hofer, B.; Konkol, M.; Ostermann, F.O.; Sileryte, R.; Cerutti, V. Reproducible research and GIScience: an evaluation using AGILE conference papers.PeerJ2018,6, e5072.
56. Degbelo, A.; Bhattacharya, D.; Granell, C.; Trilles, S. Toolkits for smarter cities: A brief assessment. Lecture Notes in Computer Science (including subseries Lecture Notes in Artificial Intelligence and Lecture Notes in Bioinformatics); García, C.R.; Caballero-Gil, P.; Burmester, M.; Quesada-Arencibia, A., Eds. Springer, Cham, 2016, Vol. 10070 LNCS, pp. 431–436.
57. Degbelo, A.; Granell, C.; Trilles, S.; Bhattacharya, D.; Casteleyn, S.; Kray, C. Opening up Smart Cities: Citizen-Centric Challenges and Opportunities from GIScience. ISPRS International Journal of