LIME, MANURE AND INORGANIC FERTILIZER EFFECTS ON SOIL CHEMICAL PROPERTIES, MAIZE YIELD AND PROFITABILITY IN
THARAKA-NITHI COUNTY, KENYA
KIMITI WINNIE WANJIRU N50/CTY/PT/33497/2014
A Thesis Submitted in Partial Fulfilment for the Degree of Master of Environmental Science in the School of Environmental Studies of Kenyatta
University
DECLARATION
This thesis is my original work and has not been presented for a degree in any other university or any other award.
Signature……… Date………
Kimiti Winnie Wanjiru N50/CTY/PT/33497/2014
SUPERVISORS
We confirm that the work reported in this thesis was carried out by the candidate under our supervision.
Signature……… Date………
Dr. Monicah Mucheru-Muna
Department of Environmental Science School of Environmental Studies Kenyatta University
Signature……… Date………
Dr. Jayne Njeri Mugwe
DEDICATION
ACKNOWLEDGEMENTS
I sincerely express appreciation to my supervisors; Dr. Monicah Mucheru-Muna, and Dr. Jayne Mugwe for their academic guidance and support. I am also very grateful to Dr. Felix Ngetich who worked closely with my supervisors and ensured all field work was successful. I highly acknowledge the Alliance for a Green Revolution in Africa (AGRA) for the financial support of the research work through the project “Scaling up soybean and climbing beans through a value chain approach in maize-based systems of central Kenya’’ (2013 SHP 014-SoCo Project). I thank the entire team in the SoCo Project for the support provided during the research work. The project coordinator Peter Ndegwa and field technician Anthony Njagi are highly acknowledged for their unconditional contribution and support.
I appreciate my colleagues, Peter Kibet and Mohammed Ndung’u for the great support, teamwork, and encouragement. I am also grateful to the laboratory technicians; Mathew Theuri, Kennedy Kilel, and Jane Karambu from Department of Agricultural Resource Management for the great support offered during my entire laboratory work. I highly appreciate farmers in Kirege who offered land for the research work and who also spent tireless time with me on the farm.
TABLE OF CONTENTS
DECLARATION ... ii
DEDICATION ... iii
ACKNOWLEDGEMENTS ... iv
LIST OF FIGURES ... ix
LIST OF ACRONYMS AND ABBREVIATIONS ... x
ABSTRACT ... xii
CHAPTER ONE ... 1
INTRODUCTION ... 1
1.1 Background Information ... 1
1.2 Problem Statement and Justification... 3
1.3 Research Questions ... 4
1.4 Research Objectives ... 4
1.5 Research Hypotheses ... 4
1.6 Significance of the Study ... 5
1.7 Conceptual Framework ... 5
1.8 Definition of terms ... 8
CHAPTER TWO ... 9
LITERATURE REVIEW ... 9
2.1 General overview ... 9
2.2 Soil pH and acidity ... 9
2.3 Causes of soil acidity ... 11
2.4 Effects of lime, manure and NPK fertilizer on soil chemical properties ... 12
2.4.1 Effect of lime on soil chemical properties ... 13
2.4.2 Effect of manure on soil chemical properties ... 15
2.4.3 Effect of mineral fertilizers on soil chemical properties ... 16
2.5 Effects of manure, lime and phosphorus fertilizer on yield ... 17
2.7 Gaps identified in literature ... 20
CHAPTER THREE... 21
MATERIALS AND METHODS ... 21
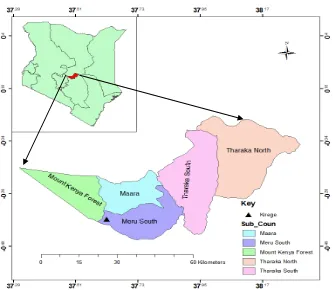
3.1 Description of the study area ... 21
3.2 Experimental Design... 24
3.3 Soil Sampling ... 25
3.3.1 Laboratory Analysis ... 26
3.3.2 Determination of yield component... 27
3.3.3 Profitability ... 28
3.4 Rainfall measurement ... 29
3.5 Data Analysis ... 30
CHAPTER FOUR ... 31
RESULTS AND DISCUSSION ... 31
4.1 Rainfall... 31
4.2 Effects of lime, manure and phosphorus fertilizer on soil chemical properties ... 32
4.2.1 Soil pH and exchangeable acidity ... 32
4.2.2 Soil exchangeable cations ... 36
4.2.3 Soil Available phosphorus ... 40
4.3 Effects of lime, manure and P fertilizer on maize growth and yield ... 42
4.4 Effects of manure, lime and P fertilizer on dry matter and grain yield ... 47
4.5 Effects of manure, lime and P fertilizer on profitability ... 49
CHAPTER FIVE ... 53
SUMMARY, CONCLUSION AND RECOMMENDATION ... 53
5.1 Summary ... 53
5.2 Conclusion ... 54
5.3 Recommendation ... 54
5.4 Areas of further research... 54
LIST OF TABLES
Table 3.1: Initial soil chemical characteristics at 0-20 cm before planting (September 2016) at Kirege. ... 23 Table 3.2: Average nutrient composition (%) of Manure applied in the soil during
the Experimental period at Kirege, Tharaka- Nithi County, Kenya ... 23 Table 3.3: Treatments at Kirege site on ten farms during the 2016SR and 2017LR ... 25 Table 3.4: Parameters used in the profitability analysis of the selected ISFM
technologies ... 28 Table 4.1: Changes in soil pH (0-20 cm depth) in the different treatments during the
2016SR and the 2017LR seasons in Kirege ... 33 Table 4.2: Changes in soil exchangeable acidity (0-20 cm depth) in the different
treatments during the 2016SR and the 2017LR seasons in Kirege ... 35 Table 4.3: Changes in Soil exchangeable cations (cmol(+) kg-1 soil) (0-20 cm
depth) in the different treatments during the 2016SR and the 2017LR seasons in Kirege ... 38 Table 4.4: Changes in soil available P (0-20 cm depth) in the different treatments
during the 2016SR and the 2017LR seasons in Kirege ... 41 Table 4.5: Changes in plant height (cm) in the different treatments during the
2016SR and the 2017LR seasons in Kirege ... 43 Table 4.6: Changes in chlorophyll content ( SPAD units) in the different treatments
during the 2016SR and the 2017LR seasons in Kirege ... 45 Table 4.7: Stover yields (t ha–1) in the different treatments during the 2016SR and
LIST OF FIGURES
Figure 1.1: Conceptual framework of the study ... 7 Figure 3.1: A map of the study area ... 22 Figure 4.1: Rainfall distribution during 2016 short rains (October to December 2016)
LIST OF ACRONYMS AND ABBREVIATIONS AEZ Agro-Ecological Zones
Al Aluminium
ANOVA Analysis of Variance BCR Benefit-Cost Ratio
Ca Calcium
CaCo3 Calcium Carbonate Cmol Cent mole
DAP Diammonium Phosphate
H Hydrogen
ISFM Integrated Soil Fertility Management
K Potassium
LR Long Rains
LSD Least Significant Difference
Mg Magnesium
N Nitrogen
Na Sodium
NBR Net Benefit Return
P Phosphorus
pH Power Hydrogen ions
RCBD Randomized Complete Block Design SAS Statistical Application System
SR Short Rains
TSP Triple Super Phosphate UM Upper Midland
ABSTRACT
In Sub-Saharan Africa, acidic soils occupy 29% of the total area, while about 13% of the Kenyan total land area has acidic soils, widely distributed in croplands of the central regions. The high soil acidity coupled with soil nutrient depletion negatively affect performance and yields of maize in the region. This study was therefore carried out at Kirege in Tharaka Nithi County for two cropping seasons; short rains (SR) in 2016 and long rains (LR) in 2017 to determine the effects of manure, lime and inorganic fertilizer on (i) soil chemical properties (ii) maize yield and (iii) profitability. The treatments included manure (0, 5 and 10 t ha-1), lime (0 and 2 t ha-1), and P fertilizer (0, 30 and 60 kg P2O5 ha-1). Maize (H516) was used as the test crop. The
CHAPTER ONE INTRODUCTION
1.1 Background Information
Globally, soil acidity is a key problem contributing towards reduced agricultural productivity (Van, 2007) hence threatening food security in Africa. About 4 billion hectares face the effects of acidity, representing a total area of approximately 30% of the land worldwide (Sumner and Noble, 2003). Most of these soils with high acidity are mainly found in Asia, North and South America, and Africa, attributed to extensive leaching and weathering (Kisinyo et al., 2014). In Sub-Saharan Africa (SSA), acidic soils occupy 29% of the total area, which is associated with reduced fertility levels (Muindi et al., 2016). Acidic soils in Kenya occupy approximately 13% of the agricultural area which is estimated to be 7.5 million hectares of land (Kanyanjua et al., 2002). Over 5 million small-scale farmers in the central and western part of Kenya grow maize, legumes, tea, and coffee in over million ha covered by acidic soils (Gudu et al., 2007).
There is minimal and reduced crop productivity on such acidic soils, mostly where the application of acid-forming fertilizers like di-ammonium phosphate (DAP) are used continuously over the years (Nekesa, 2007). Low crop production as a result of multi-nutrient deficiencies has made it mandatory to use mineral fertilizer in order to increase crop yield. Nevertheless, mineral fertilizers are costly, inadequate and their continued use without liming may result to soil acidity problems (Oguike et al., 2006).
The soil acidity problem can be resolved by application of lime (Kanyanjua et al., 2002) an important practice because of reducing exchangeable acidity and increasing pH. However, lime use by farmers in Kenya is minimal. Only 10% of the farmers in Embu and Siaya; and 5% of farmers in Nyeri and Eldoret use lime (Muindi et al., 2016). Low use of lime is perhaps due to lack of awareness on the benefits of liming, unavailability in the market and high liming materials costs (Kanyanjua et al., 2002; Okalebo et al., 2009).
1.2 Problem Statement and Justification
1.3 Research Questions
The study sought to address the following questions:
i. How does agricultural lime, manure, and inorganic fertilizer affect soil chemical properties in Tharaka-Nithi County?
ii. How does agricultural lime, manure and inorganic fertilizer influence maize yield in Tharaka-Nithi County?
iii. How does the use of agricultural lime, manure, and inorganic fertilizer influence maize profitability in smallholder farmers in Tharaka-Nithi County?
1.4 Research Objectives
The general purpose of the study was to promote soil productivity in acidic soils thus improving food security. The study sought to address the following specific objectives:
i. To determine the effect of agricultural lime, manure, and inorganic fertilizer on soil chemical properties in Tharaka-Nithi County.
ii. To evaluate the effect of agricultural lime, manure and inorganic fertilizer on maize growth and yield in Tharaka-Nithi County.
iii. To assess the profitability of agricultural lime, manure and inorganic fertilizer in production of maize in Tharaka-Nithi County.
1.5 Research Hypotheses
The study was guided by the following hypotheses:
ii. Application of agricultural lime, manure, and inorganic fertilizers significantly improve maize yield.
iii. Integrated use of agricultural lime, manure, and inorganic fertilizers significantly increase the profits in maize production among smallholder farmers.
1.6 Significance of the Study
The findings from this study will contribute to scientific knowledge on how lime, manure and fertilizer affect soil properties, maize yield and profitability in the central highlands of Kenya. This would be helpful to smallholder farmers who have small sizes of land and have difficulties in managing acidic soils. Such information will also enable the extension service providers to advise farmers on the most appropriate integrated soil fertility management to increase yield.
1.7 Conceptual Framework
1.8 Definition of terms
Integrated soil fertility management (ISFM): is an approach that have viable agricultural practices options that are sufficient for sustainable production in agriculture that is adapted to local conditions to utilize efficiency water use and supply of nutrients as well as improved agricultural productivity.
Lime: refers to calcium or calcium-magnesium containing compounds capable of reducing harmful effects of an acid soil by neutralizing soil acidity and raising the soil pH
Smallholder farmers: Farmer with small land parcels of 3 acres or less whose primary occupation is farming as a source of livelihood.
Soil acidity: refers to concentration of hydrogen cations in a solution
Soil Amendment: These are soil additives meant to improve soil quality during the trials period. They include lime, manure and P fertilizer.
Soil pH: refers to the negative logarithm (base 10) of the activity of hydrogen ions in a solution.
CHAPTER TWO LITERATURE REVIEW
2.1 General overview
Soil acidity has been reported as the main limitation to crop growth in the tropical region (Busari et al., 2008). The tropical land that was one time productive has been reported to be infertile due to consistent farming and erosion causing physical soil destruction, low organic matter and a decline in cation exchange capacity (CEC) as well as increased manganese (Mn) and aluminium (Al) toxicity (Kafle and Sharma, 2015). Other than Al and Mn toxicity, deficiencies of calcium, magnesium, and phosphorus in the soils are also considered as other significant constraints that limit plant growth on acidic soils (Liao et al., 2006).
The agricultural sector is constrained by low available soil nitrogen and available phosphorus due to high soil acidity that results in low crop yield in both commercial and small-scale farms (Sanchez and Jama, 2002; Kisinyo, 2012). In Kenyan highlands, most of the improved maize germplasm and land used by farmers are responsive to the high exchangeable Al (>2 cmol kg-1) and high (>20%) Al saturation commonly encountered in many acidic soils (Kifuko et al., 2007).
2.2 Soil pH and acidity
with pH less than 4.4 are considered exceedingly acidic, 4.5 to 5.5 strongly acidic, 5.5 to 6.0 are moderately pH, and 6.1 to 6.5 are considered slightly acidic (Kanyanjua et al., 2002). Table 2.1 shows the classification of soils based on the soil pH.
Table 2.1: Classification of soils based on the soil pH
Degree of Acidity/Alkalinity Soil pH Range
Extremely acidic < 4.4
Very strongly acidic 4.5-5.0
Strongly acidic 5.1-5.5
Moderately acidic 5.6-6.0
Slightly acidic 6.1-6.5
Neutral 6.6-7.3
Slightly alkaline 7.4-7.8
Moderately alkaline 7.9-8.4
Strongly alkaline 8.5-9
Source: USDA (1999)
phosphorus is particularly sensitive and becomes a limiting nutrient to the soil (Harun et al., 2005). Also decline in the soil pH stimulate presence of phytotoxicity substances, e.g. Mn and Al resulting in acidic soil infertility thus limiting crop production (Proietti et al., 2015).
2.3 Causes of soil acidity
Soil acidity maybe as a result of the natural process caused by acidic parent materials, the decay of organic matter and leaching by rainfall (Havlin et al., 2005) making soils to be inherently acidic especially in areas with high rainfall (McCauley et al., 2009). The differences in parent material chemical composition, soils becomes more acidic within a prolonged period of time (Rowell, 2014). Thus, soils developed from limestone or calcareous rocks are less acidic than those developed from granite material. Organic matter decay produces H+ that is responsible for acidity in the soil, though it forms a weak acid the effects in the soils accumulate over many years (Thapa, 2015). On the other hand, excessive rainfall causes soils to become acidic over a long time through continuous removal of basic cations in the soils (Reuss and Johnson, 2012).
ammonium nitrate, urea and anhydrous ammonia (Khan et al., 2018). The superphosphate fertiliser has no effect on soil pH, however, its application stimulates legumes that fix atmospheric nitrogen. This leads to increase in the amount of nitrate nitrogen hence leaching in the soil below plant root zone causing soil acidification. The high yielding crops such as wheat and maize tend to draw cations (lime-like elements) from the soil hence causing soil acidity to develop much faster than other crops (Nwite et al., 2016). The soils become more acidic thus plants that are intolerant to the acidic conditions cannot thrive well hence result to productivity decline.
Attempt to adjust the soil acidity is important to neutralize the toxicities caused by solubility of aluminium and manganese in the soil and most importantly to replace the lost plant nutrients cations, particularly magnesium and calcium (Fageria and Baligar, 2008). Liming of the soil is the most easy and economical way to manage the adverse effect of toxic elements in the soil. Through liming, soil pH is raised hence causing aluminium and manganese to be held in insoluble form with other elements hence does not harm to plants (Fageria and Baligar, 2008). The toxic elements are problem in acidic soils since they are more soluble at low pH.
2.4 Effects of lime, manure and NPK fertilizer on soil chemical properties
possibility to decrease or increase crop yields (Masulili et al., 2010). Amendments of soil through application of lime, fertilizer or manure sole or combined may lead to improvement of soil conditions thus forming favourable conditions that enhances crop development, growth and yield (Fageria et al., 2010).
2.4.1 Effect of lime on soil chemical properties
Liming lowers acidity of soils and improves soil fertility of acid soils (Caires et al., 2008; Brown et al., 2008). Lime is comprised of carbonates, oxides or hydroxides which can be added in form of calcium carbonate, calcium oxide, calcium hydroxide and granulated lime (Mayfield et al., 2004). When CaCO3 is added to a moist soil, the
following reactions occur:
I. Soil moisture dissolves lime to produce calcium ions (Ca2+) and hydroxide (OH–): 𝐂𝐚𝐂𝐎𝟑+𝐇𝟐𝐎 𝐢𝐧 𝐬𝐨𝐢𝐥 → 𝐂𝐚𝟐+ + 𝟐𝐎𝐇– + 𝐂𝐎𝟐 𝐠𝐚𝐬 Equation [1]
II. Al3+ and H+ exchanges with the newly Ca2+ produced on acid soils surface: OH– produced by Lime reacts with Al3+ to form solid Al (OH-)3, or H+ react
with OH– to form H2O:
𝐎𝐇− + 𝐇+⟶𝐇2𝐎 Equation [2]
𝟑𝐎𝐇− + 𝐀𝐥𝟑+→𝐀𝐥(𝐎𝐇)3𝐬𝐨𝐥𝐢𝐝 Equation [3]
Thus, liming through the reactions with OH– eradicates toxic H+ and Al3+ . The soil pH will then be raised by the excess OH– from lime. This is the most recognizable liming effect (Brown et al., 2008). Other advantage of liming is the addition of Ca2+supply in the soil and Mg2+ incase dolomite [Ca, Mg (CO3)2] is used. Philip and Martin, (2003)
plants. Magnesium is fundamental to formation of plant chlorophyll and aids in phosphorus uptake while calcium is importantly essential for numerous structural roles in the cell membrane and cell wall formation. Ca2+ is also a counter-cation for organic and inorganic anions in the vacuole. The cytosolic Ca2+ concentration ([Ca2+]cyt) helps in response coordination to various developmental signals or even on environmental challenges, as an obligate intracellular messenger (Philip and Martin, 2003). Calcium and Magnesium are often underprovided in vastly weathered acidic soils (Uchida and Hue, 2000).
Liming increases P availability, soil pH, and reduces aluminium concentration in acidic soils (Fageria and Stone, 2004) and improves plant growth is as a result of increased soil pH and reduced phytotoxic levels of Al (Fageria and Beligar, 2008). There is a natural deficiency in available and total P in acidic soils due to immobilized portions of applied P as a result of precipitation of P in an insoluble Al phosphate to Al oxide (Nurlaeny et al., 1996). Liming results into a release of P for uptake by plant an effect referred to as ‘‘P spring effect’’ of lime (Bolan and Hedley,2003). Fageria and Baligar (2004) reported improved efficiency of P, and micronutrients in upland rice genotypes through use of lime in acidic soils. The study showed that efficiency of these nutrients was higher under soil pH of 6.4 than in pH 4.5. At low pH, liming the soil precipitates Al and Fe as Al(OH)3 and Fe(OH)3 hence increase plant P availability
a new set of effect as it causes deficiency and cation imbalances (Robert and Burgholzer, 1998). In other cases, over liming soils to pH 6.8-7.0 reduces P availability in the soil due to the precipitation of Ca or Mg phosphates (Isherwood, 2003).
Appropriate rate of lime application brings several biological and chemical changes in the soils, that are important in crop yield improvement on acid soils (Fageria and Beligar, 2008). Kaitibie et al. (2002) noted that liming is a long-term method widely used for amelioration of soil acidity, and its performance is well documented (Scott et al., 2001).
2.4.2 Effect of manure on soil chemical properties
The continued rise in fertilizer prices, has led to great drive to either substitute or supplement mineral fertilizers with cheaper and renewable sources of soil nutrients like organic manures (Sanginga and Woomer, 2009). Ability of manure to improve soil chemical and physical properties is known, and in terms of the soil supplying nutrients in a form that is readily available to plants (Tejada et al., 2006).
reported to reduce Al toxicity (Wong and Swift, 2003; Tejada et al., 2006; Tang et al., 2007). Hailin (1998) found that soil pH was higher by 0.5 units to a depth of 30 cm under soils with manure than in soils without manure. Increase in soil pH has been attributed to phenoic, humic-like material present in manure that cause proton exchange between the soil and manure (Tang et al., 2007). Another mechanism proposed to reduce soil acidity by manure is the adsorption of humic material and/or organic acids (from decomposition) onto hydrous surfaces of Al and Fe oxides through the exchange with subsequent discharge of OH- (Hue et al., 1986).
Manure can be utilized as a source of fertilizer for enhancement of yield in the central highlands of Kenya (Mucheru-Muna et al., 2007; Mugwe et al., 2007; Mugwe et al., 2009; Mucheru-Muna et al., 2014). Use of organic amendments in form of livestock manures and crop residues has been reported to increase availability of P through stimulating microorganisms that solubilize soil P and improve soil moisture conditions (Fankem et al., 2008). Other benefits of manure varies from soil structure maintenance and carbon sequestration (Palm et al., 2000; Craswell and Lefroy, 2001; Merckx et al., 2001). Microbial activity is needed for manures to decompose in order to release nutrients, this is slow but has positive results.
2.4.3 Effect of mineral fertilizers on soil chemical properties
(McCauley et al., 2009). Farmers are aware that lack of application of inorganic fertilizers reduces crop productivity due rapid decline in soil nutrient levels (Blackwell et al., 2009).
The annual loss of soil nutrients in Kenya is at an average of 3 kg P, 42 kg N and 29 kg K per ha (Smaling, 1997). Application of inorganic fertilizer is one way that address this situation as it increases nutrient availability in the soil solution hence enhancing their availability for easy supply to the soil for plant uptake (Mugwe et al., 2007). The issue of mineral fertilizer application is controlled by the elevated cost that the less privileged farmers cannot afford (Eakin, 2000). Generally, mineral fertilizer is necessary, as they are used to supplement the natural soil nutrient supply, compensate for the lost nutrients by removal of plant products, gaseous loss or through leaching to satisfy the demand of crops with high yield and economically viable yields (Mucheru-Muna et al., 2014). Application of P fertilizer was reported to have a significant positive effects on available P and soil pH in acid soil of Western Kenya (Kisinyo et al., 2012).
2.5 Effects of manure, lime and phosphorus fertilizer on yield
the number of pod weight and number. Nekesa et al. (2011) in western Kenya also found that combination of lime and fertilizer ( DAP and TSP) led to significant increases in soybean yield.
Liming is an essential method of increasing yields of crops grown on acid soils. The best practice is one that combines lime, organic manure and inorganic fertilizers (Mukuralinda, 2007). This has been observed to be the most appropriate technique of addressing the problem of soil acidity and enhancing soil fertility in Rwanda (Ruganzu, 2009). Significant yield increases have been observed in areas where the organic and inorganic nutrient sources have been applied together with lime, particularly in the research stations (Nabahungu, 2003).
In other studies, high maize grain yield was obtained when mineral fertilizer and manure were applied together (Mugendi et al., 1999; Mucheru-Muna et al., 2007). Jagadeeswaran et al. (2005) and Tittonell et al. (2007) reported that the organic fertilizers most accessible to farmers have low nutrient concentrations with inadequate potential to improve crop yields when applied as the sole source of nutrients. However, a combination of both inorganic and organic fertilizer may significantly show to be more effective than the sole application (Vanlauwe et al., 2001).
(2012), reported reduced soil acidity menace through combination of organic manure and lime.
2.6 Yield and profitability on combined use of lime, manure, and inorganic fertilizer
Profitability is the major incentive to adopt organic and inorganic fertilizer and a key
factor that determine their patterns use (Ragasa and Chapoto, 2017). The adoption and
sustainable effect of organic and inorganic inputs depend on the degree to which their
use is profitable. According to Snapp et al. (2003) fertilizer application increased crop yield of farmers had extra yield by 105% and profit of 21–42% compared to
non-adopters in Malawi.
the highest economic returns as compared with the sole or separate application (Manpreet and Dixit, 2017).
2.7 Gaps identified in literature
CHAPTER THREE MATERIALS AND METHODS
3.1 Description of the study area
Figure 3.1: A map of the study area showing location of trial sites
Table 3.1: Initial soil chemical characteristics at 0-20 cm before planting (September 2016) at Kirege.
Soil Chemical Properties Baseline Value
Soil pH 4.64
Exchangeable acidity (cmol kg-1 ) 0.39
Total organic carbon (%) 1.80
Total nitrogen (%) 0.17
Phosphorus (ppm) 11.56
Potassium (cmol kg-1 ) 0.42
Calcium (cmol kg-1 ) 3.25
Magnesium (cmol kg-1 ) 0.92
Manganese (cmol kg-1 ) 0.52
Copper ppm 5.81
Iron ppm 31.27
Zinc (ppm) 7.20
Sodium (cmol kg-1 ) 0.27
The manure used was analyzed for pH, total N, available P and exchangeable cations (Ca, Mg, K, Al3+ and H+) following the procedures as outlined by Okalebo et al. (2009). Table 3.2 shows the characteristics of manure used in the experiment.
Table 3.2: Average nutrient composition (%) of Manure applied in the soil during the Experimental period at Kirege, Tharaka- Nithi County, Kenya
Manure Properties Value
Total Nitrogen (%) 2.10
Phosphorus (ppm) 0.16
Potassium (cmol kg-1 ) 0.64
Calcium (cmol kg-1 ) 0.70
Magnesium (cmol kg-1 ) 0.33
Manganese (cmol kg-1 ) 228
Copper (ppm) 38.7
Iron (ppm) 141
3.2 Experimental Design
Table 3.3: Treatments at Kirege site on ten farms during the 2016SR and 2017LR
Treatment Input application rates
Lime Manure Inorganic (NPK)
Control No Inputs
Lime 2 t ha-1 - -
Manure - 10 t ha-1
Inorganic Fertilizer - - 60 Kg ha-1
Lime + manure 2 t ha- 10 t ha-1 -
Manure + inorganic fertilizer - 5 t ha-1 30 Kg ha-1
Lime + inorganic fertilizer 2 t ha-1 - 60 Kg ha-1
Lime + inorganic fertilizer + manure 2 t ha-1 5 t ha-1 60 Kg ha-1
During land preparation, lime and goat manure were broadcasted and incorporated into the soil thoroughly using a hoe four weeks before planting. The inter-row and intra-row spacing was 75 cm and 50 cm, respectively. Three seeds were sown per hole and then thinning done two weeks after germination leaving two plants per hole. During planting NPK (23:23:0) fertilizer was applied at the recommended rate (60 kg N ha-1). These fertilizers were then mixed with soil thoroughly to avoid direct contact with the seeds. The first weeding was done four weeks after planting and then second one at two weeks after the first weeding. Buldock pesticide spray was used which was done two months after planting to prevent pests and diseases.
3.3 Soil Sampling
samples were labelled, packed and taken to laboratory for chemical analyses during all the sampling intervals.
3.3.1 Laboratory Analysis
The samples collected were analyzed for soil pH, available P, base saturation (Ca2+, Mg2+, K+ and Na+) soil organic C and total N.
3.3.1.1 Soil pH
The soil pH was measured in a ratio of 1:2 soil:water ratio (Ryan et al., 2011) where the ratio was attained by mixing 20 ml of distilled water with 10g of soil in a 100 ml beaker, followed by measuring the pH after 30 minutes of shaking and waiting for it to settle using a pH meter.
3.3.1.2 Exchangeable bases (K, Na, Ca and Mg) and extractable P
Exchangeable bases and soil extractable P were extracted using Mehlich 1 method (Mehlich, 1953). Approximately 5 g of air-dried soil, ground and passed through 2 mm sieve was weighed then extracted using 25 ml of mixed 0.025M H2SO4 and 0.1M
HCl solution., using an automatic shaker, the suspension was shaken for 1 hour then put in a centrifuge and filtered using filter paper.
3.3.1.3 Total organic carbon
Soil organic C was determined using the Walkley-Black method calorimetrically by H2SO4 dichromate oxidation (Van Lagen, 1996). Approximately soil weighing 1.00 g was weighed into a erlenmeyer flask (500 ml), 10 ml of 1N potassium dichromate solution and 20 ml sulfuric acid was added and mixed by gentle rotation for one minute, with care avoiding throwing soil to the flask sides. The mixture was then let to stand for 30 minutes. Deionized water was used to dilute to 200 ml then phosphoric acid (10 ml), 0.2 g ammonium fluoride, and then 10 drops of diphenylamine indicator was added. Ferrous ammonium sulfate solutions (0.5 N) was titrated till the change of color from dull green to turbid blue. Addition of drop by drop of titrating solution until the end point was reached when the color shifted to a brilliant green. Preparation of a blank solution was made and titrated in the same manner.
3.3.1.4 Total nitrogen: Kjeldahl method
The total N was determined using Kjeldahl oxidation method (Ryan et al., 2011) through digestion with a concentrated sulphuric acid and a mixed catalyst that has potassium sulphate (K2SO4), copper sulphate hydrated (CuSO4) and selenium.
Distillation was used to determine Total N, titration followed with diluted standardized 0.007144 N H2SO4.
3.3.2 Determination of yield component
3.3.2.1 Determination of Chlorophyll content
At the 4th, 8th and 12th week from planting time, chlorophyll content was determined using a SPAD meter. The meter (SPAD-502) measures the amount of chlorophyll present in the leaf.
3.3.2.2 Determination of plant height
Maize plant height was measured as an indicator of maize growth during the 4th, 8th and 12th week after planting. Eight plants were randomly selected per plot and tape measure was used to measure the height of the plants. The plants were measured in centimeters from the soil surface of the plant to the longest tip of the leaf.
3.3.3 Profitability
The profitability analysis in the study considered the cost of farm inputs; seeds, fertilizer, pesticides purchased, operations costs and returns from the stover and maize sales (Table 3.4). For each activity, time was taken and recorded using a stop watch where labour was valued at a local wage of Kshs. 200 (USD 2) per day (eight hours).
Table 3.4: Parameters used in the profitability analysis of the selected ISFM technologies
Parameter Cost (USD)
Price of maize seed (kg-1) 1.90
Price of TSP fertilizer ((P kg-1) 0.78
Price of NPK fertilizer (kg-1) 0.60
Price of CAN fertilizer (kg-1) 0.50
Labour cost (day-1) 2.00
Price of maize grains (kg-1) 0.30
Price of maize stover (t-1) 30.00
On the other hand, the returns during the study period were based on prevailing market price for maize grain (Table 3.4). In the area, the farmers use maize stover as cattle feed and therefore it was valued at a market price thus considered as an additional benefit. Costs of farm inputs (TSP, NPK, Lime, CAN, seeds and insecticides) were based on retail prices as per agro-vet stockists in Embu.
3.4 Rainfall measurement
3.5 Data Analysis
CHAPTER FOUR RESULTS AND DISCUSSION 4.1 Rainfall
The distribution of rainfall during the study period varied between the seasons. Cumulatively, 2017LR received higher rainfall amounts than 2016SR. The total rainfall recorded in 2016SR and 2017LR was 455 mm and 967 mm, respectively (Figure 4.1). There was soil moisture deficit for most of the growing season during 2016 SR, with more than 80% of the rain being received in the first month followed by a prolonged dry season. This adversely affected crop yields.
Figure 4.1: Rainfall distribution during 2016 short rains (October to December 2016) and 2017 long rains (March to May 2017) at Kirege, Tharaka Nithi County, Kenya
(Omoyo et al., 2015). On the other hand, sufficient and well-distributed rainfall was received in 2017LR. In the 30-day and 45-day periods, rainfall amounts of 300 and 500 mm received, are in line with crop water requirements (FAO, 2001). They indicate rainfall required to prevent water shortage during the reproductive phase (Omoyo et al., 2015). The well-distributed rainfall across the season is often more important than total rainfall, as soil moisture is retained at a desired level for crop growth (Fischer, 2015).
4.2 Effects of lime, manure and phosphorus fertilizer on soil chemical properties 4.2.1 Soil pH and exchangeable acidity
Table 4.1: Changes in soil pH (0-20 cm depth) in the different treatments during the 2016SR and the 2017LR seasons in Kirege
Treatments Baseline (Sept 2016)
2016SR %
Change
t-test, p
2017LR %
Change
t-test, p
Lime + ½ fertilizer + ½ manure
4.64a 5.23a 12.72 0.0107 5.35a 15.30 0.0015
Lime + fertilizer 4.63a 5.01a 8.21 0.002 5.26a 13.61 0.0004
Fertilizer 4.71a 4.96a 5.31 0.0469 4.95ab 5.10 0.0515
½ Manure + ½ fertilizer
4.61a 5.07a 9.98 0.0026 5.13a 11.28 0.0025 Lime + manure 4.61a 5.21a 13.02 0.0004 5.30a 14.97 <.0001
Manure 4.71a 4.98a 5.73 0.003 5.20a 10.40 0.0001
Lime 4.51a 4.99a 10.64 0.009 5.28a 17.07 <.0001
Control 4.70a 4.71a 0.21 0.9207 4.64b -1.28 0.6158
P-value 0.9887 0.5504 0.0228
LSD 0.446 0.490 0.421
*Means with the same letter(s) are not significantly different from each other at 5% level of significance
application. However, Shrestha (2015), noted that the quality of manure determines its efficiency in increasing soil pH. This may explain why manure had a slower rate in soil pH increase in comparison to lime. Nyambati et al. (2003) and Mugwe et al. (2009) noted that frequent application of organic manure over the season could improve the pH of moderate acid infertility.
Liming in this study increased the soil pH. This corroborates with the findings of The et al. (2001) who reported similar findings with application of 2 t ha-1 of lime. Anetor and Akinrinde (2006) in a study using lime and P fertilizers reported significant improvement in soil pH and attributed this to the effect of lime. Sole or combined application of manure and lime as reported by Repsiene and Skuodiene (2010) significantly increased pH, Ca and Mg and reduced Al concentration. Similary, Ademba et al. (2010) in a study with 250 kg ha-1 of lime, 60 kg P2O5 ha-1 and sole 10 t
ha-1 of manure reported an increase in pH, Mg, Ca, K, and total P.
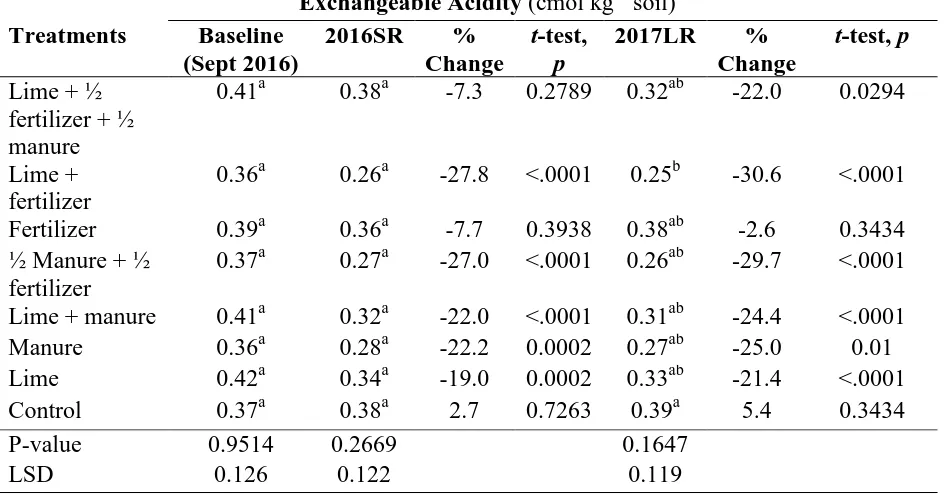
Table 4.2: Changes in soil exchangeable acidity (0-20 cm depth) in the different treatments during the 2016SR and the 2017LR seasons in Kirege
Exchangeable Acidity (cmol kg-1 soil)
Treatments Baseline (Sept 2016)
2016SR %
Change
t-test, p
2017LR %
Change
t-test, p
Lime + ½ fertilizer + ½ manure
0.41a 0.38a -7.3 0.2789 0.32ab -22.0 0.0294
Lime + fertilizer
0.36a 0.26a -27.8 <.0001 0.25b -30.6 <.0001 Fertilizer 0.39a 0.36a -7.7 0.3938 0.38ab -2.6 0.3434 ½ Manure + ½
fertilizer
0.37a 0.27a -27.0 <.0001 0.26ab -29.7 <.0001 Lime + manure 0.41a 0.32a -22.0 <.0001 0.31ab -24.4 <.0001
Manure 0.36a 0.28a -22.2 0.0002 0.27ab -25.0 0.01
Lime 0.42a 0.34a -19.0 0.0002 0.33ab -21.4 <.0001
Control 0.37a 0.38a 2.7 0.7263 0.39a 5.4 0.3434
P-value 0.9514 0.2669 0.1647
LSD 0.126 0.122 0.119
*Means with the same letter(s) are not significantly different from each other at 5% level of significance
Highly acid soils (pH<5) have high concentration of Al3+ and H+ ions, which negatively affects the availability of basic nutrients for the uptake by crops (Md, 2014). The results showed that treatment with sole lime and manure or combined increased soil pH and reduced exchangeable acidity. The reduction in exchangeable acidity of the soil may be attributed to increase in basic cations (Mg2+ and Ca2+ ) (Fageria et al., 2008) and anions (CO3-2) present in lime that enable the exchange H+
from exchange sites to form CO2 + H2O. This causes rise in soil pH since H+ space left
behind is occupied by cations on the exchange sites (Fageria et al., 2008).
the process of dissolution of P fertilizer. Harter (2007) reported soil acidifying effect from phosphorus-based fertilizer as a result of phosphoric acid, whereby H+ ions are gradually released to the soil, thus, causing acidifying effect to the surrounding soil band.
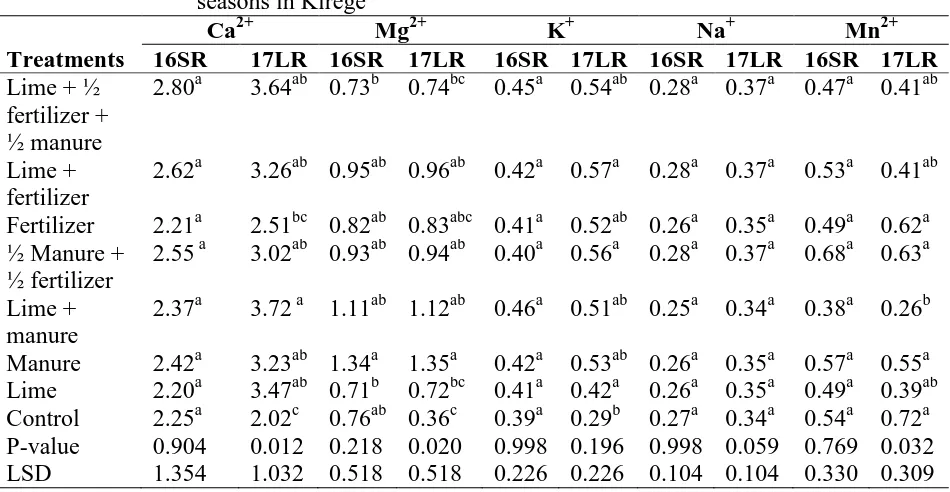
4.2.2 Soil exchangeable cations
In 2016SR season, treatments had no significant effect on soil exchangeable cations (Ca2+, Mg2+, K+, Na+, and Mn2+) (Table 4.3). In 2017LR, application of the treatments had a significant effects in all the treatments except for Na (p = 0.0598) in both seasons. During the 2017LR the treatments significantly (p = 0.0117) increased exchangeable Ca2+ values in treatments as follows: lime (58%), manure (33%), lime with manure combined with fertilizer (30%). The sole application of fertilizer significantly (p=0.0117) increased soil exchangeable Ca2+ with 14% change. In the same period, the control recorded the lowest increase in soil exchangeable Ca2+ (-10%) was recorded.
In 2017LR season, treatments application had a significant (p = 0.0204) increase in exchangeable Mg2+ (Table 4.3). Soil exchangeable Mg2+ increase was highest in lime + ½ fertilizer + ½ manure and lime + manure treatments with +0.30 changes from the baseline. The control had the lowest Mg2+ value of 0.76 and 0.36 cmol (+) kg-1 in 2016 SR and 2017 long rain, respectively.
the highest changes of +40% and +36%, respectively. The highest numerical values were recorded for lime + fertilizer and ½ manure + ½ fertilizer with 0.57 cmol (+) kg-1 and 0.56 cmol (+) kg-1 soil, respectively. Lowest values were recorded in lime alone (0.42 cmol (+) kg-1 soils) and lime + manure (0.46 cmol (+) kg-1 soils) corresponding to +2% and +11% change, respectively.
Table 4.3: Changes in Soil exchangeable cations (cmol(+) kg-1 soil) (0-20 cm depth) in the different treatments during the 2016SR and the 2017LR seasons in Kirege
Ca2+ Mg2+ K+ Na+ Mn2+
Treatments 16SR 17LR 16SR 17LR 16SR 17LR 16SR 17LR 16SR 17LR Lime + ½
fertilizer + ½ manure
2.80a 3.64ab 0.73b 0.74bc 0.45a 0.54ab 0.28a 0.37a 0.47a 0.41ab
Lime + fertilizer
2.62a 3.26ab 0.95ab 0.96ab 0.42a 0.57a 0.28a 0.37a 0.53a 0.41ab Fertilizer 2.21a 2.51bc 0.82ab 0.83abc 0.41a 0.52ab 0.26a 0.35a 0.49a 0.62a ½ Manure +
½ fertilizer
2.55 a 3.02ab 0.93ab 0.94ab 0.40a 0.56a 0.28a 0.37a 0.68a 0.63a Lime +
manure
2.37a 3.72 a 1.11ab 1.12ab 0.46a 0.51ab 0.25a 0.34a 0.38a 0.26b Manure 2.42a 3.23ab 1.34a 1.35a 0.42a 0.53ab 0.26a 0.35a 0.57a 0.55a Lime 2.20a 3.47ab 0.71b 0.72bc 0.41a 0.42a 0.26a 0.35a 0.49a 0.39ab Control 2.25a 2.02c 0.76ab 0.36c 0.39a 0.29b 0.27a 0.34a 0.54a 0.72a P-value 0.904 0.012 0.218 0.020 0.998 0.196 0.998 0.059 0.769 0.032 LSD 1.354 1.032 0.518 0.518 0.226 0.226 0.104 0.104 0.330 0.309
*Means with the same letter(s) are not significantly different from each other at 5% level of significance
2005; Adeleye et al., 2010; Hassan et al., 2010; Kisinyo et al., 2012 and Chimdi et al., 2012).
The increase in the soil pH as a result of the application of manure plus lime could be attributed to increase in soil exchangeable Mg2+ thus increasing its availability in the soil through mineralization of the manure and lime dissolution in the soil. Additionally, reduction of the soil pH reduced the Al3+ and H+ content in the soil thus enhancing the availability of the Mg2+ to the soil. These corroborate with the findings of Shen and Shen (2001); Rahman et al. (2002) and Escobar and Hue (2008) who reported similar findings on increase of soil available Mg on the application of lime combined with manure.
Soil exchangeable K increased with the application of ½ fertilizer + ½ manure, manure alone or with a combination of fertilizer and lime. This can be attributed to the addition of exchangeable cations by manure through decomposition process. The manure added during the experiment had 0.64% K that might contribute to the addition of significant amounts of K nutrients to the soil. When organic manure was applied alone or combined with fertilizer and lime increased soil available K was reported (Ayeni and Adetunji, 2010; Ewulo, 2005; Adeniyan et al., 2011; Adeleye et al., 2010).
neutralizes the H+ ions, thereby decreasing the activity and bioavailability of Mn toxicity in the soil (Padmavathiamma and Li, 2012). Ewulo (2005) in a study using 6 t ha-1 of cattle manure in Nigeria reported an increase in cations exchange capacity (CEC) of Mg, Ca and increased total soil P, K, and and decreased Mn. Similarly, Kheyrodin and Antoun (2012) reported that application of manure led to significant increase in Mg, Ca and K in the top soil.
4.2.3 Soil Available phosphorus
Table 4.4: Changes in soil available P (0-20 cm depth) in the different treatments during the 2016SR and the 2017LR seasons in Kirege
Available P (mg kg-1soil)
Treatments Baseline
(Sept 2016)
2016SR %
Change
2017LR %
Change Lime + ½ fertilizer + ½
manure
11.50a 26.00a 126.1 34.00a 195.7
Lime + fertilizer 14.00a 25.50a 82.1 33.50a 139.3
Fertilizer 11.00a 22.00a 100.0 30.00a 172.7
½ Manure + ½ fertilizer 10.50a 23.50a 123.8 31.50a 200.0
Lime + manure 13.50a 22.50a 66.7 30.5a 125.9
Manure 9.00a 21.00a 133.3 29.00a 222.2
Lime 12.00a 21.00a 75.0 23.00b 91.7
Control 11.00a 13.00b 18.2 12.00c 9.1
P-value 0.8581 0.0082 <.0001
LSD 6.686 6.686 6.686
*Means with the same letter(s) are not significantly different from each other at 5% level of significance
There were higher levels of P in the treatments containing the amendments (lime + fertilizer + manure, ½ manure + ½ fertilizer and lime + fertilizer) than in the control. Onwonga et al. (2008) reported higher levels of P in the treatments containing the amendments with lime and manure. This could be as a result of increased soil pH and P desorption following lime and manure application.
soil extractable P, and P availability in the soil solution. Kisinyo et al. (2012) reported a reduction in nutrient toxicities, corresponding to an increase in nutrient availability due to a conducive environment through the application of manure and lime.
4.3 Effects of lime, manure and P fertilizer on maize growth and yield
Table 4.5: Changes in plant height (cm) in the different treatments during the 2016SR and the 2017LR seasons in Kirege
2016SR season 2017LR season
Plant height (cm)
Treatment 4WAP 8WAP 12WAP 4WAP 8WAP 12WAP
Lime + ½ fertilizer + ½ manure
61.70a 176.60a 232.83a 95.50a 279.50a 296.13a Lime + fertilizer 63.50a 169.90ab 223.00a 90.50a 259.63a 276.38ab Fertilizer 61.30a 167.50ab 224.17a 88.88a 255.63ab 266.75ab ½ Manure + ½
fertilizer
56.80a 173.90ab 228.50a 107.25a 282.88a 272.50ab Lime + manure 41.80b 136.90ab 199.00ab 94.75a 259.75a 270.50ab Manure 41.10b 123.30c 189.00ab 81.25a 234.13ab 249.50b Lime 38.90b 112.70c 183.67ab 83.38a 210.88bc 246.00b Control 40.90b 134.50bc 167.67b 80.63a 203.13c 244.50b P-value 0.0001 0.0016 0.0388 0.4157 0.0025 0.1144
LSD 12.512 36.931 45.060 24.827 43.634 37.898
*Means with the same letter(s) are not significantly different from each other at 5% level of significance
There was no significant difference among the treatments in 2017LR during the 4WAP (p=0.4157) and 12WAP (p=0.1144). ½ manure + ½ fertilizer application had the highest height of 107.25 cm and 282.88 cm in the 4WAP and 8WAP, respectively. The plant height was significantly affected by the treatments in the 8WAP (p=0.0025). Application of lime + ½ fertilizer + ½ manure and lime + fertilizer had the highest height of 296.13 cm and 276.38 cm, respectively. The control treatment recorded the lowest height in the 4WAP, 8WAP, and 12WAP in 2017LR.
attributed to the lime solubility into the soil due to sufficient rainfall in the season, and also the activity of lime residues applied in short season.
Treatment with sole manure or combined with lime and fertilizer led to an increase in maize growth (Table 4.5). This can be attributed due to a combination of different nutrient sources from manure and fertilizer thus improved soil conditions and mineralization (Javaid and Mahmood, 2010; Umoetok et al., 2007). Manure acts as a reservoir for nutrients that through mineralization are released for plant uptake (Chiezey and Odunze, 2009). Manure in combination with P fertilizer leads to nutrient supply increase whereby in this study could have indirectly increased plant height through enhanced vegetative growth (Umoetok et al., 2007). Additionally, manure combined with lime and P fertilizer may have resulted to good performance as a result of increased availability of nutrients and improvement in soil conditions through application of manure, lime; and also addition of P fertilizer that is essential for initial root growth and enhanced nutrient uptake that improves crop development (Abbas et al., 2011).
units (Table 4.6). At the 12WAP in the 2016SR season, lime + fertilizer and ½ manure + ½ fertilizer treatments had the highest chlorophyll content of 36.50 SPAD units and 35.97 SPAD units, respectively although this was not significantly different (Table 4.6). Sole lime recorded the lowest chlorophyll content at 4WAP (32.36 SPAD units) and 8WAP (32.43 SPAD units). Control recorded the lowest chlorophyll at 12WAP (29.23 SPAD units) (Table 4.6).
Table 4.6: Changes in chlorophyll content ( SPAD units) in the different treatments during the 2016SR and the 2017LR seasons in Kirege
Chlorophyll –SR16 Chlorophyll -LR17
Treatment 4WAP 8WAP 12WAP 4 WAP 8WAP 12WAP
Lime + ½ fertilizer + ½ manure
41.62a 37.24ab 36.50a 45.16a 55.98a 52.11a Lime + fertilizer 39.92a 34.72abc 35.97a 42.96a 55.59a 51.91a Fertilizer 39.78a 38.59a 33.62a 43.50a 54.58a 53.13a ½ Manure + ½ fertilizer 39.70a 37.35ab 31.52a 47.16a 54.36a 48.56a Lime + manure 34.24b 33.80bc 29.45a 37.24b 47.21b 41.13b Manure 33.55b 32.86bc 33.22a 37.43b 43.70bc 38.98b
Lime 32.36b 32.43c 29.70a 37.16b 40.09c 39.18b
Control 33.13b 32.60c 29.23a 38.05b 39.83c 38.25b
P-value 0.0001 0.0124 0.277 0.0001 0.0001 0.0001
LSD 3.968 4.123 7.254 4.223 4.959 6.393
*Means with the same letter(s) are not significantly different from each other at 5% level of significance
recording the lowest with 39.83 SPAD units and 38.25SPAD units, respectively in 8WAP and 12 WAP in 2017LR.
In all the treatments with fertilizer or combined with manure, high chlorophyll content was recorded with control treatment recording the lowest. Yang et al. (2003) reported that the interaction of inorganic and organic amendments led to an increase in the chlorophyll contents of plants. The chlorophyll content in plant leaf tissue is influenced by nutrient availability and environmental stresses such as salinity, drought, heat and cold (Alam et al., 2017). Manure being a store of nutrients released through mineralization enhances plant growth (Chiezey and Odunze, 2009). Combination with P fertilizers increases supply of nutrients which increased vegetative growth through improved chlorophyll content and indirectly affecting the plant height (Umoetok et al., 2007). Increase in nitrogen and phosphorus increases plant chlorophyll content and subsequently photosynthetic rate.
High chlorophyll content enhances photosynthesis process and influences the physiological growth of a healthy nutritional plant. The amount and availability of phosphorus highly affects leaf growth due to increased chlorophyll enhancing photosynthesis. Maize efficient P utilization affects the nitrogen use efficiency (Zaman-Allah et al., 2015), consequently, it affects crop anatomical, physiological, morphological and growth and development. Additionally, Sim et al. (2015) indicated that the highest physiological growth indices are attained with high plant nutrition since the amount of chlorophyll content improves photosynthesis.
4.4 Effects of manure, lime and P fertilizer on dry matter and grain yield
The stover yield during 2016SR and 2017LR was significantly affected by treatments p=0.0001 and p=0.0439, respectively. The application of lime + ½ fertilizer + ½ manure had the highest stover yield in 2016SR (3.0 t/ha) followed by lime + fertilizer treatment (2.8 t/ha). In the 2017LR, the highest stover yield was 11.20 t/ha where lime and fertilizer were applied together (combined). The control treatment had the lowest yield in 2016SR and 2017LR of 0.810 t/ha and 5.871 t/ha, respectively (Table 4.7).
Table 4.7: Stover yields (t ha–1) in the different treatments during the 2016SR and the 2017LR seasons and maize yields (t ha–1) in the different treatments during 2017LR seasons in Kirege
Stover yield (t/ha) Grain yield (t/ha)
Treatment 2016SR 2017LR 2017LR
Lime + ½ fertilizer + ½ manure
3.0a 11.2a 5.1a
Lime + fertilizer 2.8a 10.6ab 5.0a
Fertilizer 2.4ab 8.9abc 4.0a
½ Manure + ½ fertilizer 2.7ab 8.3abc 3.8ab
Lime + manure 1.5abc 8.2abc 2.5bc
Manure 1.3bc 6.6bc 2.2c
Lime 0.8c 6.5bc 1.8c
Control 0.8c 5.9c 1.5c
p-value <.0001 0.0439 <.0001
LSD 1.354 3.724 1.354
*Means with the same letter(s) are not significantly different from each other at 5% level of significance
The results showed that combination of lime, manure and mineral fertilizers improved crop yield in comparison to the sole mineral fertilizers, sole lime, and sole manure. Similarly, Nyamangara et al. (2003) and Mtambanengwe et al. (2006) noted an increase in crop yield with manure and P fertilizers compared to the sole application of P fertilizer and manure. The increase could be explained by the fertilizer that supplies readily available plant nutrients from an early stage of crop growth thus promoting sufficient water and nutrient uptake. There results corroborates those of Nziguheba et al. (2000); Kimetu et al. (2004); Mucheru-Muna et al. (2007) and Mugwe et al. (2009), who similarly observed increased maize yields attributed to application of organic manure in combination with mineral fertilizer compared to sole organic manure application and mineral fertilizers.
chemical/mineral fertilizer thus achieving a positive rise in recorded grain yield. Integration of inorganic and organic inputs integration increased yields due to supply of nitrogen and phosphorus (Mugwe et al., 2009). Most nutrients become more available at higher soil pH and consequently lead to increased dry matter and grain yields (Fageria and Beligar, 2008). This could be due to nutrients present in manure that supply essential nutrients to the soil e.g. N, P and K that are vital for maize growth.
Intergrated use of organic and inorganic nutrient sources provides more balanced nutrient supply and other numerous agro-ecological benefits such as increase in soil microbial activity (Giller et al., 2006). Moreover the intergration increases fertilizer use efficiency hence can be considered as better options. Combination of organic and mineral fertilizer nutrient sources has shown to improve synchronization of nutrient release, synergistic effects and uptake by crops (Mucheru-Muna et al., 2007 ) resulting to higher yields, particularly in a case where relatively low levels of mineral fertilizers are used by most smallholder farmers in tropical farming systems. Fertilizer use leads to increase in crop residues for soil fertility management and increase crop yields, while organic sources are able to restore less responsive soils and make them responsive to fertilizers (Mucheru-Muna et al., 2014;Vanlauwe et al., 2010).
4.5 Effects of manure, lime and P fertilizer on profitability
return to labour (-1.7) was recorded in control while lime plus manure treatment gave the lowest return to labour (-8.1) (Table 4.8). In 2017LR, however, net benefit as well as losses were realized and differed significantly among the treatments (P= 0.0006). Application of lime plus fertilizer had the highest net benefit of 128.75 USD/ha followed by sole fertilizer (105.94 USD/ha). Application of manure had the highest net loss (-186.20 USD/ha) while lime plus manure recorded (-108.01 USD /ha) (Table 4.8). The net loss may be as a result of high cost of inputs and labour employed in the application of the lime and manure. Benefit-cost ratio (BCR) was highest (0.67) in control followed by 0.34 under sole fertilizer while lime combined with manure had the lowest (-0.34) BCR. The highest return to labour was on lime and fertilizer treatment (3.78) followed by sole fertilizer (3.25) while lime plus manure treatment s recorded the lowest (-1.54) (Table 4.8).
Table 4.8: Profitability of maize under different treatments during the 2016SR and the 2017LR seasons in Kirege
2016SR 2017LR
Treatment Net Benefit
Benefit-Cost Ratio
Return to Labour
Net Benefit Benefit-Cost Ratio
Return to Labour Lime + ½
fertilizer + ½ manure
-339.98e 0.79ab -5.7e 48.38ab 0.10bcd 2.3abc
Lime + fertilizer
-287.77d 0.77ab -4.9d 128.75a 0.30ab 3.8a
Fertilizer -170.60b -0.68a -3.0b 105.94a 0.34ab 3.3ab
½ Manure + ½ fertilizer
-228.16c 0.76ab -4.1c 60.70a 0.18bc 2.4abc
Lime + manure
-434.21f -0.91b -8.1f -108.01bc -0.34d -1.5d
Manure -319.33de -0.89b -6.2e -186.20c -0.23cd -0.6cd
Lime -213.75c -0.90b -3.9c -33.89abc -0.12bcd 0.5bcd
Control -88.05a 0.78ab -1.7a 96.10a 0.67a 1.6abc
p-value <.0001 0.1471 <.0001 0.0006 0.0006 0.0042
LSD -42.25 0.1806 -0.799 150.99 0.446 2.82
In this study, the net benefit under combined application of lime and fertilizer was higher compared to separate applications and the control. Manpreet and Dixit (2017) recorded higher net returns in fertilizer application with lime compared to rest of the treatments. The net benefit in long rains was positive in most treatments (Tables 4.8) this shows that most treatments recorded extra yield that was adequate to offset the labor and non-labor costs of production. However, on average, the net benefit, benefit-cost ratio and return to labor were lower during the short rains compared to the long rains season (Table 4.8). This could be as a result of the meteorological drought experienced during 2016SR (Figure 3.2) which adversely affected the maize yield. Buah et al. (2017) reported similar season specific responses of net benefits on adverse seasonal change. The smallholder farmers are inherently the most susceptible to the negative impacts of climate variability, as it is aggravated by diminishing soil productivity (Khan and Akhtar, 2015).
CHAPTER FIVE
SUMMARY, CONCLUSIONS AND RECOMMENDATIONS 5.1 Summary
During the two seasons under study application of 2 t ha-1 lime plus 10 t ha-1 manure recorded the highest increasein soil pH during 2016SR (4.61 to 5.21) while in 2017 LR, sole lime had the highest increase from 4.51 to 5.28.. This is an increase of 13.02% and 17.07%, respectively over the initial soil pH. This was closely followed by 2 t ha-1 lime with 5 t ha-1 of manure plus 30 kg P2O5 ha-1 as P fertilizer with 15.3%
reduction in soil pH in 2017LR. In comparison with treatment with sole fertilizer, lime and manure treatments had the highest reduction in soil exchangeable acidity.
The influence of the treatments on maize height, chlorophyll content, stover and grain yield was consistent. Application of 2 t ha-1 lime with 5 t ha-1 of manure plus 30 kg P2O5 ha-1 had the tallest plants of 232.83 cm and 296.13 cm in 2016SR and 2017LR,
respectively. Similarly, this treatment recorded the highest chlorophyll content of 53.13 SPAD units followed by lime combined with fertilizer by 52.11 SPAD . The highest stover and grain yield was attained with application of combined lime, manure plus fertiliser.
5.2 Conclusions
Treatments with lime and manure, sole or combined had a significant increase in soil pH which increased the availability of soil nutrients. Application of combined lime, manure and fertilizer lime had the highest stover and grain yield compared to those with sole manure, fertilizer, or lime. This is demonstrating the superiority of integrated soil fertility management in yield improvement. This indicates that liming is an effective method of ameliorating soil acidity and offers a better option for increasing maize yields in degraded soils of central highlands of Kenya. Economic returns were significantly affected by interaction of lime, manure and P fertilizer where treatment applied with fertilizer had more benefit compared to those with no fertilizer.
5.3 Recommendations
Based on the findings the following recommendations were derived:
For improved soil chemical properties and increased maize yields, smallholder
farmers should adopt integrated application of manure with lime and P fertilizer.
Farmers need to consider economic returns when selecting agricultural
production technologies to use.
5.4 Areas of further research
A long-term study needs to be considered using other types of lime (Calcium
Further research should be conducted to explore more rates of lime, different
types of lime and their effects in long-term to determine the optimum liming level of different types of lime for acid soils.
Further research to assess the economic return in the long-term use of lime,
REFERENCES
Abbas, G., Abbas, Z., Aslam, M., Malik, A. U., Ishaque, M. and Hussain, F. (2011). Effects of organic and inorganic fertilizers on Mungbean (Vigna radiata L.) yield under arid climate. International Research Journal of Plant Science, 2 (4): 094-098.
Adeleye, E. O., Ayeni, L. S and Ojeniyi, S. O. (2010). Effect of poultry manure on soil physico-chemical properties, leaf nutrient contents and yield of Yam (Dioscorea rotundata) on Alfisol in Southwestern Nigeria. Journal of American Science, 6 (10):871-878.
Ademba, J. S., Esilaba, A. O. and Ngari, S. M. (2010). Evaluation of organic and inorganic amendments on nutrient uptake, phosphorus use efficiency and yield of maize in Kisii region. In L. A. Wasilwa, J. Ouda, I. W. Kariuki, N. S. Mangale and M. N. Lukuyu (Eds). Transforming Agriculture for Improved Livelihoods through Agricultural Product Value Chain. Proceedings of the 12th KARI Biennial Scientific Conference. November 8-12, 2010. Nairobi-Kenya.
Adeniyan, O. N., Ojo, A. O., Akinbode, O. A. and Adediran, J. A. (2011). Comparative study of different organic manures and NPK fertilizer for improvement of soil chemical properties and dry matter yield of maize in two different soils. Journal of Soil Scienceand Environmental Management, 2 (1): 9-13.
Adiel, R. K. (2004). Assessment of on-farm adoption potential of nutrient management strategies in Chuka division, Meru South, Kenya. M.Sc Thesis, University of Kenyatta, Kenya.
Akinrinade, E. A., Iroh I., Obigbesan, G. O., Hilger T., Romheld, V. and Neumann, G. (2006). The response of cowpea varieties to phosphorus supply on an acidic alumi-haplic-Acrisol from Brazil. Nigerian Journey of Soil Science, 16: 115-120.
Alam, R., Das, D. K., Islam, M. R., Murata, Y. and Hoque, M. A. (2017). Exogenous proline enhances nutrient uptake and confers tolerance to salt stress in maize (Zea mays L.). Progressive Agriculture, 27(4), 409-417.
Anetor, M. O. and Akinrinde, E. A. (2006). Response of Soybean [Glycine max (L.) Merrill] to lime and phosphorus fertilizer treatments on an acidic Alfisol of Nigeria. PakistanJournal of Nutrition, 5 (3): 286-293.
Athanase, N. (2013). “Effects of Different Limes on Soil Properties and Yield of Irish Potatoes (Solanum Tuberosum. L) in Burera District, Rwanda.” M.Sc Thesis, University of Kenyatta, Kenya.
Awodun, M. A., Omonijo, L. I. and Ojeniyi, S. O. (2007). Effects of goat dung and NPK fertilizer on soil and leaf nutrient content, growth, and yield of pepper. InternationalJournal of Soil Science, 2 (2): 142-127.
Ayeni, L. S and Adetunji, M. T. (2010). Integrated application of poultry manure and mineral fertilizer on soil chemical properties, nutrient uptake, yield and growth components of maize. Nature and Science, 8 (1): 60 – 67.
Bhatta, G. D., and Doppler, W. (2016). Smallholder peri-urban organic farming in Nepal: A comparative analysis of farming systems. Journal of Agriculture, Food Systems, and Community Development, 1(3), 163-180.
Blackwell, P., Riethmuller, G., and Collins, M. (2009). Biochar application to soil. Biochar for environmental management: science and technology, 1, 207-226.
Bolan, N. S and Hedley, M. J. (2003). Role of carbon, nitrogen and sulfur cycles in soil acidification. In D. Marcel, In"Handbook of soil acidity" (pp. 29-56). New York: Rengel. Z.
Bolan, N. S., Adriano, D. C. and Curtin, D. (2003). Soil acidification and liming interactions with nutrient and heavy metal transformationand bioavailability. Advances in Agronomy, 78, 215-272.
Brown, T. T., Koenig, R. T., Huggins, D. R., Harsh, J. B. and Rossi, R. E. (2008). Lime effects on soil acidity, crop yield, and aluminum chemistry in direct-seeded cropping systems. Soil Science Society of America Journal, 72(3), 634-640.
Buah, S. S., Ibrahim, H., Derigubah, M., Kuzie, M., Segtaa, J. V., Bayala, J. and Ouedraogo, M. (2017). Tillage and fertilizer effect on maize and soybean yields in the Guinea savanna zone of Ghana. Agriculture and Food Security, 6(1), 17.
Buni, A. (2014). Effects of Liming Acidic Soils on Improving Soil Properties and Yield of Haricot Bean. Journal Environ Anal Toxicol 5:248.
Busari, M., Salako, F. and Adetunji, M. (2008). Soil chemical properties and maize yield after application of organic and inorganic amendments to an acidic soil in Southwestern Nigeria. Spanish Journal of Agricultural Research, 6 (4), 691. Caires, E. F., Churka, S., Garbuio, F. J., Ferrari, R. A. and Morgano, M. A. (2006).