© 2018, IJCSMC All Rights Reserved
8
International Journal of Computer Science and Mobile Computing
A Monthly Journal of Computer Science and Information Technology
ISSN 2320–088X
IMPACT FACTOR: 6.017
IJCSMC, Vol. 7, Issue. 8, August 2018, pg.8 – 23
Evaluation of mLearning
Usability by Farmers: Case Study
of Haller Farmers Application
Godfrey K. Cheboi
1, Amos N. Gichamba
2, Collins O. Oduor
3¹Department of Computer and Information Technology, Africa Nazarene University, Kenya ²Department of Computer and Information Technology, Africa Nazarene University, Kenya ³Department of Computer and Information Technology, Africa Nazarene University, Kenya
1
[email protected]; 2 [email protected]; 3 [email protected]
Abstract— Agricultural extension is responsible for teaching farmers about better agricultural practices. However, it is faced with challenges such as few extension officers. While mobile devices have been used to address this challenge through mobile learning (mLearning), there are reported cases of low adoption of mobile services by farmers due to usability issues. This study used Haller Farmers application as a case study to establish how usability of mLearning application aimed at supporting agricultural extension can be improved. The first and second objectives were to establish how farmers rate the user interface usability and pedagogical usability of Haller Farmers respectively, while the third objective was to recommend suggestions for improving usability of the application. Snowball sampling was used to sample 32 farmers from Kapsoya ward of Uasin – Gishu County. The farmers rated the usability of the application based on 10 criteria that were selected from literature. Quantitative data was collected using close-ended questions of the questionnaires, and qualitative data through open-ended questions and the Think Aloud protocol. Quantitative data was descriptively analyzed using Statistical Packages for Social Sciences (SPSS) version 24 and while qualitative data was analyzed using content analysis technique and analysis of the remarks made during the Think Aloud protocol. Triangulation of quantitative and qualitative data was done in order to provide a more understanding of how respondents rated the application’s usability. The mean response value for user interface usability was found to be +1 on a +2 to -2 scale, meaning respondents agreed that the user interface was usable, while the mean response value for pedagogical usability was found to be +0.30, implying respondents had a neutral opinion about the pedagogical usability of the application. All the criteria for assessing user interface usability had a mean response value greater than +1.0 except for the visibility of system status and multimedia criteria. In relation to pedagogical usability, only two criteria: authenticity and relevance of learning content, and structure of learning content had a mean response value greater than +1. Additionally, non-parametric Chi-square hypothesis testing was used to determine whether the responses to the close-ended statements were significantly positive, negative or neutral. Suggestions on what can be done to improve the criteria that had mean scores of less than +1 were recommended. These suggestions can be beneficial not only to developers of Haller Farmers application, but also to other mobile application developers and institutions responsible for agricultural extension.
© 2018, IJCSMC All Rights Reserved
9
I. INTRODUCTION
Agriculture forms the backbone of many developing economies, employing majority of the citizens and providing a source of income and food security to many families [1]. However, agricultural production in developing countries has been low partly due to poor agricultural practices and management skills [2], [3]. To improve agricultural production and generate sustainable income for farmers, farmers need to be exposed to information on market oriented strategies and better production techniques [4]. This can be achieved through agricultural extension – a process responsible for creating awareness on better farming methods among the farming community and elevating farmers‟ standards of living through education [5]. However, agricultural extension is faced with challenges such as few extension officers compared to the number farmers [1].
However, there has been an increase in the number of mobile phones and internet use in developing nations. According to the International Telecommunication Union (ITU), developing countries have experienced high growth rates in mobile-broadband subscriptions compared to developed countries. [6]. In Kenya where the population is about 48.46 million, mobile subscriptions were at an all-time high of 42.8 million and mobile data accounts for approximately 99% of the to 33.3 million internet subscriptions [7]. These statistics capture the potential of using mobile phones and internet services to disseminate information to farmers. In fact, a quick search on Google play store shows the existence of applications such as indigenous KALRO chicken, Crop life, e-hinga, Kilimo bora and Haller farmers, which are designed to educate farmers about better farming practices. Mobile phones can support farmer education through mobile learning (mLearning) [8], which [9], defines as, “any sort of learning that happens when the learner is not at a fixed, predetermined location or learning that happens when the learner takes advantage of the learning opportunities offered by mobile technologies”.
Substantial studies have been done to investigate how mLearning might be used to address the challenges that face agricultural extension. Examples of approaches that have been employed include, use of SMS based twitter messaging [10], Interactive Voice Response [11], calling to make enquiries about agricultural issues [12] and the use of smartphone applications [13]. However, while [14] argue that mobile applications meant for farmers should have a user-friendly design, research also indicates that there has been low adoption of mobile applications by farmers partly because the applications are not user friendly [15].
Usability refers to the ability of a software to be comprehended, used and good-looking to the user, while used in specified context [16]. It can also be understood as the ease of use or user friendliness of an application, or methods of increasing the ease of use while designing an application [17]. Usability is a critical quality attribute that determines the success or failure of an application [18], [19]. Any application that fails a usability evaluation may record low levels of acceptance from potential users [20]. To design mobile applications characterized by sound usability, mobile applications should undergo usability evaluation and subsequent refinement. For effective learning to occur, a learning application should be usable pedagogically and in terms of its user interface. Usability assessment ought to be understood differently in the context of mLearning [21].
A good number of research about mLearning usability design and evaluation has been done in formal learning contexts such as universities, resulting in a number guidelines and criteria for mLearning design and evaluation. However, there is little empirical evidence of the same in non-formal contexts such as agricultural extension. Therefore, usability design and evaluation of mLearning within the agricultural extension context provides an opportunity to apply the guidelines and criteria from exemplary studies about mLearning usability to mobile assisted agricultural extension. The purpose of this study therefore, was to establish how usability of Haller Farmers app, a mLearning application aimed at supporting agricultural extension could be improved. The following were the objectives of the study:
(i) To establish how farmers, rate the user interface usability of Haller Farmers application. (ii) To establish how farmers, rate the pedagogical usability of Haller Farmers application. (iii)To recommend suggestions for improving the usability of Haller Farmers application.
II. LITERATURE REVIEW
A. Introduction
1) Agricultural Extension: Agricultural Extension is a process responsible for creating awareness on better farming methods among the farming community and improving farmers‟ standards of living through education [5]. It is aimed at educating farmers about improved agricultural practices [22] and bringing positive change on farms and agriculture at large through processes that involve learning and change [23]. Through extension services, farmers can increase their knowledge about a specific problem, thus improving the kind of decisions they make [24].
© 2018, IJCSMC All Rights Reserved
10
assessments [27]. Reference [28], refers non-formal learning to a structured sequence of learning experience, undertaken outside the formal system but is usually part of a programme offered by government services, training services or non-profit organizations. According to [29], non-formal learning is “present-time focused, responsive to localized needs, learner-centered, less structured (than formal learning) and has an assumed non-hierarchical relationship between the learner and facilitator”. The kind of pedagogy employed in non-formal learning should not majorly rely on text or words, but rather on more visually oriented formats [28].In most developing countries, agricultural extension is delivered through the conventional extension system whereby extension workers travel to farms in order to educate farmers about better agricultural practices [30], [31]. However, this system is faced with challenges such as, poor infrastructure and lack of enough resources making it difficult and expensive for extension agents to access remote areas, provision of one-time information to farmers (which limit the information‟s long-term effect), and few extension agents compared to the number of farmers [1], [30], [31]. Moreover, farmers are constrained by time and finances, and find it difficult to attend the extension classes or demonstrations since such demonstrations interfere with their day-to-day activities [31]. However, as indicated in the introduction section, there has been an increase in the number of mobile phones and internet use in developing countries, leading to the emergence of mobile applications e.g. indigenous KALRO chicken, Crop life and Haller farmers, which are designed to educate farmers about better farming practices. Such applications can address the challenges facing agricultural extension through mobile learning (mLearning).
2) Mobile Learning (mLearning): Reference [9] defines mobile learning (mLearning) as “any sort of learning that happens when the learner is not at a fixed, predetermined location or learning that happens when the learner takes advantage of the learning opportunities offered by mobile technologies”. Reference [32] states that the main characteristic of mLearning is, the capability to deliver learning that is “just in time, just enough, and just for me”. Mobility is main characteristic of mLearning that permits learning to happen anywhere, anytime thus breaking the time and space barriers. Mobile learners can choose the time, place and pace, of studying. This makes mLearning learner-centered and if well designed it can meet the learners‟ needs. Additionally, Learners can achieve better learning results through cooperative, collaborative, and interactive learning [33]. Through mLearning, farmers can learn anywhere at their own convenient time, and they can repeat the lessons as many times as they wish.
Research has been done to investigate how mLearnng agricultural extension. For example, [10] investigated how collaborations between agricultural instructors and farmers could be facilitated using mobile phones. They designed a mobile-based guided learning system to supplement the traditional non-formal method of educating farmers. Their system used features and functionalities of twitter such as tweets, direct messages and re-tweets. Tweets were used to post lessons and announcements, twitter direct messages were used to give direct feedback to farmers while re-tweets were used to share interesting answers and resources posted by farmers. Likewise, the department of Agricultural Economics and Extension at the University of Ruhuna, Sri Lanka, in collaboration with a mobile phone company, Mobitel, implemented a programme called „Lifelong Learning for Farmers‟ aimed at educating farmers about mushroom cultivation [11] which used an Interactive Voice Response (IVR) system to distribute information to farmers. The system was made up of two-minute technical messages on mushroom cultivation that were made available to farmers on the weekdays and assessments were done at the end of the week. Other examples include, Sanga and his colleagues who designed an internet based Farmers Advisory Information System (FAIS) [8], [34] who built different learning objects in the form of text, pictures, audio, videos, and simple games and delivered them to farmers using mobile phones, and [31] who proposed an e-farming framework to complement the extension services in Nigeria.
B. Theoretical Review of Literature
© 2018, IJCSMC All Rights Reserved
11
2) Human Computer Interaction and Usability: Human Computer Interaction (HCI) is the study of interaction between users and computing systems. HCI deals with the study of circumstances involving human beings and technology, design practices along with the tools and methods used [37]. It is a field of study that deals with the design, assessment and application of interactive computer applications, together with the study of the main phenomena involving users and the computer systems [38]. HCI aims at allowing users to satisfactorily complete tasks while using a computer system by making the systems easy to learn and use [39]. Researchers have emphasized the importance of HCI by indicating that users do not see the programming codes of an application but its interface, which highly effects the failure or success of an application. The user interface should match the users‟ needs and requirements. Otherwise, if it is inflexible, dull and complex, users will not be able to use the application [38].
HCI involves the study of usability. According to [40], usability is “the extent to which a product can be used by specified users to achieve specified goals with effectiveness, efficiency and satisfaction in a specified context of use”. ISO/IEC 9126-1 defines usability as the capability of the software product to be understood, learned, used and be attractive to the user under specified conditions. Reference [41] argues that usability is an important feature of software design that determines the success or failure of the software. Usability of software is determined by the extent to which usability attributes are satisfied while using the software. According to the [16], usability is defined as a software quality feature that is composed of five attributes namely: understandability, learnability, operability, attractiveness and usability compliance. Reference [40] measures usability using three attributes: Efficiency, Effectiveness and Satisfaction. It further explains that when evaluating usability, it is important to consider the user (person who interacts with the product), the intended outcome (goal) and context of use.
The notion of usability was initially developed within the discipline of Human Computer Interaction, focusing on the interaction between the user and a computer system. Mobile Human Computer Interaction (MHCI) focuses on interaction between users and mobile devices for example smartphones and tablets [42]. Usage of mobile devices is different from that of computers. While computer use is restricted to a fixed place, use of mobile devices is characterized by physical movements [43]. Additionally, mobile devices are mostly used in different contexts probably while the user is performing other tasks [44]. Mobile devices have small screen sizes which limit the amount of information to be displayed, information may appear cluttered if a desktop application interface is to be scaled to a mobile application interface thus affect users‟ recognition [45]. Moreover, they have a lower display resolution compared to desktop computers resulting in lower quality images, which may not be obvious to users, therefore, affect the quality of the content [46]. They are characterized by limited processing capability and slow connectivity, which may affect applications that need internet connection [18], [44]. Ignorance of these unique aspects while designing mobile applications may lead to poor usability. Reference [37] state that even though interactivity in a mobile context is complex, it can be simplified by reducing the barriers. They suggest that MHCI can support and enable mLearning by offering affordances to teaching and learning interaction. mLearning interaction is underpinned by the requirements of pedagogy and the attributes and affordances of the technology to realize and support the aims of the user [37].
C. Empirical Review of Literature
© 2018, IJCSMC All Rights Reserved
12
Reference [51] argues that current frameworks for evaluating/designing mLearning applications ignore a number of vital criteria or produce misleading usability defects. Consequently, he proposed a framework made up of three categories namely context of use, user interface and pedagogical usability as displayed in Fig. 2. The three categories were further broken down into subgroups and measures that can help in usability design and evaluation of mlearning applications.Fig. 2 The proposed mLearning framework by [51]
1) User Interface usability: User Interface usability is concerned with the user interface of a learning application. A learning application whose user interface is difficult to learn and remember in terms of how to use, can prevent learners from being efficient and effective because it will force them to focus on learning how to use the application instead of the learning goals [52]. The user interface of a learning application should be free of distractions such as confusing menus, icons and illogical links, in order to enable learners, concentrate on the learning materials [53]. Most of the criteria for evaluating user interface usability originate from Nielsen‟s classic usability heuristics. However, researchers have proposed various modifications to the classical heuristics in order to suit them for mLearning environments.
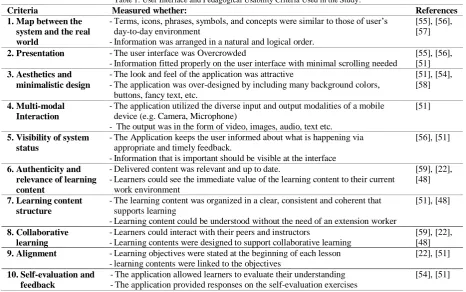
1) Pedagogical usability: This category of criteria focuses on how lessons can be delivered through mobile devices. Pedagogical usability is the analysis of the way an educational application (tools, content, tasks and interface) support students during the learning process based on the learning objectives [48]. [54] refer to pedagogical usability as educational usability stating that it stresses on learning-specific use and the relationship between the content and objectives, learning processes and outcomes. This research focused on a selection of user interface (number 1-5) and pedagogical (numbered 6-10) usability criteria as summarized in Table 1.
© 2018, IJCSMC All Rights Reserved
13
Table 1. User Interface and Pedagogical Usability Criteria Used in the Study.
Criteria Measured whether: References
1.Map between the system and the real world
-Terms, icons, phrases, symbols, and concepts were similar to those of user‟s day-to-day environment
-Information was arranged in a natural and logical order.
[55], [56], [57]
2.Presentation -The user interface was Overcrowded
-Information fitted properly on the user interface with minimal scrolling needed
[55], [56], [51] 3.Aesthetics and
minimalistic design
-The look and feel of the application was attractive
-The application was over-designed by including many background colors, buttons, fancy text, etc.
[51], [54], [58]
4.Multi-modal Interaction
-The application utilized the diverse input and output modalities of a mobile device (e.g. Camera, Microphone)
- The output was in the form of video, images, audio, text etc.
[51]
5.Visibility of system status
-The Application keeps the user informed about what is happening via appropriate and timely feedback.
-Information that is important should be visible at the interface
[56], [51]
6.Authenticity and relevance of learning content
-Delivered content was relevant and up to date.
-Learners could see the immediate value of the learning content to their current work environment
[59], [22], [48]
7.Learning content structure
-The learning content was organized in a clear, consistent and coherent that supports learning
-Learning content could be understood without the need of an extension worker
[51], [48]
8.Collaborative learning
-Learners could interact with their peers and instructors
-Learning contents were designed to support collaborative learning
[59], [22], [48] 9.Alignment -Learning objectives were stated at the beginning of each lesson
-learning contents were linked to the objectives
[22], [51]
10.Self-evaluation and feedback
-The application allowed learners to evaluate their understanding -The application provided responses on the self-evaluation exercises
[54], [51]
III.METHODOLOGY
A. Research Design
This study utilized case study research design. According to [60], a case study is an in-depth study of a particular research problem, which is often used to narrow down a broad field of research into one, easily researchable example. In the context of this study the researcher narrowed down the broad research field of mLearning usability evaluation by focusing on one application: Haller Farmers application.
B. Usability Evaluation Methods
To conduct a usability evaluation, a researcher needs an evaluation method and evaluation criteria. There are several methods of performing usability evaluation. Reference [53] highlights three methods: Heuristic, Subjective and Empirical. The researcher decided that the first and second research objectives could be best addressed through the subjective method, where users‟ opinions were gathered using questionnaires. 32 farmers from Kapsoya ward of Uasin-Gishu county, Kenya, were sampled using snowball sampling and asked to download the application from Google playstore and interact with it for a period of three weeks. Afterwards a questionnaire (Appendix A) was used to capture their opinion about the usability of the app, based on the selected criteria.
Additionally, in order to identify more usability issues, the researcher also used an empirical method, the Think Aloud method to capture user actions, through observations. During the Think Aloud protocol, the researcher asked 10 research participants to perform 5 tasks (Appendix B) and to verbalize their thoughts while performing the tasks, as suggested by [61]. The researcher noted down what he observed as individual participants performed the tasks. This allowed the researcher to establish how the participants “viewed” the system and spot problematic areas of the user interface (e.g. where participants got stuck) or areas where users had misconceptions (e.g. thought a button would lead to a different page than it did).
C. Reliability and Validity of Research Instrument
© 2018, IJCSMC All Rights Reserved
14
D. Data Processing and Analysis
Statistical Package for Social Science (SPSS) version 24 and Microsoft Excel 2016 were used to descriptively analyze data collected through the close ended questions of the questionnaire. Specifically, Microsoft Excel 2016 was used during Content analysis to code responses from the open ended questions. On the other hand, SPSS was used to determine how strongly positive or negative the mean response values to each statement and criteria were. To this end, each response was assigned a value between -2 and +2 as indicated in the following scale: -2 = Strongly Disagree, -1= Disagree, 0 = Neutral, 1 = Agree, 2 = Strongly Agree. This implied that a positive mean response corresponded to an agreement, while a negative mean reponse corresponded to a disagreement. The mean response value for a particular statement was calculated by adding all the responses to the statement and dividing by 32 (the number of respondents). The mean response value for a particular criteria was obtained by averaging the responses from statements measuring the criteria. For example, mean response of the authenticity criteria was calculated by averaging responses to statements 6.1 and 6.2 (of the quetionnaire). In a similar manner, the mean response value for user interface usability and pedagogical usability were calculated by averaging the mean responses for their respective criteria. Additionally, where applicable, non-parametric chi-square testing was used to determine whether the number of responses to a statement were significantly positive, negative or neutral.
For qualitative data it is advisable to involve another person during analysis in order to minimize the subjective biasness [63]. The author used Content analysis technique, and involved a second investigator during the analysis of the qualitative data collected through the open ended questions, and followed the five steps of performing content analysis as described in [64] web page. From the Think Aloud protocol, the body language and the remarks of the participants were observed and recorded as they performed tasks. This formed the basis for the analysis of the system from an observation point of view.
IV.RESULTS AND ANALYSIS
1) Qualitative data
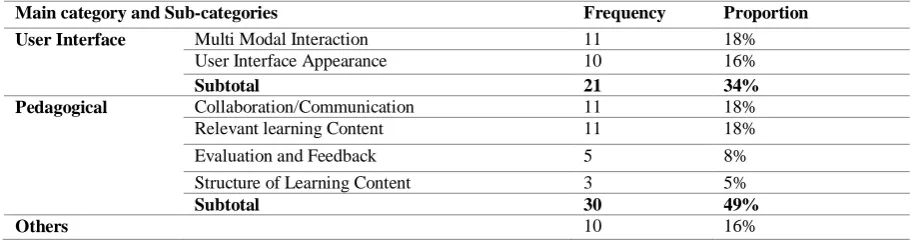
Table 2. Percentages of Suggestions Related to User Interface and Pedagogical Usability
Main category and Sub-categories Frequency Proportion User Interface Multi Modal Interaction 11 18%
User Interface Appearance 10 16%
Subtotal 21 34%
Pedagogical Collaboration/Communication 11 18%
Relevant learning Content 11 18%
Evaluation and Feedback 5 8%
Structure of Learning Content 3 5%
Subtotal 30 49%
Others 10 16%
Table 2 shows the results of content analysis. From the table, 34% of the suggestions proposed through the open ended questions of the questionnaire were related to improving the user interface of the application. Specifically, 18% concerned multimodal interaction while and 16% concerned appearance of the user interface. Moreover, 49% of the suggestions proposed were related to improving the pedagogical usability, with 18% concerned collaboration and communication, 18% relevance of learning content, 5% structure of learning content while 8% were concerned with evaluation and feedback.
From the Think Aloud protocol the following were observations made: Task 1
• All the participants easily launched the application and selected a language.
• It was also noted that participants touched the two speaker icons but nothing happened. Task 2
• All the participants were able to select the soil and agrichar options. They also identified and touched the speaker icon to listen to the content, but some of the respondents were surprised that the application could “talk”.
• Most of the respondents were able to move to the next page using the application‟s arrow keys but some of them tried to “swipe”.
Task 3
• Participants could not easily locate the application‟s back icon but after reading the instructions again, they moved to the top of the page and identified it.
© 2018, IJCSMC All Rights Reserved
15
Task 4• All the participants successfully opened the notice board and scrolled to see what people had posted. • They were able to identify the Haller team that was selling honey, as indicated in the task list. They
successfully attempted to call the team by touching the call button.
• most of the participants did not expect the message icon to represent an email, but rather an SMS.
• Some participants could not easily locate the icon for composing a message, not until they reread the instructions.
Task 5
• Most users exited the application through the device‟s back button while others used the home button.
2) Quantitative Data
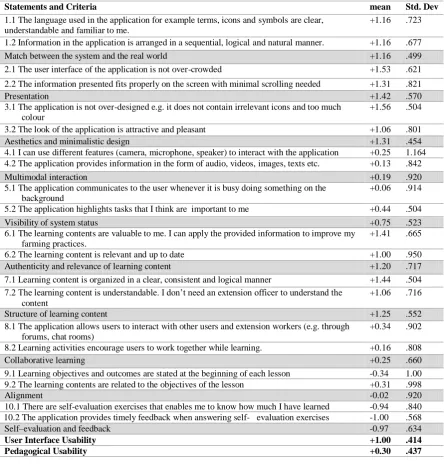
Each criterion for evaluating user interface and pedagogical usability was measured using two statements. For example, Match between the system and the real world was computed as the average of statements 1.1 and 1.2, presentation as the average of statements 2.1 and 2.2, structure of learning content as the average of statements 7.1 and 7.2 e.t.c. Additionally, the suggestions made on the open ended questions and observations made during the Think Aloud protocol were used during analysis. Table 3 shows the mean responses for the usability criteria and their respective statements.
Table 3. Mean Responses for Evaluation Statements and Usability Criteria
Statements and Criteria mean Std. Dev
1.1 The language used in the application for example terms, icons and symbols are clear, understandable and familiar to me.
+1.16 .723
1.2 Information in the application is arranged in a sequential, logical and natural manner. +1.16 .677
Match between the system and the real world +1.16 .499
2.1 The user interface of the application is not over-crowded +1.53 .621
2.2 The information presented fits properly on the screen with minimal scrolling needed +1.31 .821
Presentation +1.42 .570
3.1 The application is not over-designed e.g. it does not contain irrelevant icons and too much colour
+1.56 .504
3.2 The look of the application is attractive and pleasant +1.06 .801
Aesthetics and minimalistic design +1.31 .454
4.1 I can use different features (camera, microphone, speaker) to interact with the application +0.25 1.164 4.2 The application provides information in the form of audio, videos, images, texts etc. +0.13 .842
Multimodal interaction +0.19 .920
5.1 The application communicates to the user whenever it is busy doing something on the background
+0.06 .914
5.2 The application highlights tasks that I think are important to me +0.44 .504
Visibility of system status +0.75 .523
6.1 The learning contents are valuable to me. I can apply the provided information to improve my farming practices.
+1.41 .665
6.2 The learning content is relevant and up to date +1.00 .950
Authenticity and relevance of learning content +1.20 .717
7.1 Learning content is organized in a clear, consistent and logical manner +1.44 .504 7.2 The learning content is understandable. I don‟t need an extension officer to understand the
content
+1.06 .716
Structure of learning content +1.25 .552
8.1 The application allows users to interact with other users and extension workers (e.g. through forums, chat rooms)
+0.34 .902
8.2 Learning activities encourage users to work together while learning. +0.16 .808
Collaborative learning +0.25 .660
9.1 Learning objectives and outcomes are stated at the beginning of each lesson -0.34 1.00 9.2 The learning contents are related to the objectives of the lesson +0.31 .998
Alignment -0.02 .920
10.1 There are self-evaluation exercises that enables me to know how much I have learned -0.94 .840 10.2 The application provides timely feedback when answering self- evaluation exercises -1.00 .568
Self–evaluation and feedback -0.97 .634
User Interface Usability +1.00 .414
© 2018, IJCSMC All Rights Reserved
16
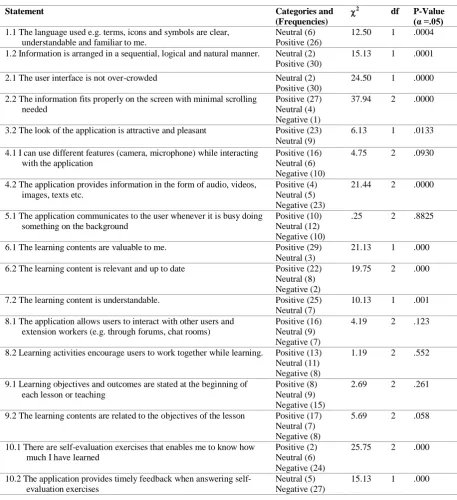
The distributions of responses to the Likert-statements were compared using non-parametric Chi-square hypothesis testing as shown in Table 3. For each statement in Table 4, the null hypothesis is that the categories occur with equal probabilities while the alternative hypothesis is that the categories do not occur with equal probabilities. For example, for statement 1.1, the null hypothesis is: The categories neutral and positive occur with equal probabilities, while the alternative hypothesis is: The categories neutral and positive do not occur with equal probabilities.Table 4. Chi-Square Analysis of the Distribution of Responses to Usability Evaluation Statements.
Statement Categories and
(Frequencies)
2 df P-Value
(α =.05) 1.1 The language used e.g. terms, icons and symbols are clear,
understandable and familiar to me.
Neutral (6) Positive (26)
12.50 1 .0004
1.2 Information is arranged in a sequential, logical and natural manner. Neutral (2) Positive (30)
15.13 1 .0001
2.1 The user interface is not over-crowded Neutral (2) Positive (30)
24.50 1 .0000
2.2 The information fits properly on the screen with minimal scrolling needed
Positive (27) Neutral (4) Negative (1)
37.94 2 .0000
3.2 The look of the application is attractive and pleasant Positive (23) Neutral (9)
6.13 1 .0133
4.1 I can use different features (camera, microphone) while interacting with the application
Positive (16) Neutral (6) Negative (10)
4.75 2 .0930
4.2 The application provides information in the form of audio, videos, images, texts etc.
Positive (4) Neutral (5) Negative (23)
21.44 2 .0000
5.1 The application communicates to the user whenever it is busy doing something on the background
Positive (10) Neutral (12) Negative (10)
.25 2 .8825
6.1 The learning contents are valuable to me. Positive (29) Neutral (3)
21.13 1 .000
6.2 The learning content is relevant and up to date Positive (22) Neutral (8) Negative (2)
19.75 2 .000
7.2 The learning content is understandable. Positive (25) Neutral (7)
10.13 1 .001
8.1 The application allows users to interact with other users and extension workers (e.g. through forums, chat rooms)
Positive (16) Neutral (9) Negative (7)
4.19 2 .123
8.2 Learning activities encourage users to work together while learning. Positive (13) Neutral (11) Negative (8)
1.19 2 .552
9.1 Learning objectives and outcomes are stated at the beginning of each lesson or teaching
Positive (8) Neutral (9) Negative (15)
2.69 2 .261
9.2 The learning contents are related to the objectives of the lesson Positive (17) Neutral (7) Negative (8)
5.69 2 .058
10.1 There are self-evaluation exercises that enables me to know how much I have learned
Positive (2) Neutral (6) Negative (24)
25.75 2 .000
10.2 The application provides timely feedback when answering self-evaluation exercises
Neutral (5) Negative (27)
15.13 1 .000
In the following discussion, tables 3 and 4 are referred to.
3) Analysis of Results - User interface usability
© 2018, IJCSMC All Rights Reserved
17
Swahili. It was also observed that not all the participants knew what the speaker icon meant and were surprised that the application had audio content. Additionally, the “message” icon on the notice board page did not match users‟ expectations, most of them thought it meant sending a short message “SMS” and not an email.Responses to the statement - items in the application are arranged in a sequential, logical and natural manner, revealed a significantly (2 = 15.13, df = 1, p = .0001) positive trend. On the -2 to +2 scale, the mean response was +1.16 (σ = .68). This shows that respondents agreed that the items in the application are arranged in a sequential, logical and natural manner. The average of the two statements resulted in a mean response of 1.16 (σ = .68) for the match between the system criterion.
2) Presentation: On the -2 to +2 scale, the mean response of the statement that the user interface is not over crowded, was +1.53 (σ = .62). This strong positive response was supported by the significant (2
= 24.05, df = 1, p = .0000) number of positive responses compared to the number of neutral responses. The fact that the application was not overcrowded made it easy for respondents to make selections, as it was observed during the Think Aloud protocol. Moreover, responses to the statement information presented fits properly on the screen with minimal scrolling needed, showed a significantly (2 = 37.94, df = 2, p = .000) positive trend with the mean response resulting to +1.31 (σ = .82). This shows that respondents agreed that the information presented on the user interface of the application fits properly on the screen. After averaging the responses to the two statements, the mean response of the presentation criteria was found to be +1.42 (σ = .57).
3) Aesthetics and minimalistic design: All the respondents positively indicated that the application is not over-designed e.g. it does not contain irrelevant icons and too much colour, with a resultant mean response value of +1.56 (σ = .50). However, some respondents suggested the brightness of the colours to be reduced and different colours to be used for different fonts and icons. Examples of suggestions regarding the colour of the user interface are: “use different colours to represent different icons”, “reduce brightness of the colours” and
“use different font colours”. Additionally, during the Think Aloud protocol, it was observed that some pages had the speaker icons that were irrelevant at that point since no audio played when they were touched. These findings suggest that while some respondents agreed that the application was not over designed, they preferred the different colours to be used to distinguish different elements of the user interface.The number of positive responses to the statement - the look of the application is attractive and pleasant, was significantly more than the number of neutrals (2 = 6.13, df = 1, p = .013), and the mean response value was +1.06 (σ = .801). The high number of neutral responses could be because some of the respondents preferred different colours for the icons and fonts, and the general theme colour of the application.The average of the two statements resulted in a mean response of +1.31 (σ = .454) for the aesthetics and minimalistic design criterion. This means that even though respondents were satisfied with the minimalistic design and aesthetically pleasing look of the user interface, allowing users to customize the look of the application can make it attractive to more people.
4) Multimodal interaction: While half of the respondents positively indicated that they can use different features for example camera, speaker and microphone while interacting with the application, they were not significantly more (2 = 4.75, df = 2, p = .093) compared to those who had neutral and negative opinions. The mean response of +0.25 (σ = 1.164) highlights the weak positive mean response and more diverse opinions. This shows a significant number of respondents were not sure whether the application enables them to use the different features of their devices. During the Think Aloud protocol, the author observed that some of the participants could use the speaker of their mobile devices to listen to the content while others were supervised that the application had audio content. Moreover, suggestions such as: “enable farmers to take pictures of their
crops”, “video calls to be introduced so that if a farmer comes across a rare plant or animal disease he can show others”, “provide video chatting with extension officers”, indicate that respondents want more than just using the speaker (listening to content).A significant (2 = 21.44, df = 2, p = .000) number of the respondents negatively indicated that the application provides information in the form of audio, videos, images and text. The mean response was found to be +0.13 (σ = .842). Moreover, 18% of the suggestions were related to this statement. Examples include: “provide videos for explanation”, “provide more elaborate videos to increase the
understanding levels for those who find it difficult to read”, “introduce more learning activities e.g. videos to boost understanding”. These results indicate that while the application provides pictures and text, a significant number of the respondents preferred addition of videos.
The average of the two statements resulted in a turned out to be +0.19 (σ = .920) for the multimodal interaction criterion.
© 2018, IJCSMC All Rights Reserved
18
connections, touching the speaker icon did not play the audio immediately, but after they had moved to the next page.For statement 5.2, all the participants positively indicated that the application highlights tasks that they thought were important to them, with a strong positive mean response value of +1.44 (σ = .504) on the +2 to -2 scale. The average of the two statements resulted in a +0.75 (σ = .523) response value for visibility of system status.
4) Analysis of Results - Pedagogical Usability
1) Authenticity and relevance of the learning content: Reactions to the statement about value of the learning contents were significantly more positive than neutral (2 = 21.13, df = 1, p = .000) with a mean response of +1.41 (σ = .665) indicating that the learning contents were valuable to the respondents. As to whether the learning contents were relevant and up to date, a significant number of respondents positively responded to the statement compared to those who gave neutral and negative responses (2 = 19.75, df = 2, p = .000). the mean response value along the -2 to +scale was +1.00 (σ = .950) which shows that most of the respondents agreed with the statement. However, 18% of the suggestions from the open-ended questions were related to relevance of the learning contents. Examples of the suggestions included: “increase the learning
contents e.g. soil identification and suitable crops”, “introduce modern methods of farming e.g. greenhouses”, “provide more related examples”, and “teach people how they can modernize their farming. i.e. how machines can be used to ease work”. These results shows that even though the respondents agreed that the learning contents were relevant and up to date, a number of them wished more information should be added. The average of the two statements resulted in a positive response value of +1.2 (σ = .717).
2) Structure of learning content: Feedback to statement 7.1 indicated that all the respondents found the learning content to be organized in a clear, consistent and logical manner. The mean response value was +1.44 (σ = .504).Regarding whether the learning content was understandable without the need of an extension officer, the number of positive responses was significantly more compared to those of neutral responses (2 = 10.13, df = 1, p = .001). On the -2 to +2 scale, the mean response value was +1.06 (σ = .716). This shows that the respondents found the learning content to be understandable. However, suggestions such as “add more
languages”, “consider those in need of local language” and “introduce local language” shows that some participants preferred local languages to be included so that more farmers including those who cannot read English and Swahili may understand what is being taught. The average of the two statements resulted in a positive response value of +1.25 (σ = .552) for the structure of learning content criterion.
3) Collaborative learning: Answers to the statement - the application allows users to interact with others, were found to have the equal chances of either being positive, neutral or negative (2 = 4.19, df = 2, p = .123), and the mean response value was +0.34 (σ = .902). This shows equal number of respondents agreed, disagreed and had neutral opinion as to whether the application allows users to interact with others. It can also mean that respondents were not sure whether the application allows users to interact with other users and extension workers. During the Think Aloud protocol, it was observed that some respondents did not know the function of the notice board part of the application (which can be used to communicate with others). Additionally, 18% of the suggestions made on the open-ended questions were related to communication and collaboration. Examples of statements made included, “provide contacts for other farmers”, “provide contacts of experts”, “provide
SMS alerts for new information”, “allow farmers to comment”.Likewise, responses to the statement - learning activities encourage users to collaborate with others while learning, were found to have the same chances of either being positive, neutral or negative (2 = 1.19, df = 2, p = .552), and the mean response value was +0.16 (σ = .808). This shows that equal number of respondents agreed, disagreed and had a neutral opinion about this statement. The average of the two statements resulted in a mean response value of +0.25 (σ = .660) indicating a weak level agreement to the collaborative learning criterion.
4) Alignment: While the mean response value of the statement - learning objectives and outcomes are stated at the beginning of each lesson was -0.34 (σ = 1.00), the answers were found to have equal probabilities of being either positive, negative or neutral. (2 = 2.69, df = 2, p = .261).Similarly, while the mean response value of the statement - learning contents are related to the objectives of the lesson was found to be +0.31 (σ = .998), the distribution of responses were found to have equal probabilities of being positive, negative or neutral (2 = 5.69, df = 2, p = .058). Responses to the above two statements used to assess the alignment criterion shows that equal number of respondents agreed, disagreed and had a neutral opinion about the statements. The mean response value for this criterion was -0.02 (σ = .920).
© 2018, IJCSMC All Rights Reserved
19
negatively indicated that - the application provides timely feedback when answering self-evaluation exercises, with a negative mean response value of 1.00 (σ = .568). The average of the two statements gave a response of -0.97 (σ = .634). The results indicate that majority of the respondents did not agree that the application provides evaluation exercises and feedback mechanisms. 8% of the suggestions called for the inclusion of self-evaluation and providing feedback. Examples of suggestions given are, “include self-evaluation exercises”,“provide room for self-evaluation exercises”
V. DISCUSSION AND RECOMMENDATIONS
1) Discussion
The first objective was to establish how farmers rate the user interface usability of Haller Farmers application. Five criteria were used to this end. It was found out that the user interface of the application matches with the real world of the respondents. That is, the language used to identify different parts of the user interface and the way information is arranged on the user interface was acceptable to the respondents. Likewise, for the presentation criteria, it was found out that information was not crowded on the user interface and it fits properly on the screen with minimal scrolling needed. Under the aesthetics and minimalistic design criterion, it was found out that the application is not overdesigned and it was attractive. However, allowing users to personalize the application can improve the attractiveness and pleasantness of the application. For the multimodal interaction criterion, it was found out that the application does not take full advantage of the various features of a mobile device, for example camera and microphone to enhance learners learning experience. Moreover, it does not provide information in the form of videos that was preferred by some of the respondents. Under the visibility of system status criterion, it was found that the application highlights to users what might be important to them, but it does not clearly communicate to users about important tasks that might be happening in the background. In general, the user interface usability of the application was positively rated with an average score of +1.00 (σ =.414). This score can be increased if the raised concerns, especially the inability of the application to allow users to take pictures and record videos, are addressed as discussed in the recommendations section.
The second objective was to establish how farmers rate the pedagogical usability of Haller Farmers application, and five criteria were used for this purpose. The first one was about the authenticity and relevance of the learning content. While the learning contents were found to be up to date and valuable to the respondents, some respondents wanted more relevant and updated information. Under the structure of the learning content criteria, it was found out that the learning contents were understandable and organized in a clear, consistent and logical manner. In relation to the collaborative learning criteria, it was found that the application does not provide a clearly marked place that allows users to interact with others while learning. Additionally, some of the learning activities do not encourage users to collaborate while learning. With respect to the alignment criteria, findings indicated that learning objectives and outcomes were not stated at the beginning of each teaching. However, the learning contents were related to the topic of the lesson. For the self-evaluation and feedback mechanism criteria, it was found out that the application does not provide self-evaluation and feedback mechanisms to enable learners rate their understanding. The mean response value for pedagogical usability of Haller Farmers resulted in +0.30 (σ = .437), which can be improved by addressing the concerns such as collaboration and communication, addition of relevant and modern ways of agriculture, and inclusion of self-evaluation and feedback mechanisms.
2) Recommendations
Based on the findings, the following recommendations for improving user interface and pedagogical usability of Haller Farmers application are proposed. These recommendations can also be used to guide the usability design and evaluation of other applications that are similar to Haller Farmers. The recommendations are directed towards the designers of Haller Farmers application, mobile application developers interested in mLearning for farmers and government institutions concerned with farmer education
1 Use more videos compared to text. Agriculture being a practical subject, learning content should be video based. Videos can also be easy to understand compared to text.
2 Provide content based on local language. This is well implemented in the Haller Farmers application; since it was first designed for people living in coastal region of Kenya, the learning content and the user interface can be switched to Swahili. However, if the application is to be used by farmers from other regions, it should provide content in the local language of that region. Especially in relation to the learning content. The application can take advantage of GPS feature to identify the location of the farmer and consequently provide content based on the local language of that region.
© 2018, IJCSMC All Rights Reserved
20
messages should be sent in the form of SMS instead of emails since most farmers use SMS. Moreover, after every teaching user should be able to make comments.4 Provide relevant and updated content. Learning content should be up-to-date. Agricultural extension departments need to research well and determine what the needs of farmers in a particular region are. Through the use of GPS, information provided to farmers can be customized to suit the needs for a particular region.
5 Provide self-evaluation exercises. The application should allow farmers to evaluate their level of understanding. Data collected through such exercises can also be used by extension officers to know how much the farmers understand the content and make adjustments where necessary.
6 Learning objectives should be stated at the beginning of each lesson or teaching. This is to inform the farmer what the lesson will be about. Additionally, the self-evaluation exercises should be based on the learning objectives that were stated at the beginning of each lesson
7 The application should communicate to users about anything that is happening whether it is happening in the foreground or background. This will enable the user to decide whether to wait for the application to complete what is doing or quit.
8 Allow users to personalize the application. That is change settings such as theme colors, font sizes and colors.
9 Allow farmers to take pictures while using the application. This will enable them to share pictures and videos of their (infected) crops and livestock with the extension agents.
VI.CONCLUSION
This study evaluated one mLearning application meant to teach farmers about better farming techniques. The purpose was to establish how usability of such applications could be improved. A selected list of usability criteria was picked from literature and used to find out how farmers rate the usability of the application based on those criteria, and suggestions they have regarding how the user interface and pedagogical usability of the application can be improved. Two usability evaluation methods: subjective (use of questionnaires) and Empirical (use of Think Aloud Protocol), were used in order to identify as much usability flaws as possible. Case study research design was used and both qualitative and quantitative data were collected. Questionnaires were used to collect data that could be analyzed statistically. Data from the close-ended questions was analyzed using tables and graphs, while those from open-ended questions, using content analysis technique. Findings from the close-ended questions of the questionnaires indicated that respondents positively rated both the user interface and pedagogical usability of the application. However, the mean response value of +1.00 (σ =.414), for the user interface was more positive than the mean response value of +0.30 (σ = .437), for pedagogical usability. Moreover, findings from the open ended questions and the Think Aloud protocol revealed the usability flaws that participants faced while using the application. This allowed the authors to recommend suggestions that they believe will be useful for not only improving the usability of Haller Farmers application, but also for designing and evaluating future mLearning applications aimed at supporting agricultural extension.
R
EFERENCES
[1] Batchelor, S., Scott, N., Manfre, C., Valverde Lopez, A., & Edwards, D. (2014, August). Is there a role for Mobiles to suppor t Sustainable Agriculture in Africa. In ICT for Sustainability 2014 (ICT4S-14). Atlantis Press.
[2] Jack, K. (2011): “Market Inefficiences and the Adoption of Agricultural Technologies in Developing Countries,” ATAI. 1, 3 [3] Bii, B. (2016). Extension officers shortage crippling maize farming. Bussiness Daily. [online] Available at:
https://www.businessdailyafrica.com/corporate/Extension-officers-shortage-crippling-maize-farming/539550-3088462-9w5mtrz/index.html [Accessed 1 Feb. 2018].
[4] Plechowski, K. (2014, October). Youth, ICTs and agriculture-exploring how digital tools and skills influence the motivation of young farmers. In eChallenges e-2014, 2014 Conference (pp. 1-8). IEEE.
[5] Khan, A., & Akram, M. (2012). Farmers' perception of extension methods used by Extension Personnel for dissemination of new agricultural technologies in Khyber Pakhtunkhwa, Pakistan. Sarhad J. Agric, 28(3), 511-520.
[6] International Telecommunication Union. (2017). ICT Facts and Figures 2017. Retrieved from https://www.itu.int/en/ITU-D/Statistics/Documents/facts/ICTFactsFigures2017.pdf
[7] Communications Authority of Kenya (CA). (2018). Second Quarter Sector Statistics Report for the Financial Year 2017/2018 (October - December 2017). Retrieved from
http://www.ca.go.ke/images/downloads/STATISTICS/Sector%20Statistics%20Report%20Q2%20%202017-18.pdf
[8] Sanga, C., Mlozi, M. R. S., Tumbo, S., Mussa, M., Sheto, M. C. R., Mwamkinga, G. H., & Haug, R. (2013). On Search for Strategies to Increase the Coverage of Agricultural extension Service: Web-based Farmers' Advisory Information System. International Journal of Computing & ICT Research, 7(1).
[9] O'Malley, C., Vavoula, G., Glew, J., Taylor, J., Sharples, M., Lefrere, P., ... & Waycott, J. (2005). Guidelines for learning/teaching/tutoring in a mobile environment.
[10] Dissanayeke, U., Hewagamage, K. P., Ramberg, R., & Wikramanayake, G. N. (2014, December). Creating mLearning opportunities to facilitate collaborative learning: A mobile SMS based Twitter implementation. In Advances in ICT for Emerging Regions (ICTer), 2014 International Conference on (pp. 49-54). IEEE.
© 2018, IJCSMC All Rights Reserved
21
[12] Patel, N., Chittamuru, D., Jain, A., Dave, P., & Parikh, T. S. (2010, April). Avaaj otalo: a field study of an interactive voice forum for small farmers in rural india. In Proceedings of the SIGCHI Conference on Human Factors in Computing Systems (pp. 733-742). ACM.
[13] Dissanayeke, U., Perera, A., Hewagamage, K. P., & Wikramanayake, G. N. (2015, August). Mobile based collaborative learning tool to facilitate instructor-mediated informal learning in agriculture. In Advances in ICT for Emerging Regions (ICTer), 2015 Fifteenth International Conference on (pp. 99-105). IEEE.
[14] Danes, M. H. G. I., Jellema, A., Janssen, S. J. C., & Janssen, H. (2014). Mobiles for agricultural development: exploring tre nds, challenges and policy options for the Dutch government (No. 2501). Alterra Wageningen UR.
[15] Awuor, F., Kimeli, K., Rabah, K., & Rambim, D. (2013, May). ICT solution architecture for agriculture. In IST-Africa Conference and Exhibition (IST-Africa), 2013 (pp. 1-7). IEEE.
[16] ISO/IEC 9126-1. (2000). Software engineering - Product quality - Part 1: Quality model.
[17] Hujainah, F. M. O. (2013). Usability guidelines of mobile learning application (Doctoral dissertation, Universiti Teknologi Malaysia). [18] Nayebi, F., Desharnais, J. M., & Abran, A. (2012, April). The state of the art of mobile application usability eva luation.
In CCECE (pp. 1-4).
[19] Tahir, R., & Arif, F. (2015). A Measurement Model Based on Usability Metrics for Mobile Learning User Interface for Children. International Journal of E-learning and Educational Technologies in Digital media (IJEETDM), 1(1), 16-31.
[20] Imtinan, U., Chang, V., & Issa, T. (2013). Usability issues in mobile learning: Students‟ perceptions in Pakistani universities. Qscience proceedings, (12th World Conference on Mobile and Contextual Learning [mLearn 2013), 19.
[21] Alsumait, A., & Al-Osaimi, A. (2010). Usability Heuristics Evaluation for Child E-learning Applications. Journal of Software, 5(6). [22] Valsamidis, S., Kazanidis, I., Petasakis, I., & Karakos, A. (2011). A Framework for e-Learning In Agricultural Education.
In HAICTA (pp. 373-384).
[23] Fulton, A., Fulton, D., Tabart, T., Ball, P., Champion, S., Weatherley, J., & Heinjus, D. (2003). Agricultural extension, lear ning and change. Report prepared for the Rural Research and Development Corporation. RIRDC Publication, (03/032).
[24] Anaeto, F. C., Asiabaka, C. C., Nnadi, F. N., Ajaero, J. O., Aja, O. O., Ugwoke, F. O., ... &Onweagba, A. E. (2012). The role of extension workers and extension services in the development of agriculture in Nigeria. Wudpecker Journal of Agricultural Research Vol. 1 (6), 180-185.
[25] Das, S. K., & Tripathi, H. (2014). Extension Education: Myth or Reality.International Journal of Bio-resource and Stress Management, 5(3), 467-474.
[26] Schugurensky, D. (2000). The forms of informal learning: Towards a conceptualization of the field.
[27] Patrick, W. (2010). Recognising non-formal and informal learning outcomes, policies and practices: Outcomes, policies and practices (Vol. 2009, No. 35). OECD publishing.
[28] Jha, B., Goswami, V., & Surana, A. (2015). pedagogy and capacity building: critical components of non-formal education. IOSR Journal Of Research & Method In Education (IOSR-JRME), 5(1), 46-49. http://dx.doi.org/DOI: 10.9790/7388-05134649
[29] Taylor, E. W. (2006). Making meaning of local nonformal education: Practitioner‟s perspective. Adult Education Quarterly, 56(4), 291-307.
[30] Akuku, B. (2015) Application of innovative ICT tools for linking Agricultural research knowledge and extension services to fa rmers in Kenya. Available online at: http://www.ubuntunet.net/sites/default/files/uc2014/bakuku2.pdf
[31] Barnabas, A. (2013). An e-farming framework for sustainable agricultural development in Nigeria. Journal of Internet and Information Systems, 3(1), 1-9.
[32] Peters, K. (2007). mLearning: Positioning educators for a mobile, connected future. The International Review of Research in Open and Distributed Learning, 8(2).
[33] Kearney, M., Schuck, S., Burden, K., & Aubusson, P. (2012). Viewing mobile learning from a peda gogical perspective. Research in learning technology, 20.
[34] Hansen, J.P. and Hansen, N.F. (2009). MLearning in agriculture :Ppossibilities and barriers.In: European Federation for Infor mation Technology in Agriculture, Food and the Environment . 463 - 469.
[35] Tijani, O. K. (2016). Usability Assessment of Educational Software by Students: Case of"? Pón-Ìm?" in Osun State, Nigeria.
International Journal of Education and Development using Information and Communication Technology, 12(2), 175-194.
[36] Kharade, K., & Thakkar, R. (2012). Promoting ICT enhanced constructivist teaching practices among pre-service teachers: A case study. International Journal of Scientific and Research Publications, 2(1), 1-7.
[37] Botha, A., Van Greunen., & Herselman, (2010). Mobile human-computer interaction perspective on mobile learning. [38] Rogers, Y., Sharp, H., & Preece, J. (2011). Interaction design: beyond human-computer interaction. John Wiley & Sons.
[39] Preece, J., Rogers, Y., Sharp, H., Benyon, D., Holland, S., & Carey, T. (1994). Human-computer interaction. Addison-Wesley Longman Ltd.
[40] International Organization for Standardization. (1998). ISO 9241-11: Ergonomic Requirements for Office Work with Visual Display Terminals (VDTs): Part 11: Guidance on Usability.
[41] Caplan, S. H. (1994, March). Making usability a Kodak product differentiator. In Usability in practice (pp. 21-58). Academic Press Professional, Inc.
[42] Zhang, D., & Adipat, B. (2005). Challenges, methodologies, and issues in the usability testing of mobile applications. International Journal of Human-Computer Interaction, 18(3),293-308.
[43] Kjeldskov, J., & Stage, J. (2004). New techniques for usability evaluation of mobile systems. International journal of human-computer studies, 60(5), 599-620.
[44] Harrison, R., Flood, D., & Duce, D. (2013). Usability of mobile applications: literature review and rationale for a new usability model. Journal of Interaction Science, 1(1), 1-16.
[45] Chen, G. D., Chang, C. K., & Wang, C. Y. (2008). Ubiquitous learning website: Scaffold learners by mobile devices with information-aware techniques. Computers & Education, 50(1), 77-90.
[46] Kukulska-Hulme, A. (2009). Will mobile learning change language learning?. ReCALL, 21(02), 157-165.
[47] Jirgensons, M. (2015). Towards Usability Integration into E-Learning Design. SIE, 1, 289. http://dx.doi.org/10.17770/sie2012vol1.71
[48] Ivanc, D., Vasiu, R., & Onita, M. (2012, September). Usability evaluation of a LMS mobile web interface. In International Conference on Information and Software Technologies (pp. 348-361). Springer Berlin Heidelberg.
[49] Hadjerrouit, S. (2010). A conceptual framework for using and evaluating Web-based learning resources in school education. Journal of Information Technology Education, 9, 53–79.
[50] Sharma, S. K., Chen, R., & Zhang, J. (2014). Examining Usability of E-learning Systems-An Exploratory Study (Research-in-Progress). International Proceedings of Economics Development and Research, 81, 120.
© 2018, IJCSMC All Rights Reserved
22
[52] Ali, A., Alrasheedi, M., Ouda, A., & Capretz, L. F. (2015). A study of the interface usability issues of mobile learning appl ications for smart phones from the users perspective. arXiv preprint arXiv:1501.01875.
[53] Qureshi, K. M., & Irfan, M. (2009). Usability evaluation of e-learning applications, A case study of It‟s Learning from a student‟s perspective.
[54] Harpur, P. and De Villiers, M.R., 2015. MUUX-E, a framework of criteria for evaluating the usability, user experience and educational features of m-learning environments. South African Computer Journal, 56(1), pp.1-21.
[55] Seong, D. S. K. (2006, October). Usability guidelines for designing mobile learning portals. In Proceedings of the 3rd international conference on Mobile technology, applications & systems (p. 25). ACM.
[56] Fetaji, M., & Fetaji, B. (2011, June). Devising MLearning usability framework. In Information Technology Interfaces (ITI), Proceedings of the ITI 2011 33rd International Conference on (pp. 275-280). IEEE.
[57] Sanjay, K., Dineshkumar, S., &Sujit, R., (2013). Designing User Interface for Agriculture Based Applications
[58] Devezas, T., Mashapa, J., Giesteira, B., Greunen, D., & Carreira, C. (2014). ICT4D HCI Guidelines: A study for Developing Countries. In Proceedings of the 8th International Development Informatics Association Conference (2014).
[59] Prieto, J. C. S., Migueláñez, S. O., & García-Peñalvo, F. J. (2013). Understanding mobile learning: devices, pedagogical implications and research lines. Teoría de la Educación; Educación y Cultura en la Sociedad de la Información, 15(1), 20.
[60] Yin, R. K. (2017). Case study research and applications: Design and methods. Sage publications.
[61] Holzinger, A. (2005). Usability engineering methods for software developers. Communications of the ACM, 48(1), 71-74. [62] Cronbach, L. J. (1951). Coefficient alpha and the internal structure of tests. psychometrika, 16(3), 297-334.
[63] Dawson, C. (2009). Introduction to research methods: A practical guide for anyone undertaking a research project. Hachette UK.
Guide to Content Analysis. Retrieved from https://asell.site/guide-to-content-analysis/
APPENDICES
Appendix A: Questionnaire
mLearning Usability Evaluation questionnaire for farmers in Kapsoya ward, Uasin-Gishu County, Kenya Thank you for agreeing to take part in this research. This research is meant to find out how usable you find Haller Farmers application when learning about better farming techniques. It is my hope that your contribution will play a big part towards improving the usability of mLearning applications meant to educate farmers.
Section I - Demographic Data
1. Name (Optional)__________________________Phone number (Optional)__________ 2. Gender Male Female
3.Age group?
Section II – Usability Data
After interacting with the Haller Farmers application, please indicate with a tick (✓) the extent to which you agree or disagree with the following statements.
User interface Usability
S/N Statement
Strongly Disagree
[1]
Disagree [2]
Neutral [3]
Agree [4]
Strongly Agree
[5]
1.1 The language used in the application for example terms, icons and symbols, are clear, understandable and familiar to me.
1.2 Items in the application are arranged in a sequential, logical and natural manner.
2.1 The user interface of the application is not over-crowded
2.2 The information presented fits properly on the screen with minimal scrolling needed
3.1 the application is not over-designed e.g. it does not contain irrelevant icons and too much colour
3.2 The look of the application is attractive and pleasant
4.1 I can use different features (camera, microphone, speaker) to interact with the application
4.2 The application provides information in the form of audio, videos, images, texts etc.
5.1 The application communicates to the user whenever it is busy doing something on the background
5.2 The application highlights tasks that I think are important to me
![Fig. 1 A four perspectives usability testing approach [48].](https://thumb-us.123doks.com/thumbv2/123dok_us/1899006.1248479/5.595.154.446.322.546/fig-perspectives-usability-testing-approach.webp)