Experimental Studies and Analysis on IEMI Source, Field
Propagation and IEMI Coupling to Power Utility System
Divya Shyamala1, *, Rakesh Kichouliya2, Pawan Kumar2, Sandeep M. Satav2, and Ramakrishna Dasari1
Abstract—Intentional Electromagnetic Interference (IEMI) is one of the applications of High Power Electromagnetics (HPEM) for causing intentional interference in military targets such as C4I (Command, Control, Communication, Computer and Intelligence) targets and segments of civilian systems like critical VSAT’s (Very Small Aperture Terminals), power grid and communication network, weather and air-traffic control radars etc. HPEM essentially consists of generation of intense electromagnetic waves either as High Power Microwave (HPM) or Ultra Wide Band (UWB) waves to cause electromagnetic interference. High power UWB electromagnetic waves are promising candidate for IEMI application. One such UWB source, developed for the purpose of radiating high intensity, fast rise time, short pulses, is the Half Impulse Radiating Antenna (HIRA) system, which covers a frequency range from 100 MHz to 6 GHz. In this paper, radiation characteristics of UWB source like electric field in both boresight and off-boresight, far field boundary and radiation pattern were studied. The UWB pulse dispersion through civil infrastructure and their coupling to power cables were studied computationally and validated experimentally.
1. INTRODUCTION
Modern civil and military infrastructures use electronic systems in large scale for various applications. While this dependence results in improved quality of service, it comes at the price of increased vulnerability to a wide variety of threats to the society’s infrastructure. Electromagnetic threats are considered among those potential threats to the electronic devices because of miniaturisation of electronic components and their lower operating voltages and power. Therefore, it is essential to identify such potential threats in their deployment scenarios in order to harden the electronic system and prevent disruption in the functioning of electronic systems [1].
HPEM technology uses devices that can generate transient electromagnetic (EM) environments where the peak electric and magnetic fields have high intensities. The act of deliberately disturbing electronic devices using such a technology is known as Intentional Electromagnetic Interference (IEMI). HPEM systems use special electrical equipments and antenna, which transforms battery power, or powerful chemical reaction or explosive energy into intense microwaves or UWB pulses, which can couple to electronic systems and damage them. IEMI is also similar to HEMP (High altitude Electromagnetic Pulse), without involving a nuclear burst, except that it has a very limited spatial region coverage, and a very narrow time domain waveform characteristics. Thereby, the difference between an IEMI attack and an accident involving an HPEM source is only the human intent [2]. An official definition for IEMI is “intentional malicious generation of electromagnetic energy introducing noise or signals into electric
Received 17 November 2017, Accepted 16 April 2018, Scheduled 27 April 2018
* Corresponding author: Divya Shyamala ([email protected]).
1 CEME, Department of ECE, Osmania University, Hyderabad 500007, India. 2 Research Centre Imarat, P. O. Vigyanakancha,
and electronic systems, thus disrupting, confusing or damaging these systems for terrorist or criminal purposes” [3].
EM signals operating in the frequency range of 200 MHz to 5 GHz can cause transient upset to electronic systems because typical apertures that provide a path for coupling through various points of entries for energy propagation inside a physical body that may be resonating in this frequency range. Based on the present available technology, narrowband and ultra-wideband are the two time domain waveforms, which can be realised to form an IEMI attack on electronic system. HPEM environments are classified into four frequency bands based on the frequency content of their spectral densities, and they are [4]: “narrowband,” “moderate band,” “ultra-moderate band” and “hyperband”. This paper deals with the study of UWB fields from hyperband radiator and its coupling to the cables and electronic systems.
Applications of HPEM can be marked in the areas of Military, Ground Penetrating Radars, food processing industries, electroforming industries, medical field such as X-ray imaging, military medicine [5], detonation of Mines and IED (Improvised explosive device) from a safe distance in Military warfare [6]. The paper is organised as follows: (1) the IEMI source (HIRA) has been characterized, (2) the far field boundary of the HIRA was experimentally determined, (3) the effect of civil structures on pulse propagation has been studied, (4) the field to cable coupling studies was carried out in a utility building.
2. HIRA
Hyperband radiators have percentage bandwidth greater than 163.4% and operate from 10’s of MHz to several GHz. They can be employed as high power, broadband jammers for disrupting the critical military and civilian electronic systems [7]. Hyperband radiator used is a Half Impulse Radiating Antenna (HIRA), which is non-dispersive with a planar phase front [8]. HIRA is a time domain antenna radiating short pulses of a few nanoseconds duration.
2.1. Components
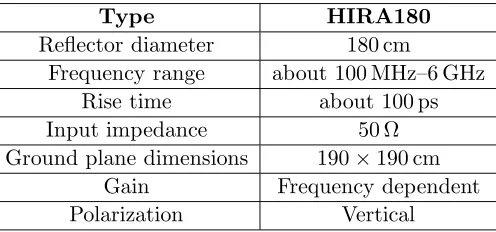
HIRA180 manufactured by Montena Company was used for IEMI study as shown in Figure 1(a). The geometrical specifications of HIRA are mentioned in Table 1.
Table 1. HIRA180 specifications.
Type HIRA180
Reflector diameter 180 cm
Frequency range about 100 MHz–6 GHz
Rise time about 100 ps
Input impedance 50 Ω
Ground plane dimensions 190×190 cm
Gain Frequency dependent
Polarization Vertical
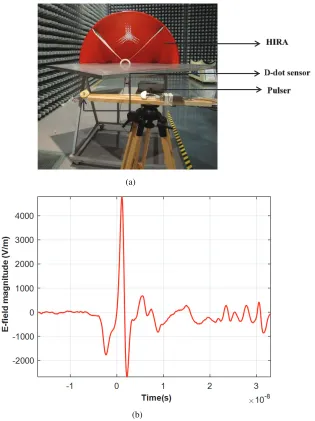
HIRA consists of half parabolic dish withfd=F/Dratio of 0.315, where focal length (F) is 0.57 m, and diameter (D) is 1.8 m. High voltage pulser drives the HIRA with a Gaussian pulse [9]. In far field, output radiated pulse is the time derivative of input excitation signal which is an impulse. Prior to the impulse, a low amplitude prepulse is radiated from feed point. Impulse waveform is succeeded by a postpulse, mainly produced through the diffraction effects from feed arm edges and reflector rim as shown in Figure 1(b). Mathematical expression for radiated field on boresight is given by [10] Equation (1)
E(r,t) = D √
2 2πcfgr
dV(t−2cF)
dt − c
2F
V (t)−V
t−2F c
(a)
(b)
Figure 1. (a) Experimental setup to measure time domain pulses. (b) Sample sensor output signal.
where
Dis the diameter of HIRA [m].
F is the focal length [m].
V(t) is the voltage from feed arms to the ground plate in air [V].
fg is the geometric factor.
cis the speed of light [m/s].
tr is the rise time of the pulse [s].
r is the distance HIRA feed point — point of observation [m].
3. SOURCE CHARACTERIZATION
3.1. Experimental Setup
The characteristics of time domain radiation are studied experimentally, at distances ranging from 2 m to 13 m as shown in Figure 1(a). The high voltage pulser drives the antenna with Gaussian pulses of 0.1 ns rise time and 9.6 kV peak amplitude. The derivative output of D-dot sensor is integrated, and offset is compensated to obtain the original radiated E-field, shown in Figure 1(b) [11].
3.2. On and Off Axis Measurements
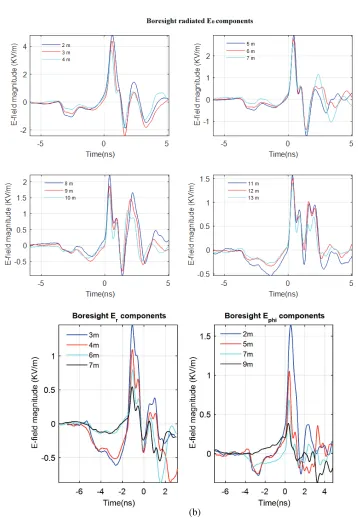
Figure 2(a) and Figure 2(b) below show the pulse variation of components Eθ,Er and Eφ at different distances in boresight (θ = φ = 90◦). As the distance increases, impulse and prepulse amplitudes decrease. Figure 2(c) shows the variation of peak amplitude of Eθ with respect to distance. The slope of the curve depends on the type of field region near the antenna like static, radiating near-field and far-field regions.
In order to assess the nature of the field in off axis regions, readings were taken inθ = 90◦ plane at r= 3 m. Figure 2(d) shows the top view of HIRA and Eθ components of the electric field atφ= 0◦ to 180◦ angles inH-plane.
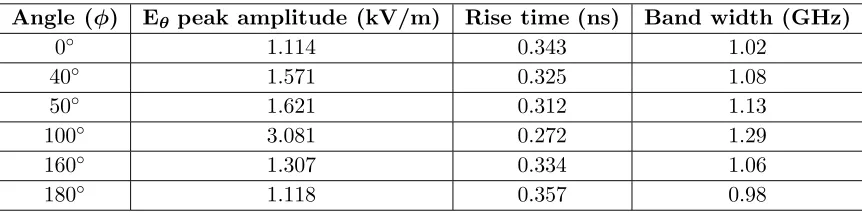
From Table 2, some observations can be drawn. For example, the response time gets poorer, and peak amplitude decreases as distance from boresight increases. The radiated pulse also gets expanded in time, as it loses many high frequency components on various off-boresight.
Table 2. Attributes of pulse in off-boresight.
Angle (φ) Eθ peak amplitude (kV/m) Rise time (ns) Band width (GHz)
0◦ 1.114 0.343 1.02
40◦ 1.571 0.325 1.08
50◦ 1.621 0.312 1.13
100◦ 3.081 0.272 1.29
160◦ 1.307 0.334 1.06
180◦ 1.118 0.357 0.98
3.3. CST Model
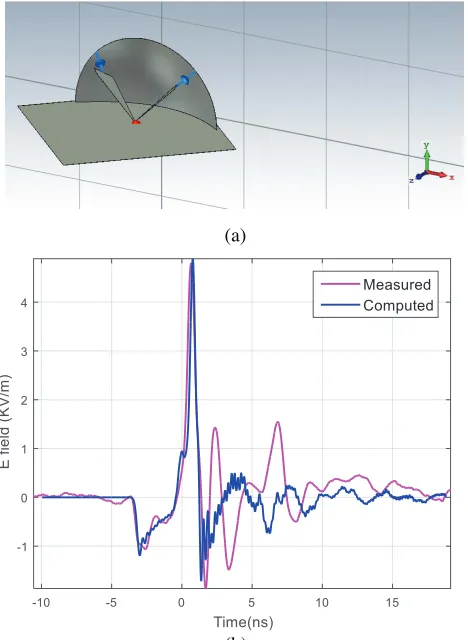
In order to study the radiation pattern of the HIRA, a CST Microwave Studio [12] tool has been used. For this purpose, a HIRA model, as shown in Figure 3(a), has been prepared, and its radiated field on the boresight has been computed and experimentally verified by the in site measurement as shown in Figure 3(b). Once the model has been verified, the radiation patterns are computed at various frequencies of the excitation pulse. The excitation signal is approximated to a double exponential pulse with a rise time of 0.1 ns and a peak voltage of 9.6 kV replicating pulser output voltage.
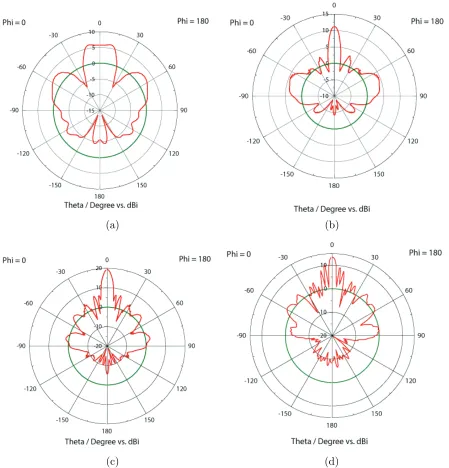
At lower frequencies such as 340 MHz and 640 MHz, the current distribution on the antenna feed arms is almost uniform, because of large wavelengths as compared to the physical size of feed arms; therefore, the radiation pattern assumes cardioid shape shown in Figure 4(a) and Figure 4(b). As the frequency increases, the antenna assumes its directive property, shown in Figure 4(c) and Figure 4(d). The antenna parameters are shown in Table 3.
4. FAR FIELD CHARACTERIZATION
Table 3. Parameters of radiation pattern.
Frequency (MHz) Gain (dBi) Angular width Side lobe level (dB)
350 6.09 33.7◦ −3.2
650 11.2 8.9◦ −6.6
1000 19.4 5.0◦ −12.5
1300 13.5 2.9◦ −5.5
(c)
(d)
(a)
(b)
Figure 3. (a) HIRA modelled in CST. (b) Comparison of measured and radiated E-fields at 2 m distance.
4.1. Measurement of Fields in Frequency Domain
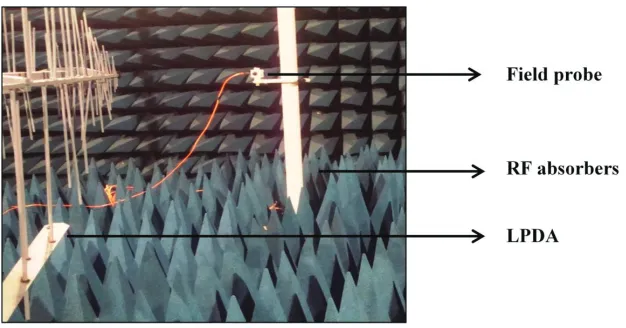
Experimental setup consists of a signal generator connected to the Log Periodic Dipole Antenna (LPDA) with help of power amplifier. A 3-axis isotropic field probe is used to measure the Er, Eφ and Eθ components of electric field as shown in Figure 5. LPDA operating in far-field region is excited with frequencies ranging from 200 MHz to 1.5 GHz, i.e., frequencies present in the frequency spectrum of the HIRA.
4.2. Determination of Far Field Distance
(a) (b)
(c) (d)
Figure 4. (a) Radiation pattern at 350 MHz. (b) Radiation pattern at 650 MHz. (c) Radiation pattern at 1 GHz. (d) Radiation pattern at 1.3 GHz.
5. PULSE DISPERSION
Due to penetration capabilities of UWB pulses through different types of materials, front door and back door couplings are possible to various utility buildings and electronic systems [15]. The responses of building to UWB fields are vital to provide an estimated level of protection [16].
5.1. Measurement of Dispersed Electric Fields
Figure 5. Experimental setup for far field characterization.
oscilloscope (DSO) placed inside the building as shown in Figure 7(a). At a distance of 3 m, the Eθ component which has undergone dispersion from wall was measured using a D-dot sensor as shown in Figure 7(b). The same procedure was also repeated for pillar and window. The level of attenuation offered by the three dispersive media relative to free space medium can be observed from the peak amplitude levels of the measured pulse as shown in Table 4.
Table 4. Peak values of dispersed time domain pulse to different obstacles.
Dispersion medium Amplitude of E-field (kV/m)
Free space 4.665
Wall 2.362
Window 1.565
Pillar 1.161
The thickness of the pillar was more than that of window and wall, so it offers attenuation to a greater extent. The window consists of iron grills making it possible to provide better attenuation but significant distortion to the UWB pulse. The spectrum of dispersed fields is shown in Figure 7(c). From the corresponding spectrums, the shielding effectiveness of three media at different frequencies is shown in Table 5.
Table 5. Attenuation offered by different dispersive media of interest.
Frequency (MHz) Attenuation offered in (dB) Wall Window Pillar
250 6 11.84 14.98
350 4.36 18.92 16
450 6.14 11.94 21.8
600 6.36 13.3 31
(a)
(b)
(c)
(d)
(a)
(b)
(c)
(a)
(b)
Figure 8. (a) Measurement of CM currents in cable to coupling of dispersed fields. (b) Measurement of CM voltages in cable to coupling of dispersed fields.
6. FIELD TO CABLE COUPLING
• Propagation occurs along the line axis.
• The sum of the line currents at any cross section of the line is zero. In other words, the ground — the reference conductor — is the return path for the currents in the overhead conductors.
• The response of the line to the coupled electromagnetic fields is quasi-transverse electromagnetic.
6.1. Measurement of Common Mode Responses to Coupling of Dispersed Fields
The experimental setup consists of HIRA placed at a distance of 2 m from the power cable of 10 m length. One end of the power cable is connected to 230 V, 50 Hz AC power supply, and the other end is connected to load of 150 Ω. The dispersed fields from the constituents of unprotected utility building will superimpose common mode (CM) currents onto the differential mode currents [20]. The orientation of the cable with reference to ground or plane of polarization of HIRA determines the amount of power coupled to the cable from radiated electromagnetic fields. Thereby, maximum coupling condition arises
Figure 9. Measured CM current and CM voltage on phase and neutral wires for maximum coupling case.
when cable is placed vertical to the ground such that electric field vector from antenna is parallel to it as shown in Figure 8(a). When the cable is placed horizontal to the ground plane, the electric field from HIRA is perpendicular to the cable that causes the minimum coupling case.
CM currents in two conductors of the cable were measured at the load ends using a current probe in both maximum and minimum coupling cases. The probe used was a 7427 model from Pearson electronics with a transfer impedance of 0.01 V/A. Similarly, CM voltages induced at the load ends were measured using BNC probes as shown in Figure 8(b). These induced responses travel towards the load end and gets reflected due to impedance mismatch. The reflected waves travel back and forth until the energy reaches zero, which can be observed from the Figures 9 and 10.
6.2. Measurement of Induced Transients
A transient voltage superimposed onto high frequency signals of digital circuits can cause undesired effects. It is possible to have transients on DC voltages obtained from switched mode power supply
Figure 11. Measurement of CM voltages on different dc lines.
(SMPS) output, which converts the infected AC voltages with transient voltages as shown in Figure 11. For lower conversion DC voltage levels, vulnerability of devices will increase due to high peak voltages of transients as observed in Figure 12.
7. MITIGATION MEASURES
Due to the lack of available empirical data, generally there are few assumptions considered for the mitigation effectiveness because electromagnetic pulse testing on large infrastructure systems, subsystems, and communications has effects of destructive nature [21]. In consequence, only a few mitigation measures were in practice, due to sparse availability of empirical data. Properly designed and installed metallic shieldings and Faraday cages can be employed to protect vulnerable electrical assets. This is generally not an approach that fits most civil infrastructures. For instance, a power system includes generation stations, transmission lines, substations, and distribution infrastructure. There is no practical way to completely shield such a geographically dispersed system. Mitigation of such a complex system must utilize measures such as redundancy and critical subsystem resistance to minimize damage and downtime to the overall system functionality.
8. CONCLUSION
From various experimental results, it is evident that IEMI may be a potential threat to power utility system and building encasing the unprotected electronic systems. Radiated fields of HIRA were studied along with characterization of its far field using computational and experimental methods. Further dispersion of UWB pulse due to utility building was studied experimentally. HIRA was used to create an IEMI environment inside a utility building through the wall penetrating capabilities of UWB source. In effect, field to cable coupling phenomenon takes place, and responses such as induced voltages and currents were measured at load terminals.
ACKNOWLEDGMENT
The authors acknowledge the motivation, research support and necessary testing hardware from Director, RCI (Research Centre Imarat), DRDO, Hyderabad, India and Centre for Excellence in Microwave Engineering (CEME), Osmania University, Hyderabad, India.
REFERENCES
1. Giri, D. V. and F. M. Tesche, “Classification of intentional electromagnetic environments (IEME),”
IEEE Transactions on Electromagnetic compatibility, Vol. 46, No. 3, 322–328, 2004.
2. Wilson, C., “High altitude electromagnetic pulse (HEMP) and high power microwave (HPM) devices: Threat assessments,” Library of Congress Washington DC Congressional Research Service, 2008.
3. Radasky, W. A., C. E. Baum, and M. W. Wik, “Introduction to the special issue on high-power electromagnetics (HPEM) and intentional electromagnetic interference (IEMI),” IEEE Transactions on Electromagnetic Compatibility, Vol. 46, No. 3, 314–321, 2004.
4. Giri, D. V., High-power Electromagnetic Radiators: Nonlethal Weapons and Other Applications, Harvard University Press, 2004.
5. Santini, L., G. B. Forleo, and M. Santini, “Implantable devices in the electromagnetic environment,”
Journal of Arrhythmia, Vol. 29, No. 6, 325–333, 2013.
6. Satav, S. M., “High power electromagnetic and its defence applications,” Science Day Oration Paper, EMI-EMC Technology Centre, Research Centre Imarat, Hyderabad, India, 2014.
8. Farr, E. G. and C. A. Frost, “Development of a reflector IRA and a solid dielectric lens IRA, Part I: Design, predictions, and construction,” Sensor and Simulation Notes 396, March 27, 1996.
9. Miller, E. K. (ed.), Time-domain Measurements in Electromagnetics, Springer Science & Business Media, November 30, 1986.
10. Farr, E. G. and G. D. Sower, “Design principles of half impulse radiating antennas,” Sensor and Simulation Note 390, December 1995.
11. Yao, L., et al., “Compensation of the offset in numerical integration of a D-dot sensor measurement,” 2014 3rd Asia-Pacific Conference on IEEE Antennas and Propagation (APCAP), 2014.
12. Romero, C., et al., “Modified ground plane geometry for a half impulse radiating antenna,” 2017 International Conference on IEEE Electromagnetics in Advanced Applications (ICEAA), 2017. 13. Benford, J., J. A. Swegle, and E. Schamiloglu, High Power Microwaves, CRC Press, 2016. 14. Balanis, C. A.,Antenna Theory and Design, Wiley India, 2016.
15. Backstrom, M. G. and K. G. Lovstrand, “Susceptibility of electronic systems to high-power microwaves: Summary of test experience,” IEEE Transactions on Electromagnetic Compatibility, Vol. 46, No. 3, 396–403, 2004.
16. Amin, M. G. (ed.), Through-the-Wall Radar Imaging, CRC Press, 2011.
17. Savage, E. and W. Radasky, “Overview of the threat of IEMI (intentional electromagnetic interference),” 2012 IEEE International Symposium on Electromagnetic Compatibility (EMC), IEEE, 2012.
18. Rachidi, F. and S. Tkachenko, Electromagnetic Field Interaction with Transmission Lines: From Classical Theory to HF Radiation Effects, Vol. 5, WIT Press, 2008.
19. Rakesh, K. and M. J. Thomas, “Interaction of high power electromagnetic pulses with power cables and electronic systems,” 2016 IEEE International Symposium on Electromagnetic Compatibility (EMC), 159–163, IEEE, 2016.
20. Paul, C. R., Introduction to Electromagnetic Compatibility, Vol. 184, John Wiley & Sons, 2006. 21. Ianoz, M., “A comparison between HEMP and HPEM parameters. Effects and mitigation