Available Online atwww.ijcsmc.com
International Journal of Computer Science and Mobile Computing
A Monthly Journal of Computer Science and Information Technology
ISSN 2320–088X
IJCSMC, Vol. 4, Issue. 7, July 2015, pg.529 – 536
RESEARCH ARTICLE
CLUSTERING HIGH DIMENSIONAL COMBINING
HUBNESS AND KERNEL MAPPING
Kavita R Dhoot, Prof. Manoj.N.Chaudhari
1
M.Tech.-CSE, Priyadarshini Bhagwati College of Engg, Nagpur, Maharashtra, India
2
CSE Department, Priyadarshini Bhagwati College of Engg, Nagpur, Maharashtra, India
1 [email protected]; 2 [email protected]
Abstract: Clustering high dimensional data becomes challenging due to the increasing
sparsity of such data. One of the inherent properties of high dimensional data is hubness
phenomenon, which is used for clustering such data. Hubness is the tendency of
high-dimensional data to contain points (hubs) that occurs frequently in k-nearest neighbor lists of
other data points. The k-nearest-neighbor lists are used to measure the hubness score of each
data point. The simple hub based clustering algorithms detect only hyperspherical clusters in
the high dimensional dataset. But the real time high dimensional dataset contains more
number of arbitrary shaped clusters. To improve the performance of clustering, a new
algorithm is proposed which is based on the combination of kernel mapping and hubness
phenomenon. The proposed algorithm detects arbitrary shaped clusters in the dataset and also
improves the performance of clustering by reducing the intra-cluster distance and maximizing
the inter-cluster distance thus improving the cluster quality.
Keywords
1. INTRODUCTION:
Clustering is an unsupervised process of grouping elements together. A cluster is a collection
of data objects that are similar to one another within the same cluster and are dissimilar to the
objects in other clusters. There are different clustering techniques which, such as hierarchical,
partitional, and density-based and subspace [1]. Clustering methods can be used for detecting
the underlying structure of the data distribution. Algorithms from the fourth group search for
clusters in some lower dimensional projection of the original data, and have been generally
preferred when dealing with data that are high dimensional [2], [3], [4], [5].
Partitional clustering methods start with an initial partition of the observation and optimize
these partitions according to utility function or distance function. Hierarchical clustering
methods works by grouping data objects into a tree of clusters. It can be further classified as
either agglomerative or divisive, depending on whether the hierarchical decomposition is
formed in a bottom-up or top-down fashion. Density-based clustering methods regard clusters
as dense regions of objects in the data space that are separated by regions of low density.
Subspace clustering methods search for groups of clusters within different subspaces of the
same data set. This paper mainly focused on partitional clustering. To overcome the problems
in partitional clustering methods on high dimensional data, a new algorithm which is based
on combination of kernel mappings [7] and hubness phenomenon[6].
The rest of the paper is structured as follows. In the next section we present the related work
on this research, Section 3 presents the discussion of Kernel Principal Component Analysis,
while Section 4 discusses the hubness phenomenon, Section 5.describes the kernel hubness
clustering. Section 6 presents the experiments we performed on the real world dataset.
2) RELATED WORK:
Applications of hubness have been investigated in other fields: classification, data reduction,
image feature representation , text retrieval , collaborative filtering and music retrieval [4].
The emergence of hubs had been noted first in analyzing music collections. The researchers
Hubness is a good measure of point centrality within a high-dimensional data cluster and that
major hubs can be used effectively as cluster prototypes , Also, global hubness estimates are
generally to be preferred with respect to the local ones.was thoroughly discussed in [9].
In high dimensional data, it is difficult to estimate the separation of low density regions and
high density regions due to data being very space [3],[5]. It is necessary to chose the proper
neighborhood size, because both small and large values of k can cause problems for density
based approaches.
Kernel k-means maps data points from the input space to the high dimensional
feature space through a non-linear transformation [10]. The kernel based clustering
minimizes the clustering error in feature space.
It is believed that the kernel k-means, which is used with the non-parametric histogram
intersection kernel [6], is good for image clustering. In this paper we have proposed a new
clustering algorithm which uses the concept of kernel and hubness phenomenon.
3. KERNEL PRINCIPAL COMPONENT ANALYSIS
The main purpose of principal component analysis (PCA) is the analysis of data to identify
patterns that represent the data "well." The principal components can be understood as new
axes of the dataset that maximize the variance along those axes (the eigenvectors of the
covariance matrix). In other words, PCA aims to find the axes with maximum variances
along which the data is most spread. A common application of PCA is to reduce the
dimensions of the dataset with minimal loss of information.
The PCA approach is a linear projection technique that works well if the data is
linearly separable. However, in the case of linearly inseparable data, a nonlinear technique is
required if the task is to reduce the dimensionality of a dataset. Thus KPCA, an extension of
principal component analysis (PCA) is used. This uses techniques of kernel method. Kernel
PCA captures nonlinear structure in the data .since a linear PCA performance in the feature
space corresponds to a nonlinear projection in the original data space. It can extract up to n
(number of samples) nonlinear principal component. Kernel PCA gives good reencoding of
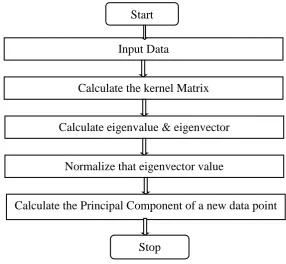
Fig 3.1: System Flow of Kernel Principal Component Analysis (KPCA)
4) HUBNESS PHENOMENON
Hubness is an act of high dimensional data to contain points that frequently occur in
k-nearest neighbor lists of other points. Let S ⊂ Rd be a set of high dimensional data points and let Nk(y) denote the number of k-occurrences of point y ∈ S, i.e., the number of times y occurs in k-nearest neighbor lists of other points from S. Hubness is an inherent property of
high dimensional data which is related to distance concentration phenomenon [4]. The
number of k-occurrences of point y ∈ S is referred as hubness score in rest of the text. The frequently occurring data points in k-neighbor sets are referred as hubs and very rarely
occurring points are referred as anti-hubs.
4.1 Appearance of Hubs
The concentration of distances enables to view unimodal high dimensional data lying
on a hyper sphere centred at the data distribution mean. The variance of distances to the mean
remains non-negligible for any countable number of dimensions, which indicates that some Calculate the kernel Matrix
Start
Calculate eigenvalue & eigenvector Input Data
Normalize that eigenvector value
Calculate the Principal Component of a new data point for finding hub
probability of being included in k-nearest neighbor sets of other points in the dataset, which
increases their ability, and they emerge as neighbor-hubs.
4.2 Relation of hub to centroid and medoid
In low dimensional data hubs in the clusters are far-off from the centroids, even out of
average points. There is no relationship between cluster means and frequent neighbors in the
low dimensional environment [2]. This fact may changes with the increase in dimensionality.
The minimal distance from centroid to hub converges to minimal distance from centroid to
medoid. This concept implies that some medoids are actually cluster hubs. As medoids the
centroids are also closer to data hubs. This relationship brings us to get an idea that the points
with high hubness scores are closer to centres of clustered sub regions of high dimensional
space than other data points in the dataset. Hence these points can act as cluster
representatives [4].
[5] KERNEL BASED HUBNESS CLUSTERING (KHC)
Hubness is viewed as a local centrality measure and is possible to use it for clustering high
dimensional data in various ways. There are two types of hubness, namely global hubnessand
local hubness [2]. Local hubness can be defined as a restriction of global hubness on any
given cluster of the current algorithm iteration. Local hubness score represents the number of
k-occurrences of a point in k-nearest neighbor lists of elements within the same cluster.
Global hubness represents the number of k-occurrences of a point in k-nearest neighbor lists
of all elements of the dataset. This global hubness is used for determining the number of
clusters automatically.
The high dimensional data contains more number of attributes, in which some
attributes are more important for representing the data points. In order to identify the
important attributes in the dataset, the Kernel Principal Component Analysis is used. The
kernel principal components are used for defining the kernel function. By using the kernel
function[6] , i.e., an appropriate non-linear mapping from the original input space to a higher
dimensional feature space, clusters that are non-linearly separable in input space can be
Algorithm 1 KHC
Input: Kernel matrix K, number of clusters k, initial clusters C1, C2, C3…,CK.
Output: Final clusters C1, C2, C3…,CK.
1: for all points xn n=1,2,...,N do
2: for all clusters Ci=1 to k do
3: Calculate distance between hub and other points using
kernel function
4: end for
5: find optimal distance
6: end for
7: for all clusters Ci=1 to k do
8: Update cluster Ci
9: end for
10: if converged then
11: return final clusters C1, C2, C3…,CK.
12: else
13: gotostep1
14: end if
Real world data often contains noisy or erroneous values due to the nature of the
data-collecting process. It can be assumed that hub-based algorithm will be more robust with
respect to noise, since hubness-proportional search is driven mostly by the highest hubness
element, not the outliers For experiment UCI iris dataset was taken. The proposed algorithm
is executed on this dataset and the cluster quality is measured.Fig6.2 shows final entropy vs.
noise graph k-means score comparably well on iris dataset which is 4-dimensional.
Fig 6.2 : Shows cluster quality measures with rising noise levels.
References:
[1] J. Han and M. Kamber, Data Mining: Concepts and Techniques,2nd ed. Morgan Kaufmann Publishers, 2006.
[2] C. C. Aggarwal and P. S. Yu, “Finding generalized projected clusters in high dimensional spaces,” in Proc.
26th ACM SIGMOD Int. Conf. on Management of Data, 2000, pp. 70–81.
[3] K. Kailing, H.-P.Kriegel, P. Kr ¨oger, and S. Wanka, “Ranking interesting subspaces for clustering high dimensional data,” in Proc. 7th European Conf. on Principles and Practice of Knowledge Discovery in
Databases (PKDD), 2003, pp. 241–252.
[4] K. Kailing, H.P. Kriegel, and P. Kroger, “Density-connected subspace clustering for high-dimensional data,”
in Proc. 4th SIAM Int. Conf. on Data Mining (SDM), 2004, pp. 246–257.
[5] N. Tomasev, R. Brehar, D. Mladenic, and S. Nedevschi (2011), “The influence of hubness on nearest-neighbor methods in object recognition,” in Proc. 7th IEEE Int. Conf. on Intelligent Computer Communication and Processing (ICCP), pp. 367–374
[6] Grigorios F. Tzortzis and Aristidis C. Likas,(2009), “The Global Kernel K-Means Algorithm for Clustering in Feature Space” IEEE Transactions on Neural Networks, Vol. 20. No. 7,PP:1181-1194.
[7] Jean-JulienAucouturier and Francois Pachet.” A scale-free distribution of false positives for a largeclass of audio similarity measures”,Pattern Recognition, 41(1):272–284, 2007.
[8]Tony Jebara, Jun Wang, and Shih-Fu Chang. Graph construction and b-matching for semisupervisedlearning.
In Proceedings of the 26th International Conference on Machine Learning(ICML), pages 441–448, 2009.
[11] C.-T. Chang, J. Z. C. Lai, and M. D. Jeng (2010), “Fast agglomerative clustering using information of k-nearest neighbors,” Pattern Recognition, vol. 43, no. 12, pp. 3958–3968.
[12] R. Xu, D. Wunsch (2005), “Survey of clustering algorithms,” IEEE Transactions on Neural Networks 16 (3) pp. 645–678.
[13] Nanopoulos A., M. Radovanovi´c, and M. Ivanovi´c (2009), “How does high dimensionality affect collaborative filtering?” in Proc. 3rd ACM Conf. on Recommender Systems (RecSys), pp. 293–296.
[14] A.K. Jain, M.N. Murty, P.J. Flynn (1999), “Data clustering: a review,” ACM Computing Surveys 31 (3) pp. 264–323.