NON-PERFORMING LOANS AND FINANCIAL PERFORMANCE OF COMMERCIAL
BANKS IN KENYA
BY
TOWETT BENARD CHERUIYOT
D53/MSA/PT/32059/2015
A RESEARCH PROJECT SUBMITTED IN PARTIAL FULFILMENT FOR THE
REQUIREMENT OF THE AWARD OF THE DEGREE OF MASTER OF BUSINESS
ADMINISTRATION IN FINANCE, KENYATTA UNIVERSITY
ii
DECLARATION
This project is my original work and has not been presented for a degree in any other University.
Signature: ……… Date: ………
TOWETT BENARD CHERUIYOT
D53/MSA/PT/32059/2015
SUPERVISOR’S DECLARATION
I confirm that this research project has been carried out under my supervision.
Signature……… Date……….
DR. PETER NG’ANG’A
LECTURER,
DEPARTMENT OF ACCOUNTING AND FINANCE
SCHOOL OF BUSINESS
iii
ACKNOWLEDGEMENT
First and foremost I thank the Almighty God for the gift of life, good health, wisdom, knowledge
and for enabling me reach this far. I thank my wife Lilian Towett for moral support,
encouragements and her unconditional support during the entire research period. I thank my
supervisor and colleagues at my place of work who gave me ample time during the entire course. I reckon the commitment of my university supervisor Dr. Peter Ng‟ang‟a of the Department of
Accounting and Coordinator School of Business Kenyatta University, who tirelessly reviewed
and gave me feedback on this project.
I thank my children Joy, Samantha and Tamara Towett who strongly believed in me and always
iv
TABLE OF CONTENT
DECLARATION... ii
ACKNOWLEDGEMENT... iii
ABBREVIATIONS AND ACRONYMS ... vii
ABSTRACT ... viii
CHAPTER ONE:...1
INTRODUCTION ...1
1.1 Background to the Study: ...1
1.1.1 Non-Performing Loans in Kenya ...2
1.1.2 Financial performance of commercial banks in Kenya...3
1.1.3 Non-performing loans and financial performance of commercial banks...7
1.1.4 Commercial banks in Kenya ...9
1.2 Statement of the Problem ... 11
1.3 Objectives of the study ... 12
1.3.1 General Objectives of the Study ... 12
1.3.2 Specific objectives: ... 12
1.4 Research Hypothesis ... 13
1.5 Significance of the Study... 13
1.6 Scope of the Study ... 14
1.7 Limitation of the Study... 15
CHAPTER TWO:... 16
LITERATURE REVIEW ... 16
2.1 Introduction... 16
2.2 Theoretical Framework ... 16
2.2.1 The Credit Crunch Theory... 16
2.2.2 The Moral Hazard and unobservable behavior concept ... 17
2.2.3 Theory of performance... 18
2.3 Empirical Literature Review ... 20
2.3.1 Size as a determinant of Non-Performing Loans and performance... 20
2.3.2 Age as a determinant of Non-Performing Loans and performance ... 22
2.3.3 Cost as a determinant of Non-Performing Loans and performance ... 23
2.3.4 Collateral as a determinant of Non-Performing Loans and performance ... 25
2.4 Summary of the Literature Review and research gaps... 27
v
CHAPTER THREE:... 30
RESEARCH METHODOLOGY ... 30
3.0 Introduction... 30
3.1 Research Design ... 30
3.2 Target Population ... 30
3.3 Sampling Technique and Sample Size ... 31
3.4 Data Collection instrument ... 31
3.5 Data collection procedure ... 32
3.6 Data Analysis and Presentation ... 32
3.6.1 Regression model ... 33
3.7.2 Test of significance... 34
CHAPTER FOUR: ... 35
DATA ANALYSIS AND PRESENTATION ... 35
4.0 Introduction... 35
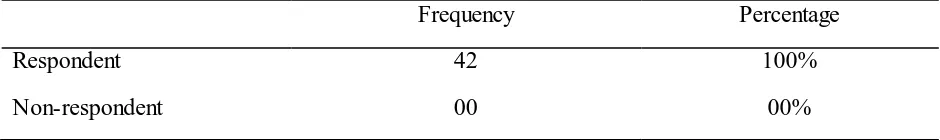
4.1 Response rate ... 35
4.2 Validity ... 36
4.3 Descriptive statistical analysis ... 36
4.3.1 The financial performance of commercial banks in Kenya... 37
4.3.2 Size of nonperforming loans of commercial banks in Kenya ... 38
4.3.3 Age of non-performing loans of commercial banks in Kenya ... 41
4.3.5 Cost of non-performing loans of the commercial banks in Kenya ... 46
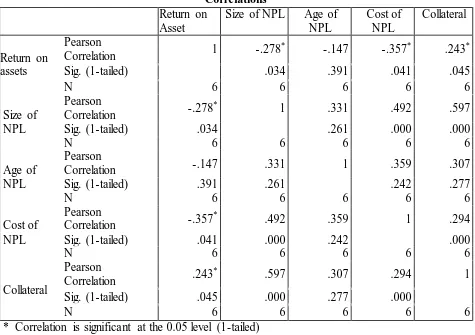
4.4 Inferential statistics... 47
4.4.1 Correlation analysis... 48
4.4.2 Regression Analysis ... 49
CHAPTER FIVE: ... 54
SUMMARY, CONCLUSIONS AND RECOMMENDATIONS ... 54
5.1 Introduction... 54
5.2 Summary of the study ... 54
5.2.1 Size of nonperforming loan and financial performance of commercial banks in Kenya ... 54
5.2.2 Age of nonperforming loans and financial performance of commercial banks in Kenya... 55
5.2.3 Collateral of non-performing loans and financial performance of commercial banks in Kenya ... 55
5.2.4 Cost of non-performing loans and financial performance of commercial banks in Kenya ... 56
vi
5.4 Recommendations... 57
5.4.1 Suggestions further research... 58
References... 59
vii
ABBREVIATIONS AND ACRONYMS
CBK – Central Bank of Kenya
IFRS – International Financial Reporting Standards
KBA – Kenya Banker‟s Association
KCB – Kenya commercial bank
KRA – Kenya Revenue Authority
NPLs – Non-Performing Loans
MFI – Micro Financial Institutions
ROA - Return on Asset
ROE – Return on Equity
viii ABSTRACT
1
CHAPTER ONE:
INTRODUCTION
1.1 Background to the Study:
All financial institution all over the world are facing the enormous risks of the non-performing
loans which has led to the decline in the portfolio quality of the non-performing loans (Hurt
2011). This retrogression has been the nerve center for both the distress among the financial
institutions and the economic financial crisis in both developed and developing countries in the
world. Financial institutions need to put in place mechanisms in monitoring the behaviors of
borrower. There has been an increased credit risk management for both the lender and the
borrowers more so in the Sub-Saharan Africa since 1990‟s. This has been a result of the lending
policies that exists in Africa as a whole. Moreover, the financial institutions need to review their
lending policies. According to the recent studies by Victor (2016), the basic functional responsibilities related to lending include; assessment of potential borrower‟s credit risk; making
the credit granting decision in tandem with credit terms and limits; collecting receivables as they
fall due and dealing with defaulters; monitoring borrower‟s behavior and compiling management
report; bearing the risk of default or bad debt; and financing the investment in receivables.
The non-performing loans have been on a sharp upward trend, recording Ksh. 176 billion as at
March 2016, (Victor 2016). Bad loans at end of March 2016 stood at eight per cent of the total
loans issued by banks up from 6.1 per cent in December and 4.6 per cent in June 2015 as per the
regulator, (Victor 2016). The non-performing loans are not in existence for any particular
2
Financial institutions in Kenya are equally facing loan defaults with individual defaulters turning
out to be of high numbers as compared to group loan defaulters.
1.1.1 Non-Performing Loans in Kenya
Non-performing loans are loan amount that the borrower is not making any repayment on the
principal amount, interest amount or both for a period of more than 90 days (CBK 2013) .The
loan will become non-performing depending the stipulated regulations that the bank or that
which is put forth by the monetary regulatory authority (Gatere, 2012). In Kenya, the prudential
guidelines of the Central bank of Kenya reveals that advances are classified into five categories
namely; normal, watch, substandard, doubtful debts and loss. Normal category includes
well-documented facilities to financially sound clients where no weaknesses exist. Such advances
must not have been rescheduled (CBK, 2013). Watch includes good accounts that are always
maintained and classified under normal but have exhibited some specific weaknesses (CBK,
2013). Substandard are facilities which though still operative involve some degree of risk and
there exists possibility of some future loss unless close supervision is given and corrective action is taken to strengthen the position, for instance, three months‟ installments in arrears, (Kereta,
2011). Major weaknesses therefore exist on the advances issued on doubtful debts. The recovery
of full amount outstanding might need to be extended or is doubtful and that loss will occur.
Both the financial institutions and the economy at large are being affected by the non-performing
loans. According to Klein (2013), the financial crisis of 2008 had an enormous effect on the
individual financial performance of financial institutions as well as far reaching macroeconomic
3
results to difficulties in financing other institutions or even the other borrowers at stake. More
resources therefore have to be committed towards provisions for the non-performing loans and
additional costs will be spent in financing recovery efforts. These costs and the provisions
consume a large portion of the returns that is earned by the financial institutions thus
decelerating their financial performance.
The level of non- performing loans in the financial institutions also determines how sustainable a
financial institution can be. Studies show that non-performing loan level is one of the major
determinants of financial performance of the financial institutions, (Kereta, 2011). It is therefore
evident that non-performing loans are very crucial when determining the level of financial
performance that can be attained by the financial institutions. (Mwangi, 2012), explains an
inverse relationship between the amount of non-performing loans and the financial performance.
In the case when the non-performing loans are high, the financial performance measured by
return on asset is low and vice versa. A similar opinion also on the same edge ascertains that
non-performing loan management practices determine the financial performance on an
organization. This therefore insinuates that the non-performing loan management practices have
the potential of enhancing the financial performance of an organization.
1.1.2 Financial performance of commercial banks in Kenya
The commercial banks in Kenya have grown in customer deposits, loan book, capital reserve,
and profitability over the years. There has been relatively insignificant change in the number of
commercial banks during the study period. As at 31st December 2011, the banking sector
4
December 2016, there were 43 banking institutions of which 42 were commercial banks and 1
mortgage finance company (CBK 2016). A number of banks have been put under receivership
such as Dubai Bank on 14/08/2015, Imperial Bank Limited on 13/10/2015 (CBK 2015) and
Chase Bank Limited on 07/04/2016 (CBK 2016).
The banking sector in Kenya and commercial banks in particular have been registering a decline
in return on assets despite year on year improvement in profitability during the period under
study. According for CBK report of 2012 detailing the banking industry performance, the pre-tax
profit for the commercial banks increased by 20.6 percent from Ksh. 89.5 billion in December
2011 to Ksh. 107.9 billion in December 2012. The return on assets increased from 4.4% in 2011
to 4.7% in 2012. The growth was largely attributed to income generated by increased loans and
advances coupled with regional expansion initiatives (CBK 2012). During the period ended
December 2013, the sector recorded a 16.6 percent growth in pre-tax profits (CBK 2013) with
the return on assets remaining constant at 4.7%. This was followed by a 12.2 percent increase in
pretax profit Ksh.125.8 billion in December 2013 to Ksh.141.1 billion in December 2014 (CBK
2014) however, the return on assets decreased to 3.4%. The banking sector registered declined
performance in 2015 with profit before tax decreasing by 5.03 per cent from Ksh. 141.1 billion
in December 2014 to Ksh. 134.0 billion in December 2015 (CBK 2015) in this period, the return
on assets also reduced to 2.9%. In 2016 there was an increase of 10.91 percent in pretax profit to
147.4 billion in December 2016 (CBK 2016). The return on assets also improved to 3.3%.
5
Commercial banks have been recording an upward trend in the growth of customer deposits
during the period under study. The number of customer deposits was Ksh 1.48 trillion as at
December 2011, in December 2012, the deposit was Kes 1.707 trillion growing by 14.76% (CBK
2012). As at December 2013, the customer deposit was Ksh 1.935 trillion with a 13.34 growth
(CBK 2013). In December 2014, the customer deposit was Ksh 2.292 trillion being an 18.42%
growth (CBK 2014). In 2015 December, the deposits grew to Ksh 2.485 trillion which was an
8.5% growth. Customer deposits, which are the main source of funding for the banks grew by
5.3 percent from Ksh 2.485 trillion in December 2015 to Ksh 2.618.4 trillion in December 2016.
The growth was supported by mobilization of deposits through agency banking and mobile
phone platforms (CBK 2016)
CBK banking industry annual report on commercial banks from 2011 to 2016 indicates an
increase in the capital and reserve. In 2016, the commercial banks capital and reserve was Ksh
597.5 billion. The general increase in capital and reserves is attributable to additional capital
injections by commercial banks to meet the statutory capital adequacy requirements and exploit
business opportunities (CBK 2016). In 2011, 2012, 2013, 2014 and 2015 the capital reserve was
Ksh 282.717 billion, Kes 362.182 billion, Kes 432.178 billion, Ksh 501.733billion and Ksh
540.578 billion respectively. This represented a Ksh 314.783 billion increase in capital reserve
which was a 111.34 % increase from 2011 to 2016.
Facility advances to the customer have as well experienced significant growth. Net loans and
advances from commercial banks was Ksh 1.152 trillion in 2011. There was a 12.5 percent
6
of 18.2 percent from Ksh. 1,532.4 billion in December 2013 (CBK 2013). This was followed by
a 22.75% increase to Ksh 1.881 trillion in December 2014 (CBK 2014) and an 11.02% to Ksh
2.091 trillion in December 2015 (CBK 2015) and finally a 4.36 percentage increment to Ksh
2.182 trillion. This represents an average of 13.766 year on year growth in the loan book of
commercial banks. Similarly, this was a Ksh 1.03 trillion growth in actual net loan book value
from 2011 December to 2016 December.
Despite the above increase in the profits before tax, customer deposits, net loan and advances
and capita reserve, the quality of the commercial banks loan book has been on the down ward
trend. That is, the level of nonperforming loans has been increasing over the years. This exposes
the commercial banks to risk of not collecting the funds loaned to customers. According to the
CBK 2012, high interest regime witnessed in the first half of 2012 impacted negatively on the
quality of loans and advances. As a result, nonperforming loans increased by 16.8 percent from
Ksh. 53.0 billion in December 2011 to Ksh. 61.9 billion in December 2012. Similarly, the ratio
of gross NPLs to gross loans increased from 4.4 percent to 4.7 percent in December 2012. As at
31/12/2013 the nonperforming loans in commercial banks was Ksh 81.9 billion being 5.2% of
the gross loan book for the year (CBK 2013). In 2014, the nonperforming loan stood at Ksh.
108.3 billion being 5.6% of the gross loan book value (CBK 2014). As at 31/12/2015, the
nonperforming loan was Ksh. 147.3 billion being 6.8% on the gross loan book (CBK 2015) and
as at 31/12/2016, the nonperforming loan book stood at Kes 214.3 billion being a 45.5% increase
and 9.2% of the gross loan book value (CBK 2016). The CBK 2016 notes that a challenging
business environment witnessed during the period under review impacted negatively on the
7
from public and private entities and poor weather conditions. Form the CBK reports of 2011 to
2016, there was a steady increase in the percentage of nonperforming loans to the gross loan
book value from 4.4% in 2011 to 9.2% in December 2016.
1.1.3 Non-performing loans and financial performance of commercial banks
CBK (2013) prudential guideline categorizes loan in to five categories that is; normal, watch,
substandard, doubtful and loss categories. Non-performing loans are loans that either the
principle advanced or the interest earned or both are more than ninety days past due (CBK 2013).
Such loans starts from the substandard loans, to doubtful loan category and finally to loss as per
the CBK (2013) prudential guideline. Interest earned in loan and advances are the major source
of profits to commercial banks and therefore a non-performance of loans and advances. Klein
(2013), noted that non-performing loans will effect profitability of banks which is their main
profit source. Eyup (2017), stated that an increase of the non-performing loans decreases bank
profitability and a decrease of the non-performing loans increases bank profitability. (Victor
2016). The non-performing loans are not in existence for any particular institution or even an
economy but they affect both developed and developing economies. . (Victor 2016). The
non-performing loans are not in existence for any particular institution or even an economy but they
affect both developed and developing economies. According to Klein (2013), the financial crisis
of 2008 had an enormous effect on the individual financial performance of financial institutions
as well as far reaching macroeconomic effects in most countries around in the world.
(Mwangi, 2012), explains an inverse relationship between the amount of non-performing loans
8
performance measured by return on asset is low and vice versa. Al-Kunari (2010) used panel
data and identity firm size as a factor influencing non-performing loans and the overall financial
performance of the commercial banks. Von Pischke (1991) noted that efficient loan sizes fit borrowers‟ repayment capacity and stimulate enterprise. Hietalahti& Linden, (2006) observed
that loans that are too big also lead to repayment problems, dissatisfaction and high dropouts.
According to Klein (2013), non-performing loans will effect profitability of banks which is their
main profit source and ultimately financial stability of economy. Kanyiri, (2015) stated that some
banks faced the challenge of declining profitability as a result of provisioning for nonperforming
loans. Abel (2014), stipulates that there is a negative relationship between the non-performing
loans and performance for commercial banks. Muniappan (2002) non-performing loans effects
not only the profitability of banks by way of bearing costs of an asset that is not able to provide
income but also negatively effects the capital adequacy. Korir (2011) noted a positive
relationship between credit risk management practices and the financial performance of Deposit
taking microfinance institutions in Kenya. More strict credit risk practices eliminate potential
bad loss and therefore increases the financial performance. Kroszner, (2015), non- performing
loans are closely associated with banking crises. Fawad and Taqadus, (2014) in their study of
also the explanatory power of bank specific variables as determinants of nonperforming loans in
Pakistan banking sector between 2006-2011 involving of 30 banks in Pakistan, observed that NPLs affects the bank‟s financial performance. CBK (2013) require commercial banks to make
loan loss provisions for non-performing loans. Such provisions reduce the financial performance
of commercial banks. Klein (2013) noted that banks commits resources towards provisions for
the non-performing loans and additional costs are spent in financing recovery efforts. CBK
9
balance sheet when banks lose control of the contractual rights over the loans or when all or part
of a loan is deemed uncollectible or there is no realistic prospect of recovery. Such loan write-off
negatively affects the financial performance of the commercial banks as the banks are unable to
recover the principal advanced to customer and the interest on the same.
1.1.4 Commercial banks in Kenya
According to CBK development of banking report 2010, commercial banks in Kenya stated with
Indian Money lender in the 18th Century. In 1896, the National Bank of India Established a
branch in Mombasa and in 1904 opened a branch in Nairobi. The Kenya banking industry has
experienced minimal change in the number of commercial banks in the recent past. As at 31/12/
2011, the banking sector comprised of the Central Bank of Kenya, as the regulatory authority, 44
banking institutions that is 43 commercial banks and 1 mortgage finance company, (CBK 2011).
Out of the 44 banking institutions, 31 locally owned banks comprise 3 with public shareholding
and 28 privately owned while 13 were foreign owned. In 2017, the banking industry consisted of
43 commercial banks that is; 25 local private commercial banks, 3 local public commercial
banks and 15 foreign owned commercial banks (CBK, 2017).
Recent regulatory development has seen the CBK issued a Cyber Security Guidance Note on
August 27, 2017 (CBK 2017), interest rate capping in 2016 (CBK 2016), regulation on foreign
currency exchange dealing in 2016 (CBK 2016), video teller machine- used in what is commonly known as „video banking‟ for performing banking transactions or professional banking
conversations via a remote video connection. This is mostly performed via purpose built banking
10
transparency in pricing of credit, CBK together with the Kenya Bankers Association (KBA)
developed an on-line website portal aimed at providing information on lending rates and charges
offered by licensed banks. The portal is designed to enable users compare the price of credit
from various banks (CBK 2017).
There has been grown in the financial performance of commercial banks in Kenya, for example
the return on assets for commercial banks in Kenya was 4.4% in 2012 (CBK 2012) and 2.7 in
2017 (CBK2017). The industry has seen growth in customer deposits, Ksh 1.24 trillion as at
December 2010, in December 2017, the customer deposits were Kes 2.86 trillion in December
2017 (CBK 2017). The net loans advanced to customer was Kes 914.9 billion in December 2010
(CBK 2010), the loan book grew to Kes 2 trillion in 2017 (CBK 2017). The total assets in 2017
was Kes 3.9 trillion while in 2010, the total assets was Kes 1.6 trillion There has been growth
non-performing loans as well, NPL was 2.1 percent recorded in 2010, however, the NPL was
12.3 percent in 2017.
The commercial banks in Kenya have experience turbulence in the recent past with three
commercial banks put under receivership and statutory management. These were Imperial Bank
Limited in 2015 (CBK 2015), Dubai Islamic Bank in 2015 (CBK 2016) and Chase Bank Limited
in 2016(CBK 2016). The total number of commercial banks under statutory management was
four as at December 2017, these were; Charterhouse Bank, Imperial Commercial Bank & Chase
11 1.2 Statement of the Problem
The banking sector in Kenya has played an important role through the regulators namely Central
Bank of Kenya and the Kenya Bankers Association, in providing the financial services to the
people. The CBK under its new leadership of Dr. Patrick Njoroge has recommended for
capitalization policy using a risk based approach. This led to the increase in the total capital to
risk-weighted assets ratio increased to 14.5% up from 12% necessitated by the need to ensure
banks are able to absorb the market shocks such as bad loans. The sharp increase in provisions
has led to depressed earnings with some banks posting losses for the year 2015. Three other
banks namely Chase Bank Kenya Limited, Imperial bank Limited and Dubai Bank Limited were
placed under receivership from the year 2015. Most of the big lenders doubled their provisions
for non-performing loans between year 2014 and 2015 (Kimotho, 2016). From January 2016 to
March 2016, banks did experience a Sh.36.6 billion rise on bad debts.
The commercial banks, as per CBK guidelines are required to determine their bad and doubtful
debts provisions in accordance to the International Financial Reports Standards (IFRS) and at the same time the banks ought to be submissive to the taxman through the Commissioner‟s
guidelines on the account calculating the Income Tax liability (Rose, 2012). In IFRS guidelines,
under IAS 39, highlights that an entity such as a bank is supposed to assess at each balance sheet
date whether there is any objective evidence that a financial asset or a group of financial assets is impaired (Kimotho, 2016). Under the commissioner‟s guidelines, a bad debt is considered
deductible once it is proved beyond reasonable doubts that it has become uncollectable and that
12
recovery steps and value judgment. The determination of recoverability of a bad loan is more
often than not a tough judgment calls to make.
The Kenyan commercial banks have not been spared from the threat of increased
non-performing loans especially owing to the fact that a large portion of the commercial banks have
huge levels of provisions, medium to high asset quality ratios and also have advanced credit card
facilities to their customers which was contributor to the American banks increased losses from
the global financial crisis. Moreover, there has been need to expand the research on
non-performing loans and financial performance both internationally and locally. Therefore, question
addressed in the study was: what were the effects of nonperforming loans on the financial
performance of commercial banks in Kenya? The study broke down components of
nonperforming loans such as size, age, collateral and cost and assessed their relationship with the
return to assets of commercial banks in Kenya over a five year period from 2011 to 2016.
1.3 Objectives of the study
The study was guided by both the general and the specific objectives.
1.3.1 General Objectives of the Study:
To determine the relationship between non-performing loans and financial performance of
commercial banks in Kenya
1.3.2 Specific objectives:
i. To examine the relationship between the size of nonperforming loans on financial
13
ii. To investigate the relationship between age of non-performing loans and financial
performance on commercial banks.
iii. To identify the relationship between collateral of non-performing loans with
respect to financial performance of commercial banks.
iv. To determine the relationship between cost of non-performing loans and the
performance of the commercial banks.
1.4 Research Hypothesis
i. There is no significant relationship between the size of non-performing loans and
the financial performance of commercial banks?
ii. There is no significant relationship between the nonperforming loans‟ age and the
financial performance commercial banks‟?
iii. There is no significant relationship between collateral of non-performing loans and
the financial performance of commercial banks?
iv. There is no significant relationship between the cost of non-performing loans and
the financial performance of commercial banks?
1.5 Significance of the Study
This study aimed at contributing to the existing knowledge base on non-performing loans by
addressing the existing gap from the previous research studies on non-performing loans. The
study shed light on the key factors affecting the non-performing loans on the financial
performance of commercial banks in Kenya. This study was to be a key indicator as a reference
14
This study would be useful to the banking sector, more so on the commercial banks‟ managers in
the necessity to progress and identify key factors affecting performance. The employees of the
commercial banks will also have insight in the overall performance of the organization and
appreciate the importance of control operations as this may affect their future career in the
banking sector.
The investors also would use the study to overlook and see the best investment decisions based
on the overall losses from the financial statements and taking into consideration the
non-performing loans. The study would inform investors that the overall level of non-non-performing
loans may affect their return on investment.
Since NPL is a component of asset quality and financial performance is a factor of economic
growth, there is room for further research to identify correlations of asset quality on economic
growth. Further there is a gap to identify the effect of NPLs on commercial banks‟ financial
performance, especially after the downfall of three commercial banks in Kenya.
1.6 Scope of the Study
The study intended to identify the key effects of non-performing loans on the financial
performance of commercial banks in Kenya, putting more emphasis on the liquidity measures,
solvency measures as well as profitability measures with non-performing loans, the resources
which had to be committed towards the provisions for the non-performing loans and the
15
commercial banks lose every year due to non-performing loans from the branch level to the
overall regional level.
1.7 Limitation of the Study
The limitation that arose related to truthfulness of the financial data that has been posted by
banks and the consistency of the application of the guidelines as set by the CBK. The issue was
raised with two closed banks, namely Chase Bank Kenya Limited and the Imperial Bank
whereby the regulator insisted there was wrong classification of loans that led to several
restatements. The study relied on secondary historical data which may be outdated and therefore
do not reflect the current affairs. The study aggregated the data on financial performance and
nonperforming loans components that is, size, age, collateral and cost of all the commercial
banks over the study period and therefore the finding cannot reflect the impacts of
nonperforming loans on the financial performance on specific and an isolated commercial bank,
judgment of a specific commercial banks with reference to the study findings should therefore be
16
CHAPTER TWO:
LITERATURE REVIEW
2.1 Introduction
This chapter entails the relevant literature reviewed as far as the effects of non-performing loans
on the financial performance of banks is concerned as well as Central Bank of Kenya taking into
consideration the risks and policies that are faced by the commercial banks and the relevant
studies that have been done to support this in Kenya. Among the theories to be observed in this
chapter includes; the credit crunch theory and the moral hazard theory.
2.2 Theoretical Framework
Some of the theories relating to this study are discussed in this section includes; the credit crunch
theory and the moral hazard theory.
2.2.1 The Credit Crunch Theory
The credit crunch theory was developed by Hyman Philip Minsky in 1992. In this theory, the
demand and the supply are the main factors attributing to the reduced bank credit expansion.
According to the theory, credit demands become more despondent as economic growth slows
down because borrowers become more cautious in their attitude towards borrowing. Moreover,
banks contribute to a decline in lending activity as during times of slow economic growth, this is because borrowers‟ credit quality declines which in turn leads to the collateral values decreasing
and more loans encountering payment difficulties and this then has the effect of causing the
banks to decrease their willingness to extend credit, (Omotende, 2013). This is in turn enforced
17
standards and wider margins on lending. This marked reduction in bank lending then leads to slower monetary expansion as both the banks and borrowers are in poor financial health. O‟Brien
and Brown further note that based on the cyclical credit losses and deteriorating borrower quality
experienced during the credit crunch period, as well as the imposition of higher mandatory capital ratios by the banks‟ regulators, banks in several countries have raised the relative price of
loans. This has in turn had a depressive effect on demand for the loans. However, as growth of the economies continues and the banks apply stricter lending standards, the bank‟s asset quality
improves which dampens the banks‟ unwillingness to lend, (Saunders, 2012). The theory is
relevant to the study because it shows how quality of collateral affects banks‟ credit health,
behavior and decisions which in turn affect the financial performance of commercial banks.
2.2.2 The Moral Hazard and unobservable behavior concept
The moral hazard and unobservable behavior concept was developed by J. A Mirrless in 1999.
Moral hazard refers the risk in which a party to a transaction provides misleading information
about its assets, liabilities or credit capacity, or has an incentive to take unusual risks in a
desperate attempt to earn a profit before the contract settles, (Wolfson, 2002). Usually a party to
a transaction may not enter into the contract in good faith, thus providing misleading information
about its assets, liabilities or credit capacity. It is postulated that; moral hazard problems may be
occasioned by asymmetric information which makes it difficult to distinguish between good and
bad borrowers. It is also noted that moral hazard has led to substantial accumulation of NPLs.
The theory is significant to the study as problems of moral hazard in financial institutions are
evident at many stages of the recent financial crises. Borrowers and lenders tend to conceal
18
Yet in modern macroeconomic theory economic growth rate depends, crucially, on the efficiency
of financial institutions. The financial systems themselves depend on accurate information about
borrowers and the project the funds are used for. Though it is asserted that NPLs may be caused
by less predictable incidents, they indicated that moral hazards resulting from generous
government guarantees could lead to loan default, (Capron, 2013).
Consistent with earlier assertions regarding moral hazard, it is arguable that microfinance banks
with relatively low capital, just like other mainstream financial institutions, may respond to
moral hazard incentives by increasing the riskiness of their loan portfolio. The foregoing is
bound to result in higher non-performing loans on average in the future, Buchholz, (2014). As further reinforced by another study‟s argument, microfinance banks that tend to take more risks,
including in the form of excess lending ultimately incur losses. Still in tandem with moral
hazard, higher equity-to assets ratio results in lower NPLs. Given that, moral hazard incentives
such as low equity tend to aggravate NPLs, then microfinance banks and other financial
institutions ought to avoid such moral hazard incentives in order for them to mitigate losses
through NPLs. This theory is relevant to the study because borrowers and lenders tend to conceal
crucial information pertaining to the lending and borrowing agreement which increases the risk
of nonperforming loans in commercial banks.
2.2.3 Theory of performance
The theory of performance was developed by Don Elger (2007) and relates six foundational
concepts to form a framework that can be used to explain performance as well as performance
19
components that is context, level of knowledge, levels of skills, level of identity, personal
factors, and fixed factors. Performance is a journey not a destination. The location in the journey
is labeled as level of performance. Each level characterizes the effectiveness or quality of a
performance. The theory states that the performance at higher level can be evidence by results
that include increases quality, reduces cost increased capability, increased capacity, increased
knowledge and increased identity and motivation.
The theory notes that performance is like a system and depends on the components of the system
and on the interactions between these components. The theory holds that performance has rules
as guidelines. The components holistically interact to establish performance. Such components
include; One: Level of identity-associated with maturation in a discipline of a culture,
internalized by person or organization, Two: Levels of skills describing and action that is
relevant in a broad range of performance contexts, three: level of knowledge-knowledge involves
facts, information, concepts, theories, or principles acquired by a person or group through
experience or education. Four: Context of performance that relates to circumstances associated
with the performance. It applies to multiple performances within the context but not a personal
factor. Five: Personal factors that involve life situation of an individual that affected by other
factors not within an individual controls such as macroeconomic situations or the education
system. Six: fixed factor that cannot be altered. Some are generic.
The theory states that performance can be improved despite other factor being fixed and
immutable. Performance can be improved by factors that depend on the action of the performer
20
that engage positive emotions such as setting challenging goals and allowing failure as a natural
part of attaining high performance, and providing conditions in which the performer feels a right
amount of safety. Two: Immersion. This is a physical, social, and intellectual environment can
elevate performance and stimulate personal as well as professional development such as creating
quality learning environments which outlines strategies for fostering immersion. Three:
Reflective practice which involves actions that help people pay attention to and learn from
experiences. The theory is relevant to the study was it high lights the incentives to performance,
circumstances associated with the performance, and how performance can be improved despite
other factors being immutable.
2.3 Empirical Literature Review
In this section, empirical studies were reviewed. The study analyzed theories, past studies, and
researches by different researchers that have been conducted by different scholars on areas
touching on components of non-performing loans and in particular credit risk, age, size and the
cost of financial performance.
2.3.1 Size as a determinant of Non-Performing Loans and performance
Research from the previous studies such as Holder et al., (2010), Bradley et al., (2011), Michel,
(2011) and Al-Kunari, (2010) have revealed that firm size plays a substantial role as a far as
determining the non-performing loans of a firm(s) is concerned. According to Holder et al.,
(2010) and Bradley et al., (2011), larger firms tend to have higher non-performing loans
21
less reliant on internal funds. A positive relationship between non-performing loans and the firm
size was theorized.
According to Michel (2011), found the statistically significant differences in non-performing
loans among 10 different industries during the late 2010 through mid-2013. Michel tested only
firm size in regard to firm specific variables that might have affected the non-performing loans
and found no significant effect. However, he suggested that investment opportunities within
industries might account partially for industry effect. Baker and Powell (2012) then updated the
Michel study using data from 2005 to 2010. He identified effects to industry on non-performing loans unlike Michel‟s no control of other variables.
Al-Kunari (2010) used panel data and identity firm size as a factor influencing non-performing
loans and the overall financial performance of the commercial banks. Commercial banks
generate revenue through advancing of loans to customers. Loan portfolio is not only considered
as the largest asset and pre-dominate source to generate revenue but also as one of the biggest risk source for the financial institution‟s soundness and safety as well (Richard et al., 2008). The
size of the loan value that is nonperforming therefore have an impact on the revenue stream of
commercial banks. Reducing the size of nonperforming loans increases the financial
performance of commercial banks as the repayments obtained from the repayments of loans by
customers are reported as income from financing activities by commercial banks. Klein (2013),
non-performing loans will effect profitability of banks which is their main profit source. Increase
of the non-performing loans decreases bank profitability and decrease of the non-performing
22
2.3.2 Age as a determinant of Non-Performing Loans and performance
The duration in time taken by a loan facility to move the various bands of risk classification such
as normal, watch, substandard, doubtful and loss, determines the age of a nonperforming loan.
The prudential guideline by CBK 2013, classifies loans based on the days overdue of any
particular loan. Michael Pomerleano, (2011) states that age of a loan may reflect little resources
allocated to monitor lending risks and, thus, may result to a higher NPLs in the future. In line
with the moral hazard hypothesis, the scholar observed that banks with relatively low capital
respond to moral hazard incentives by increasing the riskiness of their loan portfolio, which in
turn, results to higher NPLs on average in the future.
In a study of causes and effects of NPLs on MFIs‟ operations in Ghana, Arko (2012) asserts that
the lender should ensure that good decisions are made relative to granting of loans with the
object of minimizing credit risk. In other words, the lender ought to always aim to assess the
extent of the risk associated with the lending and try to minimize factors that could otherwise
compromise repayment. Michael (2011) noted that, needless to say, the lender should gather
information regarding the prospective borrower that will assist in reaching a sound credit
decision. Michael (2011) noted that in order to mitigate NPLs which are occasioned by
non-repayment of loans, MFIs in Ghana have adopted a standard loan request procedure and
requirements that are usually contained in credit policy manual with the object of guiding loan
officers and customers. A study by Haron et al (2012) sought to analyze the effectiveness of credit management system on loan performance in Kenya‟s MFIs. Haron et al (2012), observed
that credit risk results from investor‟s risk of loss emanating from default in loan repayment.
23
strategies such as risk-based pricing, covenants, credit insurance, and tightening and
diversification. Credit risk controls adopted by MFIs affect the loan performance. In a study on
NPLs in Kenya commercial banks in Kenya, Mutuku (2016), noted that quality credit risk
assessment and risk management and sufficient provisions for bad and doubtful debts can reduce the bank‟s credit risk. He asserted that when the level of NPLs is high, the assets provisions
made are not adequate protection against default risk. It is asserted by Mucheke (2001) in a study
of factors affecting NPLs in Kenyan banks that, granting loans to borrowers who are already
overloaded with debt or possess unfavorable credit history could possibly expose banks to
unnecessary default and credit risk.
According to Naomi and Nagib (2017) Information asymmetry is attributed to inappropriate
determination of credit risk due to lack of requisite credit history of prospective borrowers.
Financial institutions operating in isolation suffer from worse credit risk than those which share
their credit information, Naomi and Nagib (2017). Serial defaulters, associated with credit risk,
have negatively altered the lending business in the credit market, and as such negated the
performance of banks, Fatemi and Fooladi (2010).
2.3.3 Cost as a determinant of Non-Performing Loans and performance
In the necessity to cover the potential losses on loans and write off bad debt in the profit and loss
account, the banks normally make provisions for such. Defaulted loans force the banks to take
certain measures in order to recover and securitize them in the best way. According to Sanderson
Abel (2014), upon realization of the bank that the loan has become non-performing, they usually
24
allocating and distributing people‟s saving for use in most productive investment. Bank‟s
intermediary function is essential for economic activity as it enhances the productivity and
efficiency of the economy as a whole. Bourke, (2014) reports the effect of credit risk on
profitability appears clearly negative. Abel (2014), states that if bank‟s amount of disposal of
non-performing loans continue to exceed their profits, the bank‟s net worth is reduced and
lowers their risk-taking capacity, making it difficult to invest funds in risky projects and to
realize potentially productive businesses. Abel (2014), noted that non-performing loans have the effect of eroding the bank‟s profitability which can happen in two ways; first, non-performing
loans incur heavy disposal expenses, that is, making provisions for credit losses and postponing
the final disposal of non-performing loans would cause additional losses if the collateral value of
underlying asset declines. Secondly, holding non-performing loans for a long time without
disposing them would incur costs other than the amount of disposal of non-performing loans.
That is to say, by continuing to hold non-performing loans, or assets that do not generate returns,
banks would lose returns that they would have earned if they had collected the loans.
According to Klein (2013), non-performing loans will affect profitability of banks which is their
main profit source and ultimately financial stability of economy. Abel (2014), stipulates that
there is a negative relationship between the non-performing loans and performance. Performance
of the bank can be measured by the rate at which they turn deposits into loans and the capability
of collecting those loans. Those who borrow from the banks ought to understand that banks are
merely intermediaries hence resources that they lend to them are other client‟s investments.
When investors place their investments with banks they have an expectation to receive their
25
Mwangi (2011) states that the customers to the banks are at liberty to borrow and the banks are at
the liberty to lend the resources to the borrowers at an interest with an expectation that the
money will be timely returned. If the borrower then fails to pay back the amount they borrowed,
this then impairs the ability of a bank to meet the withdrawals demands of its depositors which
can cause a lot of problems in the banking system sometimes leading to panic withdrawals.
Under such circumstances the banks finds itself in a very uncomfortable situation as clients
resolve to lose confidence in its intermediation function. Muniappan (2002) non-performing
loans effects not only the profitability of banks by way of bearing costs of an asset that is not
able to provide income but also negatively effects the capital adequacy. Mwangi (2011) states
that the clients of the banks need to understand that non-performing loans becomes a huge cost
on the economy when they begin to interfere with the normal financial intermediation role of
banks. If the non-performing loans are kept on bank books and are continuously rolled over, the
resources are effectively locked up in unprofitable sectors; thus, hindering the economic growth
and impairing the economic efficiency. An amount of non-performing loans reflects the amount
of money some of the deficits units in the country are experiencing and failing to access for
productive purpose thus money has to go around in the economy if the economy is to function
properly and grow.
2.3.4 Collateral as a determinant of Non-Performing Loans and performance
According to Fatemi and Fooladi (2010), Qualifying for a loan depends largely on the borrower's
credit history. The lender examines the borrower's credit report, which details the names of other
26
more. The report helps the lender determine whether the borrower is comfortable managing
payments based on current employment and income. They observed that the lender may also
evaluate the borrower's current and new debt compared to before-tax income to determine the
borrower's debt-to-income (DTI) ratio. Lenders may also use the Fair Isaac Corporation (FICO)
score in the borrower's credit report to determine creditworthiness and help make a lending
decision.
Kwach (2011) states that when applying for a secured loan, such as an auto loan or a home
equity line of credit, the borrower pledges collateral. The value of the collateral is evaluated, and
the existing debt secured by the collateral is subtracted from its value. The remaining equity
affects the lending decision. He observed that the lender evaluates a borrower's capital, including
savings, investments and other assets that may be used to repay the loan if household income is
insufficient. This is helpful in case of a job loss or other financial challenge. Banks therefore
when continuously faced with the default problem, they may continue to lend out on the basis
that the client offers adequate collateral, Bernstein (2012). This is one of the major reasons for
banks demanding that a borrower pledges collateral which the bank can dispose when the
borrower defaults. Under this arrangement, the bank has a legitimate expectation to get the
money back or else they will put the pledged collateral under the hammer and the financial
intermediation process will continue. Joe (2007), noted that lack of collateral that can be used to
guarantee loans make lenders often lack the means to use the legal system to enforce repayment.
A commercial bank has the right, upon default on the loan, to obtain the collateral in lieu of
payment (Baker, 2014). The collateral held by commercial banks for the nonperforming loans
can be disposed to recover the loan exposure by commercial banks. Lipunga, (2016) noted that
27
by offering for sale the collateral offered. Naomi (2017) noted that weakness in due diligence
processes in ascertaining collateral causes bank losses. The quality of collateral held by
commercial banks determines how much commercial banks will collect from sale of the same in
case of recovery of nonperforming loans that may affect the financial performance of
commercial banks.
2.4 Summary of the Literature Review and research gaps
This chapter mainly focused on the financial performance of commercial banks that was
measured using ROA and the associated nonperforming loans. The study reviewed three
theories; the credit crunch theory, the moral hazard theory and the performance theory, their
significances and applications to nonperforming loans and financial performance of commercial
banks. Earlier studies identified firm size as a significant determinant as far as determining the
performing loans is concerned. The earlier researches have shown that age of
non-performing loan may affect the little resources allocated to monitor lending risk, thus may result
into higher NPL in the future. Previous reaches recommended risk assessment before lending and
lending to perceived low default risk customer as a measure to reduce NPL and increase ROA
for commercial banks. Qualifying for a loan depends largely on the borrower's credit history,
Fatemi and Fooladi (2010). Earlier studies have recommended collateralization of loans
advanced by commercial banks. Naomi (2017) noted that weakness in due diligence processes in
ascertaining collateral causes bank losses,
Other scholars previously associated nonperforming loans the origin of financial crises around
28
Some scholars associated NPL with loan prices. Some scholars have previously recommended
improved risk assessment on customers before lending in order to minimize nonperforming loans
and it is impact on financial performance of commercial banks. Strategies such as improved risk
assessment of customers, collateralization of loans, de-risking on perceived high risk customers,
early default warning signs and timely remedial and recovery procedures have been suggested
and some implemented as ways of curbing non-performing loans and increasing the financial
performance of commercial banks. However, all these previous studies have addressed
non-performing loans and financial performance as a whole but have not broken down NPL and
pointed out the impact of the specific components of NPL such as size of NPL, age of NPL, cost
of NPL and collateral for NPL on the financial performance of commercial banks in Kenya.
Therefore, a knowledge gap exists and this is the gaps that the study seeks to fill.
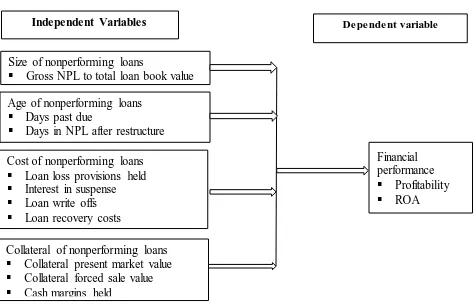
2.5 Conceptual Framework
Naomi and Nagib (2017) define a conceptual framework as a diagrammatical representation that
shows the relationship between dependent variable and independent variables. Mugenda and
Mugenda, (2009) defines conceptual framework as a concise description of phenomenon under
study accompanied by a graphical or visual depiction of the major variables of the study. The
conceptual framework therefore brings out the relationship between the dependent and the
independent variables diagrammatically and visually. In this study, the dependent variable is the
financial performance of commercial banks in Kenya while the independent variable is the size,
29 Figure 2.1: Conceptual framework
Size of nonperforming loans
Gross NPL to total loan book value
Age of nonperforming loans
Days past due
Days in NPL after restructure
Financial performance Profitability
ROA
Independent Variables De pe nde nt variable
Collateral of nonperforming loans Collateral present market value Collateral forced sale value
Cash margins held
Cost of nonperforming loans Loan loss provisions held Interest in suspense Loan write offs
30
CHAPTER THREE:
RESEARCH METHODOLOGY
3.0 Introduction
This Chapter presents the research methodology that was adopted by the study for the effect of
non-performing loans on the financial performance of the commercial banks in Kenya. Some of
the issues that were captured include the research design that was employed; the target
population for the study; the different techniques that were employed to arrive at the sample size
for the study; the type of data collection methods and the techniques adopted in analyzing the
data that was collected.
3.1 Research Design
The study adopted a descriptive survey on all the commercial banks operating in Kenya, which
sought to identify the level of non-performing loans in Kenya for the period between 2011 and
2016. This design was found to be most appropriate given the exploratory and descriptive nature
of this study (Wawire & Nafukho, 2010). The research design employed aimed at obtaining the
most recent, relevant and in-depth assessment, analysis and examination of the impact on
nonperforming loan size, age, collateral and cost on the return on assets of commercial banks in
Kenya as collated by the CBK.
3.2 Target Population
According to Hungler and Pilot (1999), the population of any research is basically the total
number of all the subjects and/or elements that are agreeing to a certain phenomenon under
31
financial industry report, there were 42 licensed and operational commercial banks in Kenya in
2016. The target population was all the 42 operational commercial banks in Kenya. However, the
population was limited to operational banks over the study period who had published and
reported their financials to CBK as per the CBK Prudential Guideline of 2013. CKB industry
performance does not include banks under receivership or statutory management. According to
CBK 2016, Charterhouse Bank, under statutory management, Fidelity Commercial Bank,
undergoing acquisition, Imperial Commercial Bank & Chase Bank that were in receivership at
the time were excluded in the computation of the industry performance.
3.3 Sampling Technique and Sample Size
All the operational commercial banks in Kenya were included for the purposes of this study. The
individuals that make the population were all included in the study as a block that gave a 100%
sampling of the population. The study sample was therefore 42 operational commercial banks in
Kenya. As noted by CBK (2016) three banks that were under receivership and statutory
management were not included in the study. Only 42 operational banks that publish and report
their financials to CBK were included in the study.
3.4 Data Collection instrument
In this section, secondary data was collected through secondary data collection sheet from the
commercial banks published annual reports and other empirical studies on the topic under study.
This was quantitative in nature and it included data on the level of non-performing loans,
32
from 2011 to 2016 for the study to be comprehensive. This was appropriate through creation of a
data collection schedule which was designed.
3.5 Data collection procedure
The data was collected through quantitative data extraction and tabulation of the same in MS
Excel from the Central Bank of Kenya bank supervisory report and industry financial
performance of all commercial banks in Kenya over a five year period from 2011 to 2016. The
data extracted was quantitative in nature. The data was gathered in line with specific study
variables over the five year study period. The extracted data was for the financial performance of
commercial banks, loan classification and non-performing loans, value of collateral held by
commercial banks and provisions made for non-performing loans by the commercial banks in
Kenya as per the study variables over the five year study period (2011-2016)
3.6 Data Analysis and Presentation
Data analysis is the processing of data to make meaningful information (Sounders, Lewis &
Thornbill, 2009). Burns & Grove (2003) defines data analysis as a mechanism for reducing and
organizing data to produce finding that require interpretation by the researcher. The study used
SPSS and MS Excel in data analysis. After data was collected using the secondary data
collection sheets, it was prepared in readiness for analysis by extracting, editing, categorizing
and keying into SPSS computer software where it was used for analysis. SPSS was therefore
used to produce frequencies, descriptive and inferential statistics which were used to derive
conclusions and generalization regarding the population. The data coded data was then analyzed
33 3.6.1 Regression model
The study used a regression model to bring out the relationship between financial performance of
commercial banks in Kenya (dependent variable) and the non-performing loans (independent
variables) that is, the size, age, cost and collateral of non-performing loans. The model took the
form of;
y= a + bx
The researcher used regression analysis to determine the effect of non-performing loans on the
financial performance of commercial banks in Kenya. In order to conduct the regression
analysis, the following model was used;
Y = α + β1X1 + β2X2+β3X3+β4X4+ ℮;
Where;
Y – Represented the financial performance of commercial banks in Kenya. The performance was
measured using return on assets; α = a constant
X1 – Represented size as a determinant of non-performing loan and performance;
X2 – Represented age as a determinant of non-performing loan and performance;
X3 – Represented cost as a determinant of non-performing loan and performance;
X4 – Represented collateral as a determinant of non-performing loan and performance;
℮ – was the error term that represented the total variance that was not unexplained by the
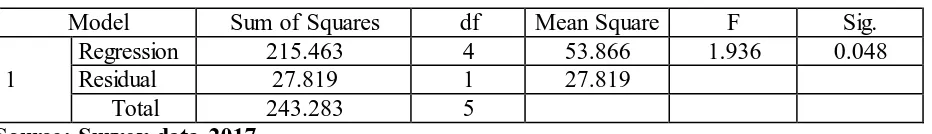
34 3.7.2 Test of significance
The study used ANOVA test from regression analysis to test the overall significance of the
models in predicting relationship between the independent variables and the dependent variable