Harmonic Distortion Analyzer Using Labview
Usha Rani Anam, P Saritha, D Uma Maheswara Reddy, K Niranjan Kumar1, 2 Assistant Professor, Dept. of ECE, Institute of Aeronautical Engineering (IARE), Hyderabad.
3, 4 Assistant Professor, Dept. of ECE, PBR Visvodaya Institute of Technology& Sciences Kavali, SPSR Nellore(D.T), Andhra Pradesh.
Abstract
A total harmonic distortion analyzer calculates the total harmonic content of a sine wave with some distortion, expressed as total harmonic distortion (THD). A typical application is to determine the THD of an amplifier by using a very-low-distortion sine wave input and examining the output. By using a LabVIEW graphical programming environment it is creates a virtual instrument whose
operation is validated in two different ways. On the
one hand the input of the virtual instrument is
obtained by synthesis of a periodic signal. The
deformation of current signal with a set number of
harmonics can be simulated for different amplitude,
frequency and phase values of each harmonic
number. After the synthesis of distorted signal, it can
be viewed and analyzed the deforming regime
characteristic parameters (the value of the total
harmonic distortion factor, the fundamental
frequency, the components level with the amplitudes
of the measured harmonics)
1. INTRODUCTION
An instrument is a device designed to collect data from an environment, or from a unit under test, and to display information to a user based on the collected data. Such an instrument may employ a transducer to
sense changes in a physical parameter, such as temperature or pressure, and to convert the sensed information into electrical signals, such as voltage or frequency variations. The term instrument may also be defined as a physical software device that performs an analysis on data acquired from another instrument and then outputs the processed data to display or recording devices. This second category of
recording instruments may include
oscilloscopes, spectrum analyzers, and digital millimeters. The types of source data collected and analyzed by instruments may thus vary widely, including both physical parameters such as temperature, pressure, distance, frequency and amplitudes of light and sound, and also electrical parameters including voltage, current, and frequency. The rapid adoption of the PC in the last 20
years catalyzed a revolution in
instrumentation for test, measurement, and
resulting from the ubiquity of the PC is the concept of virtual instrumentation, which offers several benefits to engineers and
scientists who require increased
productivity, accuracy, and performance. A virtual instrument consists of an industry-standard computer or workstation equipped with powerful application software, cost-effective hardware such as plug-in boards, and driver software, which together perform the functions of traditional instruments. Virtual instruments represent a fundamental shift from traditional hardware-centered instrumentation systems to software-centered systems that exploit the computing
power, productivity, display, and
connectivity capabilities of popular desktop computers and workstations. Although the PC and integrated circuit technology have experienced significant advances in the last two decades, it is software that truly provides the leverage to build on this powerful hardware foundation to create virtual instruments, providing better ways to innovate and significantly reduce cost. With virtual instruments, engineers and scientists build measurement and automation systems that suit their needs exactly (user-defined) instead of being limited by traditional fixed-function instruments (vendor-defined).
2.
HARMONIC DISTORTION
The power quality of distribution systems has a drastic effect on power regulation and consumption. Power sources act as non-linear loads, drawing a distorted waveform that contains harmonics. These harmonics can cause problems ranging from telephone transmission interference to degradation of conductors and insulating material in motors and transformers. Therefore it is important
to gauge the total effect of these harmonics. The summation of all harmonics in a system is known as total harmonic distortion (THD). Total harmonic distortion is a complex and often confusing concept to grasp. However, when broken down into the basic definitions of harmonics and distortion, it becomes much easier to understand.
Now imagine that this load is going to take on one of two basic types: linear or
to the current draw of each type of load. Linear loads draw current that is sinusoidal
in nature so they generally do not distort the
waveform (Figure 1.2). Most
household appliances are categorized as linear
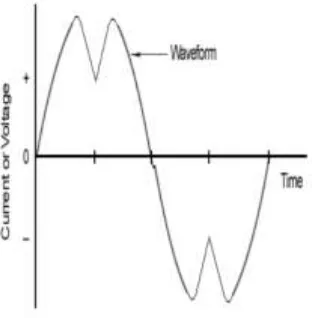
loads. Non-linear loads, however, can draw current that is not perfectly sinusoidal (Figure 1.3). Since the current waveform deviates from a sine wave, voltage waveform distortions are created.
Figure 2.2: Ideal Sine wave
Figure 2.3: Distorted Waveform
As can be observed from the waveform in Figure 1.3, waveform distortions can drastically alter the shape of the sinusoid. However, no matter the level of complexity of the fundamental wave, it is actually just a composite of multiple waveforms called harmonics. Harmonics have frequencies that
are integer multiples of the waveform’s fundamental frequency. For example, given a 60Hz fundamental waveform, the 2nd, 3rd, 4th and 5th harmonic components will be at
120Hz, 180Hz, 240Hz and 300Hz
from its pure sinusoidal values as a result of the summation of all these harmonic elements. The ideal sine wave has zero harmonic components. In that case, there is nothing to distort this perfect wave. Total harmonic distortion, or THD, is the summation of all harmonic components of the voltage or current waveform compared against the fundamental component of the voltage or current wave:
A technical view of harmonics Harmonics are currents or voltages with
frequencies that are integer multiples of the fundamental power frequency. If the fundamental power frequency is 60 Hz, then the 2nd harmonic is 120 Hz, the 3rd is 180 Hz, etc. (see Figure 1.4). When harmonic frequencies are prevalent, electrical power
panels and transformers become
mechanically resonant to the magnetic fields generated by higher frequency harmonics. When this happens, the power panel or transformer vibrates and emits a buzzing
sound for the different harmonic
frequencies. Harmonic frequencies from the 3rd to the 25th are the most
common range of frequencies measured in electrical distribution systems.
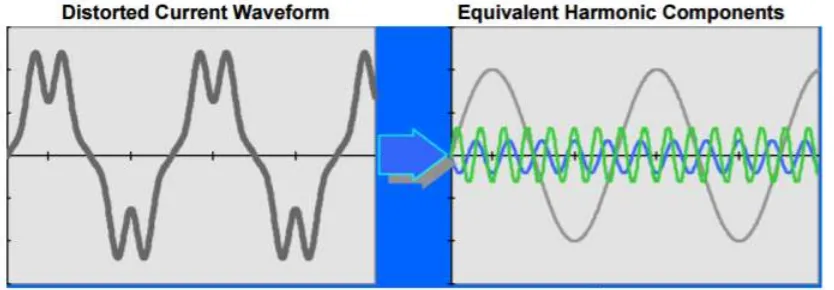
Figure 2.4: Harmonic distortion of the electrical current waveform All periodic waves can be generated with
sine waves of various frequencies. The
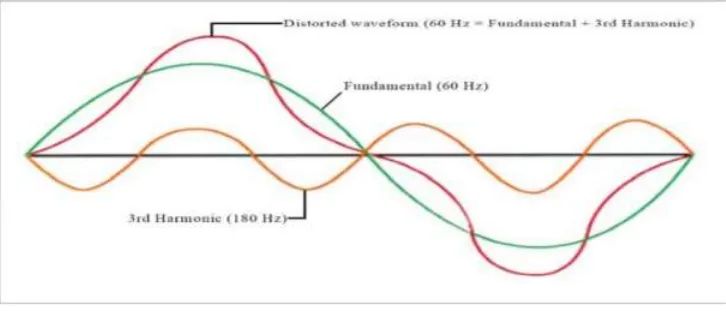
Figure 2.5: Distorted waveform composed of fundamental and 3 rd harmonic The total harmonic distortion (THD) of a
signal is a measurement of the harmonic distortion present and is defined as the ratio of the sum of the powers of all harmonic
components to the power of the
fundamental. It provides an indication of the degree to which a voltage or current signal is distorted
3.
RESULTS
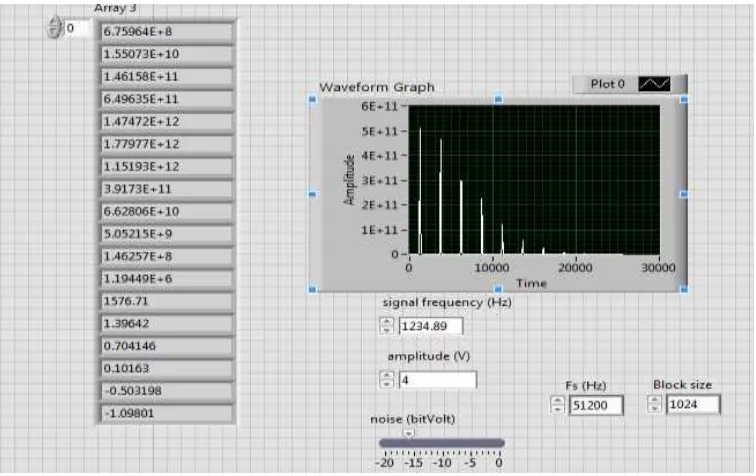
The harmonic distortion calculation using LabVIEW as shown in below Fig 4.2. The frequency spectrum contains original frequency component and
integer multiplies of fundamental
frequency components. These
harmonic distortion and so finally add all harmonic distortions, we can get
total harmonic distortion.
Fig 4.2: Front panel of Harmonic distortion calculation.
IV: CONCLUSION AND FUTURE
SCOPE
This project provides very easy to
implement harmonic distortion c analyzer by
using LabVIEW. It replaces large amount of
hardware. Virtual instrument offers several
Benefits to engineers and scientists, who
require increased productivity, accuracy and
performance. The traditional hardware was
replaced by virtual instruments and it also
provides low cost and flexibility. This VI
calculates total harmonic distortion of given
signal.
Evolution and cost of measurement
equipment, continuous training, and distance
learning make it difficult to provide a
complete set of lab equipment to every
student. For a preliminary familiarization and
experimentation with instrumentation and
measurement procedures, the use of virtual
equipment is often considered more than
sufficient from the didactic point of view,
while the hands-on approach with real
instrumentation and measurement systems
still remains necessary to complete and refine
the student’s practical expertise. Creation and
distribution of workbenches in networked
computer laboratories therefore becomes
attractive and convenient.
REFERENCES
1. Brian R., Lipsman R.L., “A guide to
Matlab: for beginners and
experienced users”,Cambridge
University Press, 2001
2. Czarnecki L.S., “Harmonics and
power phenomena”, Wiley
Encyclopedia of Electrical and Electronics Engineering, John Wiley,
New York, 2000.
3. Jacobs J., Detjen D.O., De Doncker R.W., “An overview of methods to determine the harmonics in
three-phase systems”, IEEE Young,
Researchers Symposium in Electrical Power Engineering Distributed Generation, 2002.
virtuală LabView, Editura Credis, Bucureşti, 2003
5. Popescu M., Bitoleanu A., Dobriceanu M., “On the AC-side interface filter in three-phase shunt active power filter systems”, World Academy of
Science, Engineering and
Technology, Issue 69, August 2010, pp. 516-521.
6. Selisteanu D., Petre E., ş.a., Aplicaţii LabVIEW pentru achiziţia şi generarea datelor, Editura Sitech, Craiova, 2004
7. Subtirelu G.E., “Electronica analogica asistata de calculator”, Editura Sitech, 2011, Craiova, pp. 8-18.
8. Sutherland P., “Harmonic
measurements in industrial power
systems”,IEEE Trans.Ind.
Appl.,Vol.31, No.1,1995,pp.175-183.
9. Detection and Filtering of Harmonics, Schneider Electric, Application note, 2008.
10. Harmonics Standards for
Commercial Electronic Products, dBi Corporation, 2010,
http://www.dbicorporation.com/har monic.htm.
11. Guide to Harmonics with AC Drives, ABB, Technical Guide No. 6.
12. Harmonics, E-Source Customer Direct, Platts – a Division of The McGraw Hill Companies Inc.
13. Normes CEI 61000-3-2, Limites pour les emissions de courants harmoniques.