Read Only Document Not For Distribution
Sizing Storm
Drainage Systems
Read Only Document Not For Distribution
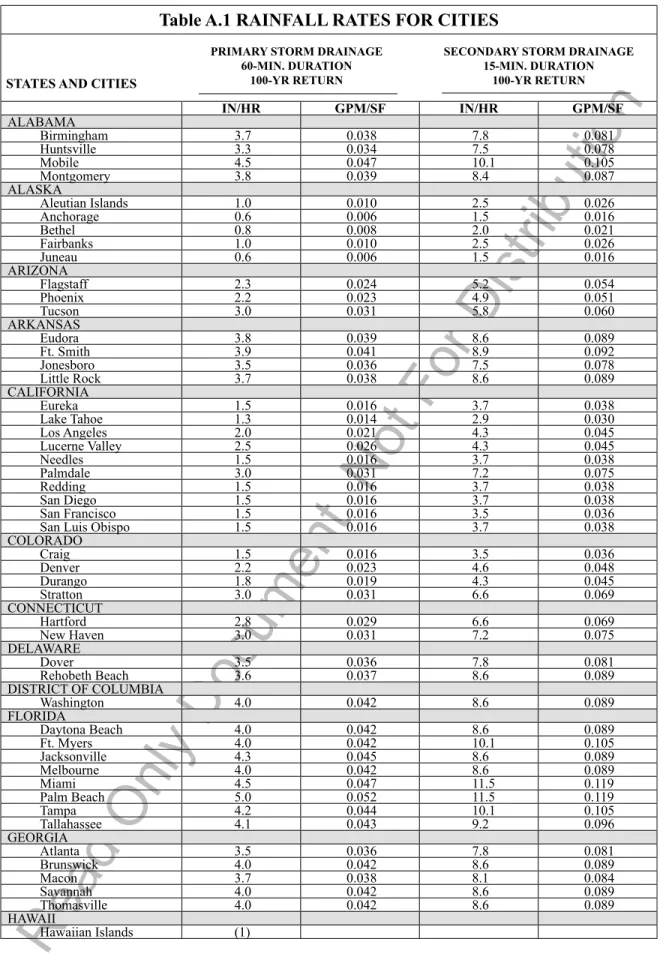
A.1 Rainfall Rates for Cities
The rainfall rates in Table A.1, RAINFALL RATES FOR CITIES, are based on U.S. Weather Bureau Technical
Paper No. 40, speci
fi
cally Chart 14: 100-YEAR 1 HOUR RAINFALL (inches) and Chart 7: 100-YEAR
30-MINUTE RAINFALL (inches). The data in Chart 7 were multiplied by 0.72 to determine the rainfall for a
15-minute period, then multiplied by 4 to establish the corresponding rainfall rate in inches per hour. The
fl
ow
rates in gallons per minute (gpm) were established by dividing the inches per hour by 12 to determine cubic feet
per hour per square foot, then multiplying by 7.48 gallons per cubic foot to determine gallons per hour per square
foot, then dividing by 60 minutes per hour to determine the equivalent gallons per minute.
A.2 Roof Drainage
Primary roof drainage systems are sized for a 100-year, 60-minute storm. Secondary roof drainage systems are sized
for a more severe 100-year, 15-minute storm. The rainfall rates in Table A.1 should be used for design unless higher
rates are established locally.
A.3 Sizing by Flow Rate
Storm drainage systems may be sized by stormwater
fl
ow rates, using the appropriate GPM/SF of rainfall listed in
Table A.1 for the local area. Multiplying the listed GPM/SF by the roof area being drained (in square feet) produces
the gallons per minute (gpm) of required
fl
ow for each drain inlet. The
fl
ow rates (gpm) can then be added to
de-termine the
fl
ows in each section of the drainage system. Required pipe sizes can be determined from Table 13.6.1
and Table 13.6.2.
A.4 Sizing by Roof Area
Storm drainage systems may be sized using the roof area served by each section of the drainage system. Required
pipe sizes can be determined from Table 13.6.1 and Table 13.6.2. Using this method, it may be necessary to
inter-polate between the various listed rainfall rates (inches per hour). To determine the allowable roof area for a listed
size pipe at a listed slope, divide the allowable square feet of roof area for a 1" rainfall rate by the listed rainfall rate
for the local area. For example, the allowable roof area for a 6" drain at 1/8" slope with a rainfall rate of 3.2 inches/
hour is 21400/3.2 = 6688 square feet.
A.5 Capacity of Rectangular Scuppers
Table A.5 lists the discharge capacity of various width rectangular roof scuppers with various heads of water. The
maximum allowable level of water on the roof should be obtained from the structural engineer, based on the design
of the roof.
Read Only Document Not For Distribution
Table A.1 RAINFALL RATES FOR CITIES
IN/HR GPM/SF IN/HR GPM/SF ALABAMA Birmingham 3.7 0.038 7.8 0.081 Huntsville 3.3 0.034 7.5 0.078 Mobile 4.5 0.047 10.1 0.105 Montgomery 3.8 0.039 8.4 0.087 ALASKA Aleutian Islands 1.0 0.010 2.5 0.026 Anchorage 0.6 0.006 1.5 0.016 Bethel 0.8 0.008 2.0 0.021 Fairbanks 1.0 0.010 2.5 0.026 Juneau 0.6 0.006 1.5 0.016 ARIZONA Flagstaff 2.3 0.024 5.2 0.054 Phoenix 2.2 0.023 4.9 0.051 Tucson 3.0 0.031 5.8 0.060 ARKANSAS Eudora 3.8 0.039 8.6 0.089 Ft. Smith 3.9 0.041 8.9 0.092 Jonesboro 3.5 0.036 7.5 0.078 Little Rock 3.7 0.038 8.6 0.089 CALIFORNIA Eureka 1.5 0.016 3.7 0.038 Lake Tahoe 1.3 0.014 2.9 0.030 Los Angeles 2.0 0.021 4.3 0.045 Lucerne Valley 2.5 0.026 4.3 0.045 Needles 1.5 0.016 3.7 0.038 Palmdale 3.0 0.031 7.2 0.075 Redding 1.5 0.016 3.7 0.038 San Diego 1.5 0.016 3.7 0.038 San Francisco 1.5 0.016 3.5 0.036 San Luis Obispo 1.5 0.016 3.7 0.038 COLORADO Craig 1.5 0.016 3.5 0.036 Denver 2.2 0.023 4.6 0.048 Durango 1.8 0.019 4.3 0.045 Stratton 3.0 0.031 6.6 0.069 CONNECTICUT Hartford 2.8 0.029 6.6 0.069 New Haven 3.0 0.031 7.2 0.075 DELAWARE Dover 3.5 0.036 7.8 0.081 Rehobeth Beach 3.6 0.037 8.6 0.089 DISTRICT OF COLUMBIA Washington 4.0 0.042 8.6 0.089 FLORIDA Daytona Beach 4.0 0.042 8.6 0.089 Ft. Myers 4.0 0.042 10.1 0.105 Jacksonville 4.3 0.045 8.6 0.089 Melbourne 4.0 0.042 8.6 0.089 Miami 4.5 0.047 11.5 0.119 Palm Beach 5.0 0.052 11.5 0.119 Tampa 4.2 0.044 10.1 0.105 Tallahassee 4.1 0.043 9.2 0.096 GEORGIA Atlanta 3.5 0.036 7.8 0.081 Brunswick 4.0 0.042 8.6 0.089 Macon 3.7 0.038 8.1 0.084 Savannah 4.0 0.042 8.6 0.089 Thomasville 4.0 0.042 8.6 0.089 HAWAII Hawaiian Islands (1)
PRIMARY STORM DRAINAGE 60-MIN. DURATION
100-YR RETURN
SECONDARY STORM DRAINAGE 15-MIN. DURATION
100-YR RETURN
Read Only Document Not For Distribution
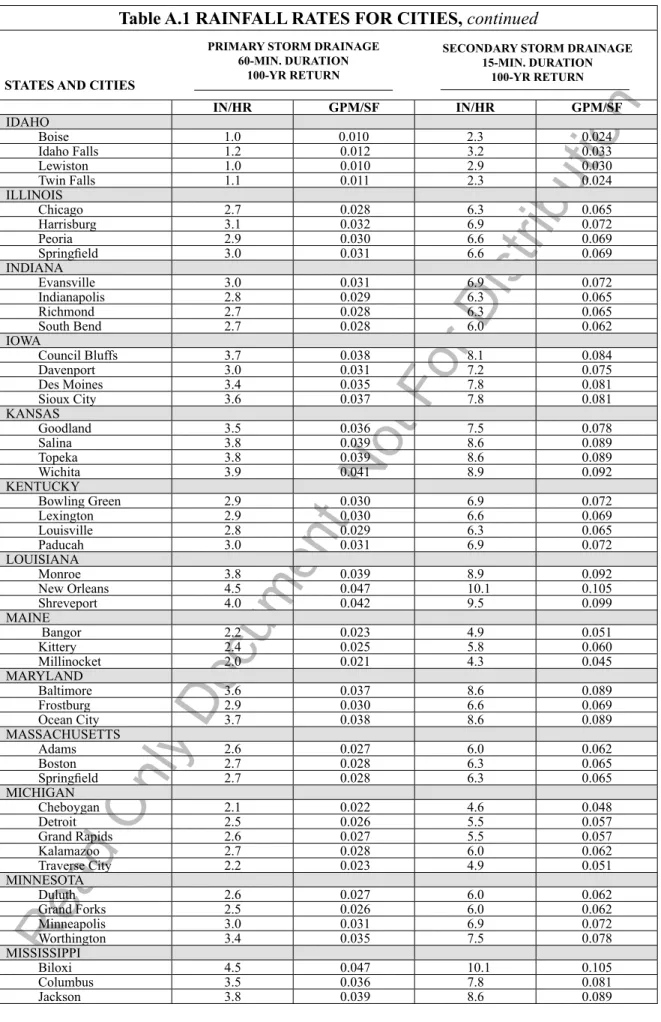
Table A.1 RAINFALL RATES FOR CITIES,
continued
IN/HR GPM/SF IN/HR GPM/SF IDAHO Boise 1.0 0.010 2.3 0.024 Idaho Falls 1.2 0.012 3.2 0.033 Lewiston 1.0 0.010 2.9 0.030 Twin Falls 1.1 0.011 2.3 0.024 ILLINOIS Chicago 2.7 0.028 6.3 0.065 Harrisburg 3.1 0.032 6.9 0.072 Peoria 2.9 0.030 6.6 0.069 Springfi eld 3.0 0.031 6.6 0.069 INDIANA Evansville 3.0 0.031 6.9 0.072 Indianapolis 2.8 0.029 6.3 0.065 Richmond 2.7 0.028 6.3 0.065 South Bend 2.7 0.028 6.0 0.062 IOWA Council Bluffs 3.7 0.038 8.1 0.084 Davenport 3.0 0.031 7.2 0.075 Des Moines 3.4 0.035 7.8 0.081 Sioux City 3.6 0.037 7.8 0.081 KANSAS Goodland 3.5 0.036 7.5 0.078 Salina 3.8 0.039 8.6 0.089 Topeka 3.8 0.039 8.6 0.089 Wichita 3.9 0.041 8.9 0.092 KENTUCKY Bowling Green 2.9 0.030 6.9 0.072 Lexington 2.9 0.030 6.6 0.069 Louisville 2.8 0.029 6.3 0.065 Paducah 3.0 0.031 6.9 0.072 LOUISIANA Monroe 3.8 0.039 8.9 0.092 New Orleans 4.5 0.047 10.1 0.105 Shreveport 4.0 0.042 9.5 0.099 MAINE Bangor 2.2 0.023 4.9 0.051 Kittery 2.4 0.025 5.8 0.060 Millinocket 2.0 0.021 4.3 0.045 MARYLAND Baltimore 3.6 0.037 8.6 0.089 Frostburg 2.9 0.030 6.6 0.069 Ocean City 3.7 0.038 8.6 0.089 MASSACHUSETTS Adams 2.6 0.027 6.0 0.062 Boston 2.7 0.028 6.3 0.065 Springfi eld 2.7 0.028 6.3 0.065 MICHIGAN Cheboygan 2.1 0.022 4.6 0.048 Detroit 2.5 0.026 5.5 0.057 Grand Rapids 2.6 0.027 5.5 0.057 Kalamazoo 2.7 0.028 6.0 0.062 Traverse City 2.2 0.023 4.9 0.051 MINNESOTA Duluth 2.6 0.027 6.0 0.062 Grand Forks 2.5 0.026 6.0 0.062 Minneapolis 3.0 0.031 6.9 0.072 Worthington 3.4 0.035 7.5 0.078 MISSISSIPPI Biloxi 4.5 0.047 10.1 0.105
PRIMARY STORM DRAINAGE 60-MIN. DURATION
100-YR RETURN
SECONDARY STORM DRAINAGE 15-MIN. DURATION
100-YR RETURN
Read Only Document Not For Distribution
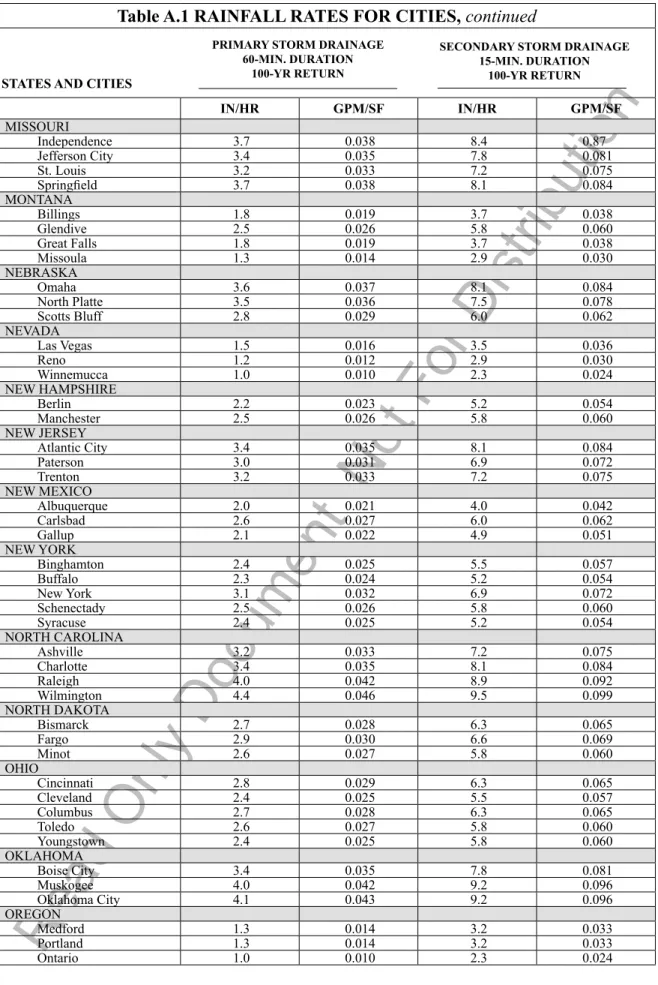
PRIMARY STORM DRAINAGE 60-MIN. DURATION
100-YR RETURN
SECONDARY STORM DRAINAGE 15-MIN. DURATION
100-YR RETURN
STATES AND CITIES
Table A.1 RAINFALL RATES FOR CITIES,
continued
IN/HR GPM/SF IN/HR GPM/SF MISSOURI Independence 3.7 0.038 8.4 0.87 Jefferson City 3.4 0.035 7.8 0.081 St. Louis 3.2 0.033 7.2 0.075 Springfi eld 3.7 0.038 8.1 0.084 MONTANA Billings 1.8 0.019 3.7 0.038 Glendive 2.5 0.026 5.8 0.060 Great Falls 1.8 0.019 3.7 0.038 Missoula 1.3 0.014 2.9 0.030 NEBRASKA Omaha 3.6 0.037 8.1 0.084 North Platte 3.5 0.036 7.5 0.078 Scotts Bluff 2.8 0.029 6.0 0.062 NEVADA Las Vegas 1.5 0.016 3.5 0.036 Reno 1.2 0.012 2.9 0.030 Winnemucca 1.0 0.010 2.3 0.024 NEW HAMPSHIRE Berlin 2.2 0.023 5.2 0.054 Manchester 2.5 0.026 5.8 0.060 NEW JERSEY Atlantic City 3.4 0.035 8.1 0.084 Paterson 3.0 0.031 6.9 0.072 Trenton 3.2 0.033 7.2 0.075 NEW MEXICO Albuquerque 2.0 0.021 4.0 0.042 Carlsbad 2.6 0.027 6.0 0.062 Gallup 2.1 0.022 4.9 0.051 NEW YORK Binghamton 2.4 0.025 5.5 0.057 Buffalo 2.3 0.024 5.2 0.054 New York 3.1 0.032 6.9 0.072 Schenectady 2.5 0.026 5.8 0.060 Syracuse 2.4 0.025 5.2 0.054 NORTH CAROLINA Ashville 3.2 0.033 7.2 0.075 Charlotte 3.4 0.035 8.1 0.084 Raleigh 4.0 0.042 8.9 0.092 Wilmington 4.4 0.046 9.5 0.099 NORTH DAKOTA Bismarck 2.7 0.028 6.3 0.065 Fargo 2.9 0.030 6.6 0.069 Minot 2.6 0.027 5.8 0.060 OHIO Cincinnati 2.8 0.029 6.3 0.065 Cleveland 2.4 0.025 5.5 0.057 Columbus 2.7 0.028 6.3 0.065 Toledo 2.6 0.027 5.8 0.060 Youngstown 2.4 0.025 5.8 0.060 OKLAHOMA Boise City 3.4 0.035 7.8 0.081 Muskogee 4.0 0.042 9.2 0.096 Oklahoma City 4.1 0.043 9.2 0.096 OREGON Medford 1.3 0.014 3.2 0.033 Portland 1.3 0.014 3.2 0.033 Ontario 1.0 0.010 2.3 0.024
Read Only Document Not For Distribution
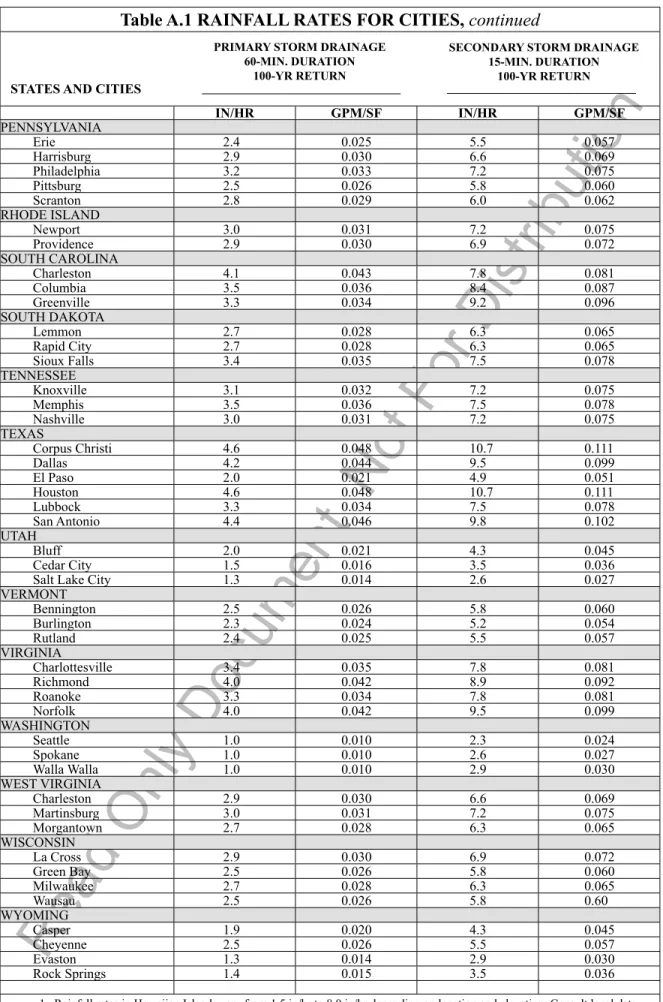
Table A.1 RAINFALL RATES FOR CITIES,
continued
IN/HR GPM/SF IN/HR GPM/SF PENNSYLVANIA Erie 2.4 0.025 5.5 0.057 Harrisburg 2.9 0.030 6.6 0.069 Philadelphia 3.2 0.033 7.2 0.075 Pittsburg 2.5 0.026 5.8 0.060 Scranton 2.8 0.029 6.0 0.062 RHODE ISLAND Newport 3.0 0.031 7.2 0.075 Providence 2.9 0.030 6.9 0.072 SOUTH CAROLINA Charleston 4.1 0.043 7.8 0.081 Columbia 3.5 0.036 8.4 0.087 Greenville 3.3 0.034 9.2 0.096 SOUTH DAKOTA Lemmon 2.7 0.028 6.3 0.065 Rapid City 2.7 0.028 6.3 0.065 Sioux Falls 3.4 0.035 7.5 0.078 TENNESSEE Knoxville 3.1 0.032 7.2 0.075 Memphis 3.5 0.036 7.5 0.078 Nashville 3.0 0.031 7.2 0.075 TEXAS Corpus Christi 4.6 0.048 10.7 0.111 Dallas 4.2 0.044 9.5 0.099 El Paso 2.0 0.021 4.9 0.051 Houston 4.6 0.048 10.7 0.111 Lubbock 3.3 0.034 7.5 0.078 San Antonio 4.4 0.046 9.8 0.102 UTAH Bluff 2.0 0.021 4.3 0.045 Cedar City 1.5 0.016 3.5 0.036 Salt Lake City 1.3 0.014 2.6 0.027 VERMONT Bennington 2.5 0.026 5.8 0.060 Burlington 2.3 0.024 5.2 0.054 Rutland 2.4 0.025 5.5 0.057 VIRGINIA Charlottesville 3.4 0.035 7.8 0.081 Richmond 4.0 0.042 8.9 0.092 Roanoke 3.3 0.034 7.8 0.081 Norfolk 4.0 0.042 9.5 0.099 WASHINGTON Seattle 1.0 0.010 2.3 0.024 Spokane 1.0 0.010 2.6 0.027 Walla Walla 1.0 0.010 2.9 0.030 WEST VIRGINIA Charleston 2.9 0.030 6.6 0.069 Martinsburg 3.0 0.031 7.2 0.075 Morgantown 2.7 0.028 6.3 0.065 WISCONSIN La Cross 2.9 0.030 6.9 0.072 Green Bay 2.5 0.026 5.8 0.060 Milwaukee 2.7 0.028 6.3 0.065 Wausau 2.5 0.026 5.8 0.60 WYOMING Casper 1.9 0.020 4.3 0.045 Cheyenne 2.5 0.026 5.5 0.057 Evaston 1.3 0.014 2.9 0.030 Rock Springs 1.4 0.015 3.5 0.036
PRIMARY STORM DRAINAGE 60-MIN. DURATION
100-YR RETURN
SECONDARY STORM DRAINAGE 15-MIN. DURATION
100-YR RETURN
Read Only Document Not For Distribution
Table A.5
DISCHARGE FROM RECTANGULAR SCUPPERS -
GALLONS PER MINUTE
WATER HEAD (Inches)
WIDTH OF SCUPPER - (Inches)
6 12 18 24 30 36 0.5 6 13 19 25 32 38 1 17 35 53 71 89 107 1.5 31 64 97 130 163 196 2 98 149 200 251 302 2.5 136 207 278 349 420 3 177 271 364 458 551 3.5 339 457 575 693 4 412 556 700 844 NOTES:
1. Table A.5 is based on discharge over a rectangular weir with end contractions. 2. Head is depth of water above bottom of scupper opening.
3. Height of scupper opening should be 2 times the design head.