A R T I C L E
Mammographic Density Change With Estrogen and
Progestin Therapy and Breast Cancer Risk
Celia Byrne, Giske Ursin, Christopher F. Martin, Jennifer D. Peck,
Elodia B. Cole, Donglin Zeng, Eunhee Kim, Martin D. Yaffe, Norman F. Boyd,
Gerardo Heiss, Anne McTiernan, Rowan T. Chlebowski, Dorothy S. Lane,
JoAnn E. Manson, Jean Wactawski-Wende, Etta D. Pisano
Affiliations of authors:Uniformed Services University of the Health Sciences, Bethesda, MD (CB); Cancer Registry of Norway, Institute of Population Based Cancer
Research, Department of Nutrition, Institute of Basic Medical Sciences, University of Oslo, Oslo, Norway and Department of Preventive Medicine, University of Southern California, Los Angeles, CA, US (GU); University of North Carolina at Chapel Hill, Chapel Hill, NC (CFM, DZ, GH); The University of Oklahoma Health Sciences Center, Oklahoma City, OK (JDP); Beth Israel Deaconess Medical Center/Harvard Medical School, Boston, MA (EBC, EDP); National Institutes of Health, Bethesda, MD (EK); Sunnybrook Health Sciences Centre, Toronto, Ontario, Canada (MDY); Ontario Cancer Institute, Toronto, Ontario, Canada (NFB); Fred Hutchinson Cancer Research Center, Seattle, WA (AM); Los Angeles Biomedical Research Institute at Harbor-UCLA Medical Center, Torrance, CA (RTC); Stony Brook School of Medicine, Stony Brook, NY (DSL); Brigham and Women’s Hospital, Harvard Medical School, Boston, MA (JEM); University at Buffalo, State University of New York, Buffalo, NY (JWW)
Correspondence to:Celia Byrne, PhD, Uniformed Services University, 4301 Jones Bridge Road A-1039F, Bethesda, MD 20814 (e-mail: [email protected]).
Abstract
Background:Estrogen plus progestin therapy increases both mammographic density and breast cancer incidence. Whether mammographic density change associated with estrogen plus progestin initiation predicts breast cancer risk is unknown. Methods:We conducted an ancillary nested case-control study within the Women’s Health Initiative trial that randomly as-signed postmenopausal women to daily conjugated equine estrogen 0.625 mg plus medroxyprogesterone acetate 2.5 mg or placebo. Mammographic density was assessed from mammograms taken prior to and one year after random assignment for 174 women who later developed breast cancer (cases) and 733 healthy women (controls). Logistic regression analyses in-cluded adjustment for confounders and baseline mammographic density when appropriate.
Results:Among women in the estrogen plus progestin arm (97 cases/378 controls), each 1% positive change in percent mammographic density increased breast cancer risk 3% (odds ratio [OR]¼1.03, 95% confidence interval [CI]¼1.01 to 1.06). For women in the highest quintile of mammographic density change (>19.3% increase), breast cancer risk increased 3.6-fold (95% CI¼1.52 to 8.56). The effect of estrogen plus progestin use on breast cancer risk (OR¼1.28, 95% CI¼0.90 to 1.82) was
eliminated in this study, after adjusting for change in mammographic density (OR¼1.00, 95% CI¼0.66 to 1.51).
Conclusions:We found the one-year change in mammographic density after estrogen plus progestin initiation predicted sub-sequent increase in breast cancer risk. All of the increased risk from estrogen plus progestin use was mediated through mam-mographic density change. Doctors should evaluate changes in mammam-mographic density with women who initiate estrogen plus progestin therapy and discuss the breast cancer risk implications.
After 5.6 years (mean) of intervention, the Women’s Health Initiative (WHI) randomized clinical trial identified net harm for estrogen plus progestin users including 24% increased breast cancer incidence (1,2). Subsequently, estrogen plus progestin use declined in the United States and elsewhere (3–7), followed
by lower invasive breast cancer incidence in most Western countries, largely attributed to reduced estrogen plus progestin usage (6–9). Clinical trials confirmed the observational studies’ reports that percent mammographic density, the proportion of total breast area appearing dense on a mammogram (10–12),
ARTI
CLE
Received:August 21, 2014;Revised:December 13, 2016;Accepted:January 6, 2017
Published by Oxford University Press 2017. This work is written by US Government employees and is in the public domain in the US.
1 of 7 doi: 10.1093/jnci/djx001
First published online March 9, 2017 Article
increased with estrogen plus progestin use (13–15). Mammographic density increased more with combined estro-gen plus progestin use than estroestro-gens alone (13,14,16–18). After one year, estrogen plus progestin use increased mammographic density by 6.9% (95% confidence interval [CI]¼5.3% to 8.5%) compared with placebo in the WHI (15).
Mammographic density strongly predicted breast cancer risk in numerous studies (10–12,19). Risk increased four- to sixfold comparing women with high mammographic density with women with low mammographic breast density (10–12). Until now, only insufficient indirect evidence has suggested that mammographic density change, occurring with estrogen plus progestin initiation, predict increased breast cancer risk. The extent that mammographic density change following estrogen plus progestin initiation increased breast cancer incidence re-mains unclear. We conducted an ancillary nested case-control study within the WHI randomized, placebo-controlled clinical trial of estrogen plus progestin, which addressed this important question.
Methods
Study Population
All study sites’ institutional review boards approved this ancil-lary study and all participants provided written informed consent.
Between 1993 and 1998, the WHI randomly assigned 16 608 postmenopausal women without prior hysterectomy to estro-gen plus progestin (0.625 mg daily conjugated equine estroestro-gen and 2.5 mg medroxyprogesterone acetatein, single tablet; Prempro, Wyeth Ayerst, Philadelphia, PA) or an identically ap-pearing placebo (20). Eligibility criteria, recruitment, and imple-mentation details were published (20). In brief, eligible postmenopausal women age 50 to 79 years had no prior hyster-ectomy or breast cancer and estimated survival of three or more years (20). Prior use of menopausal hormones required three-month washout before baseline. WHI participation required baseline mammogram and clinical breast exam without sugges-tion of cancer. Study continuasugges-tion required annual mammo-gram and breast exam without suspicions of cancer. Centrally trained local adjudicators evaluated pathology reports and medical records for all self-reported breast cancers. WHI Clinical Coordinating Center coders performed final adjudica-tion blinded to random assignment status. Follow-up for clinical outcomes among consenting women lasted 7.9 years (mean) (21). Compliance to the treatment protocol was greater than 90% in both arms of the WHI study through year 1 (1,2). Compliance decreased throughout the WHI, so by the end of follow-up, 42% assigned estrogen plus progestin and 38% as-signed placebo stopped the study medications for at least some time (1,2). Furthermore, 6.2% of women assigned estrogen plus progestin and 10.7% assigned placebo arm stopped the trial medication and obtained hormones outside of the WHI (1,2).
This ancillary study sought baseline and one-year follow-up mammograms for women who subsequently developed inva-sive breast cancer (cases) and a stratified (stratum based on age—within two years, clinical center, and race/ethnicity) ran-dom sample of three unaffected women (controls) per case. In total, 399 breast cancer cases were identified (n¼224 assigned estrogen plus progestin and n¼175 assigned placebos), and 1197 cancer-free controls were identified (n¼618 assigned es-trogen plus progestin and n¼579 assigned placebos). Controls
were free of breast cancer when the matched case was diag-nosed. We contacted and consented eligible participants re-questing mammograms for this ancillary study. Procedures to obtain the relevant mammograms followed those from an ear-lier WHI mammography study (15). Thirty-six of the 40 WHI clinical centers participated, and 61% of the mammograms re-quested were obtained. A smaller percentage of mammograms were obtained for cases (43.6%) than for controls (61.2%); how-ever, no substantial difference by treatment arm for either cases (43.3% for estrogen plus progestin and 44% for placebo) or for controls (61.2% for estrogen plus progestin and 61.3% for pla-cebo) existed. The major reasons for recovery failure included consent not obtained (42%), films no longer available (33%), in-complete image sets provided (13%), patient deceased (8%), and patient ineligible (4%).
All baseline and follow-up film mammograms sent to the University of North Carolina were digitized using a Kodak Lumisys 85 laser-scanning digitizer (Kodak, Rochester, NY). Standard data averaging methods reduced the image, digitized at 50 micron/pixel spatial resolution and 12-bit depth, to 675 925 pixels. Mammographic density assessment used cranio-caudal views from the contralateral, cancer-free breast side for all cases and a random side for the controls. All batches in-cluded approximately 5% repeated images for within- and be-tween-batch reproducibility assessments. All mammographic images randomly sorted for a given participant were read within the same batch (22). Mammograms for 973 participants were obtained and digitized. However, 66 participants had no baseline mammograms, leaving 907 participants with complete baseline and follow-up mammogram sets, comprising 174 breast cancer cases (97 from the estrogen plus progestin arm and 77 from the placebo arm) and 733 controls (378 from the es-trogen plus progestin arm and 355 from the placebo arm).
Assessment of Mammographic Density
Using two different but comparable validated interactive soft-ware tools, four readers (CB, GU, CM, and JP), blinded to partici-pant information, viewed all mammograms on high-resolution monitors for breast density assessment. Three readers (CB, CM, and JP) used Cumulus software developed at the University of Toronto (23,24). The fourth reader (GU) used Madena software developed at the University of Southern California (25). Both software tools calculated the number of pixels defined by the reader as dense within the breast and the number of pixels in the total breast area. The ratio of dense pixels to total pixel in the breast, expressed as a percentage, determined percent mammographic density.
Statistical Analyses
We used SAS 9.0 (Cary, NC) for data analyses and calculations of 95% confidence intervals (CIs) andPvalues based on the Wald test. All statistical tests were two-sided, and results were con-sidered statistically significant at a P value of less than .05. Univariate and bivariate analyses presented the primary vari-able distributions. A woman’s original randomized treatment arm (estrogen plus progestin or placebo) defined exposure, re-gardless of subsequent compliance. Initial logistic regression models evaluated the percent density and percent density change effects on breast cancer risk separately by reader. Although dense area values differed by reader, the comparison of the dense area measures between readers correlated highly
ARTICLE
(Pearson correlations ofR¼0.90–0.97), and breast area assess-ment also correlated highly between readers (Pearson correla-tions ofR¼0.94–0.99). Because univariate odds ratios (ORs) for breast cancer associated with mammographic density across the four readers were quite consistent, subsequent analyses used the mean mammographic density of the four readers (Table 1). The continuous variable of mammographic density compared a 1% difference in baseline mammographic density percent or 1% change in mammographic density percent.
Analytic Model
Because earlier WHI analyses established that estrogen plus progestin treatment increased breast cancer risk, our initial analyses determined if mammographic density change was as-sociated with increased breast cancer risk. To adjust for poten-tial confounders, logistic regression models included breast cancer risk factors associated with mammographic density change. The initial model contained center, age at baseline (continuous), ethnicity (non-Hispanic white, African American, and other) baseline BMI (continuous), BMI change (continuous), age at first birth (<20, 20–24, 25–29, 30–34, and 35þ years/miss-ing), parity (0, 1, 2, 3, missyears/miss-ing), length of follow-up (continuous), personal history of menopausal hormone therapy use (never, previous, current user prior to three-month washout), age at last birth (<20, 20–24, 25–29, 30þyears, and missing), time since menopause (continuous), first-degree family history of breast cancer (yes, no, and missing), and alcohol consumption at base-line (yes, no, and missing). Individually, factors least associated with cancer risk were considered for removal. Retained factors changed the beta estimate in the final model by 10% or more. The final model included age, baseline BMI, center, age at first birth, and parity. We evaluated effects of baseline mammo-graphic density and mammomammo-graphic density change stratified by treatment group, as well as potential interactions between
these measures. Separate logistic regression models adjusted for covariates included interaction terms for baseline density and treatment arm, baseline density and mammographic den-sity change, and treatment arm and mammographic denden-sity change. Additional analyses of quintiles of mammographic den-sity change evaluated potential nonlinear effects. Mammographic density change quintile cut-points were 0.6%, 4.6%, 10.7%, and 19.3% in the estrogen plus progestin group, and -2.8%, -0.51%, 0.40%, and 2.2% in the placebo group. Separate lo-gistic regression models evaluated mammographic density change associations across three levels of baseline mammo-graphic density (<10%, 10%–25%, and>25%). We calculated the attributable risk for increased mammographic density after es-trogen plus progestin initiation with 95% confidence intervals using bootstrap methods.
To evaluate how well this study represented the WHI clinical trial cohort, we determined estrogen plus progestin effects on breast cancer risk in this mammography substudy with logistic regression. We evaluated if the odds ratio differed after control-ling for mammographic density change, hypothesizing that a reduced or null odds ratio for breast cancer associated with es-trogen plus progestin would indicate that mammographic den-sity change explained the estrogen plus progestin influence on breast cancer risk. We conducted mediation analyses of the es-trogen plus progestin total effect on breast cancer risk, with mammographic density change as the mediating variable, to assess the proportion-mediated measure (indirect effect/total effect) (26).
Results
Women assigned placebos exhibited minimal mammographic density change over one year (mean change¼-0.05%) (Figure 1). In contrast, those assigned estrogen plus progestin had a larger and a broad distribution of mammographic density change Table 1.Baseline percent mammographic density and change in percent mammographic density and univariate odds ratios for the association with breast cancer risk by case status and treatment arm for each of four readers and the average of the four readers
Comparisons/subgroups
Reader
Average of all readers
1 2 3 4
Reliability coefficient 0.876 0.899 0.938 0.965
Baseline percent Mammographic density
Placebo (n¼432)
Controls (n¼355) Mean (SD) 20.42 (18.50) 9.50 (10.60) 12.84 (15.38) 14.66 (17.00) 14.36 (14.65)
Cases (n¼77) Mean (SD) 17.28 (13.91) 8.45 (8.99) 10.07 (11.41) 13.21 (14.50) 12.25 (11.60)
OR* (95% CI) 0.99 (0.98 to 1.00) 0.99 (0.97 to 1.02) 0.99 (0.97 to 1.01) 1.00 (0.98 to 1.01) 0.99 (0.97 to 1.01)
Estrogen plus progestin (n¼475)
Controls (n¼378) Mean (SD) 18.84 (15.88) 9.96 (10.29) 11.38 (13.02) 12.66 (14.18) 13.55 (13.01)
Cases (n¼97) Mean (SD) 22.20 (18.62) 12.96 (12.02) 15.89 (16.93) 14.59 (16.59) 17.54 (16/09)
OR* (95% CI) 1.01 (0.999 to 1.03) 1.02 (1.01 to 1.04) 1.02 (1.01 to 1.04) 1.02 (1.01 to 1.03) 1.02 (1.00 to 1.04)
Change in percent Mammographic density
Placebo (n¼432)
Controls (n¼355) Mean (SD) to 0.68 (9.85) to 0.06 (3.40) to 0.22 (5.44) 0.08 (4.36) to 0.22 (4.49)
Cases (n¼77) Mean (SD) 0.98 (10.45) to 0.12 (2.92) 0.74 (5.81) 1.32 (5.53) 0.73 (5.03)
OR* (95% CI) 1.02 (0.99 to 1.04) 0.99 (0.92 to 1.07) 1.03 (0.99 to 1.08) 1.06 (1.00 to 1.11) 1.05 (0.99 to 1.10)
Estrogen plus progestin (n¼475)
Controls (n¼378) Mean (SD) 12.66 (14.18) 4.45 (6.53) 4.17 (7.84) 10.57 (12.71) 9.49 (10.50)
Cases (n¼97) Mean (SD) 14.59 (16.59) 10.29 (12.64) 10.67 (14.85) 13.18 (15.82) 10.65 (12.63)
OR* (95% CI) 1.01 (0.99 to 1.02) 0.99 (0.96 to 1.03) 1.00 (0.99 to 1.02) 1.01 (1.00 to 1.03) 1.01 0.99 to 1.03
*Note that these are univariate results and the odds ratios for breast cancer correspond with having 1% more mammographic density at baseline and a 1% mean change in mammographic density. CI¼confidence interval; OR¼odds ratio.
ARTI
CLE
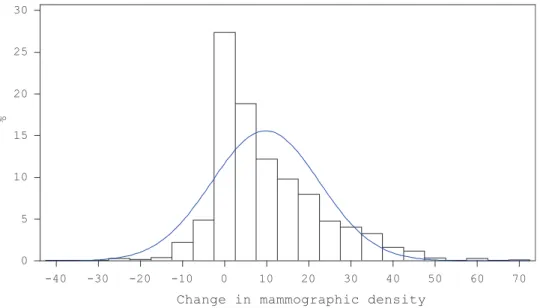
(mean change ¼9.7%) (Figure 2). Of the 432 placebo-assigned women, 202 (46.8%) increased in mammographic density while 230 (53.2%) decreased. In contrast, of 475 estrogen plus proges-tin–assigned women, 399 (84.0%) increased in mammographic density while only 76 (16.0%) decreased. After adjusting for co-variates including baseline density, the difference in mean change in mammographic density between the placebo (-0.65%, 95% CI¼-1.86 to 0.55) and the estrogen plus progestin (9.49%, 95% CI¼8.25 to 10.72) treatment arms was statistically signifi-cant (P<.001).
Overall, after adjustment, each 1% difference in baseline mammographic density increased breast cancer risk by 1% (OR¼1.01, 95% CI¼1.00 to 1.02). Additional adjustment for
treatment arm did not change this association. In treatment-stratified analyses, baseline mammographic density did not in-crease breast cancer risk among women assigned placebos, but breast cancer risk increased 3% among women assigned estrogen plus progestin (OR¼1.03, 95% CI¼1.01 to 1.05) with each 1% baseline density difference (Table 2). The interaction between baseline mammographic density with treatment (b¼ 0.032,P¼.02) was statistically significant. Controlling for baseline mammographic density (Table 2), a 1% change in mammographic density increased breast cancer risk 4%, but not statistically significantly, in women assigned placebos. In con-trast, the increased breast cancer risk in women assigned estro-gen plus progestin of 3% (OR¼1.03, 95% CI¼1.01 to 1.06) with a
-40 -30 -20 -10 0 10 20 30 40 50
0 10 20 30 40 50 60 70
%
Change in mammographic density
Figure 1.Distribution of change in mammographic density from baseline to at least one year after random assignment within participants from the placebo arm of the
Women’s Health Initiative. The mean change in percent mammographic density declined by 0.05%, with a median change in mammographic density of 0.0% and a standard deviation of 6.36.
-40 -30 -20 -10 0 10 20 30 40 50 60 70
0 5 10 15 20 25 30
%
Change in mammographic density
Figure 2.Distribution of change in mammographic density from baseline to at least one year after random assignment within participants from the estrogen plus
pro-gestin arm of the Women’s Health Initiative. The mean change in percent mammographic density increased by 9.73%, with a median change in mammographic den-sity of 6.02% and a standard deviation of 12.80.
ARTICLE
1% change in mammographic density was statistically signifi-cant. Controlling for baseline mammographic density, the inter-action between mammographic density change and treatment group was not statistically significant (P¼.34).Table 3shows the mammographic density change effects within strata of baseline density. In the placebo and the estrogen plus progestin arms, having more than 25% density at baseline reduced the magnitude of the association between mammographic density change and breast cancer risk (Table 3). Controlling for treat-ment arm and other covariates, baseline mammographic den-sity negatively interacted with mammographic denden-sity change (b¼-0.0013,P¼.03).
In addition to linear effects, we evaluated quintiles of mam-mographic density change based on the distributions within each randomized arm (Table 4). The cut-points for the upper quintile of mammographic density change were 2.2% or greater for women using placebo and 19.3% or greater for women using estrogen plus progestin. In the placebo arm, the increase in breast cancer risk was not statistically significant (OR¼1.20, 95% CI¼0.48 to 2.97) comparing the highest to the lowest quin-tile of mammographic density change. In contrast, there was a statistically significant 3.6-fold increased risk in breast cancer in the estrogen plus progestin arm comparing the highest with
the lowest quintile of mammographic density change (OR¼3.61, 95% CI¼1.52 to 8.56).
Women in the estrogen plus progestin arm had increased breast cancer risk compared with those in the placebo arm (OR¼1.28, 95% CI¼0.90 to 1.82), a finding comparable with the overall randomized clinical trial where a 24% increase was re-ported (hazard ratio [HR] ¼1.24, 95% CI¼1.01 to 1.54) (2,27). Including mammographic density change in the analytic model, no residual effect of estrogen plus progestin on breast cancer risk remained (OR¼1.00, 95% CI¼0.66 to 1.51). In an unadjusted mediation model, 97.4% of the estrogen plus progestin use ef-fect was mediated through density change, while in a model ad-justed for covariates and interaction, 100% of the estrogen plus progestin effect was mediated through density change. To de-termine if estrogen plus progestin only increased breast cancer risk when women had a very large (20%) mammographic den-sity change, we removed from the analysis those with a 20% or greater increase in mammographic density and a 13% increased breast cancer risk with hormone use persisted (OR¼1.13, 95% CI¼0.77 to 1.65). Further adjustment for mammographic den-sity change eliminated that association (OR¼0.97, 95% CI¼0.63 to 1.51). The attributable fraction comparing a 20% or greater in-crease to a less than 1% inin-crease in density identified that 17% of the breast cancer cases were potentially explained by in-creased breast density after estrogen plus progestin initiation.
Discussion
In this case-control study, nested in the WHI trial, breast cancer risk increased with increasing mammographic density follow-ing estrogen plus progestin initiation. For every 1% increase in mammographic density among those assigned estrogen plus progestin, breast cancer risk increased 3.4%. Adjustment for mammographic density change left no residual effect of com-bined estrogen plus progestin use on breast cancer risk. Our re-sults suggested that increased mammographic density with estrogen plus progestin initiation should raise concern and war-rant consideration of stopping therapy. In the WHI randomized trial, in addition to increasing breast cancer incidence (2), estro-gen plus progestin also statistically significantly interfered with breast cancer detection (28), leading to more advanced stage at diagnosis (2,29), increased breast cancer mortality (21), and other adverse health outcomes (30).
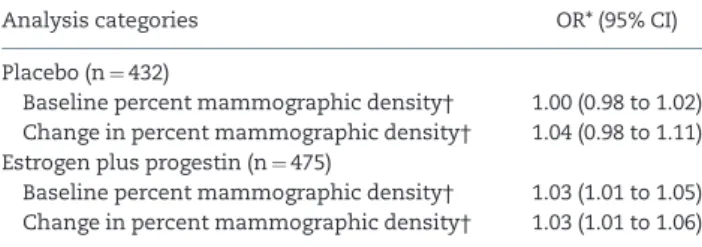
These results pertained to postmenopausal women initiat-ing estrogen plus progestin therapy and not to use of estrogen alone. This nested study’s strengths included the assessment of serial mammograms using validated quantitative measures of density and the WHI strengths of the randomized placebo-controlled trial design, large participant numbers, comprehen-sive breast cancer risk assessment, central breast cancer adjudi-cation, and requirement for annual mammography and clinical breast exam. Using the average measure of mammographic density from four readers provided a more conservative esti-mate of assessing mammographic density where no established gold standard for assessment exists. Retrospectively collecting mammograms required participant re-consent, limiting this study’s numbers. Although we obtained 61% of requested mam-mograms with differences in recovery by case-control status, no meaningful differences in mammogram recovery existed be-tween estrogen plus progestin and placebo-assigned partici-pants overall, reducing concerns of bias. We conducted an intent-to-treat analysis based on WHI random assignment. Our study measure, mammographic density change, would only be Table 2.Adjusted odds ratios and 95% confidence intervals for breast
cancer associated with continuous measures of baseline mammo-graphic breast density and change in percent mammomammo-graphic density
Analysis categories OR* (95% CI)
Placebo (n¼432)
Baseline percent mammographic density† 1.00 (0.98 to 1.02)
Change in percent mammographic density† 1.04 (0.98 to 1.11)
Estrogen plus progestin (n¼475)
Baseline percent mammographic density† 1.03 (1.01 to 1.05)
Change in percent mammographic density† 1.03 (1.01 to 1.06)
*All logistic regression models adjusted for baseline body mass index, age, clini-cal center, age at first birth, and parity, and the odds ratio is the increase in breast cancer risk with a 1% increase in mammographic density. These analyses were mutually adjusted for baseline and change in percent mammographic den-sity. CI¼confidence interval; OR¼odds ratio.
†A mean value based on the average of readers 1–4.
Table 3.The adjusted odds ratios and 95% confidence intervals asso-ciated with change of 1% mammographic breast density from base-line to one year by treatment group within strata of basebase-line density
Analysis category No. of cases/controls OR* (95% CI)
Placebo (n¼432)
Baseline density, %
<10 48/189 1.08 (0.98 to 1.18)
10–25 16/97 1.01 (0.89 to 1.15)
>25 13/69 1.01 (0.90 to 1.13)
Estrogen plus progestin
(n¼475)
Baseline density, %
<10 45/207 1.04 (1.00 to 1.07)
10–25 27/99 1.08 (1.02 to 1.14)
>25 25/72 0.94 (0.87 to 1.01)
*All odds ratio adjusted for age, baseline body mass index, clinical center, age at first birth, and parity and are the increase in breast cancer risk with a 1% change in mammographic density. CI¼confidence interval; OR¼odds ratio.
ARTI
CLE
minimally impacted by noncompliance (<10% at year 1). Given higher noncompliance with years of follow-up, in the WHI the true effect of mammographic density change on breast cancer risk was likely underestimated given the noncompliance in both arms of the study.
This study was not without limitations. The number of cases detected in the WHI clinical trial before the trial stopped and our ability to obtain mammograms limited this study’s size. The number of breast cancer cases in the placebo arm with both mammograms obtained (n¼77) could have limited detectabil-ity of statistically significant risk with a 1% increase in baseline breast density. We found statistically significant and slightly negative interactions between baseline mammographic density and treatment arm, and baseline mammographic density and mammographic density change with respect to breast cancer risk. Given this negative interaction and as the women who be-came cases in the estrogen plus progestin arm had higher base-line density despite random assignment, all analyses controlled for baseline density. The negative interaction with mammo-graphic density change suggested that already high breast can-cer risk in women with high baseline mammographic density did not increase as much with density change from estrogen plus progestin use as did risk for women who started with a low baseline mammographic density. However, this interaction should be interpreted with caution, as it may have reflected the limitations in measuring density change among women with dense breasts.
The current findings support emerging evidence that physi-ologic responses in breast tissue to hormone-based intervention may foreshadow subsequent breast cancer risk. For women as-signed estrogen plus progestin, in the highest 20th percentile of increased mammographic density, 3.6-fold increased breast cancer risk was statistically significant. Cuzick and colleagues (31) reported a breast cancer risk reduction among women with the greatest mammographic density reduction from a case-control study nested in the first International Breast Cancer Intervention Study (IBIS-I), a randomized prevention trial com-paring tamoxifen with placebo. In women receiving tamoxifen, the categorical mammographic density reduction was linked with subsequent breast cancer incidence reduction. However, analyses adjusting for tamoxifen-associated mammographic density change were not presented.
Measuring mammographic density at only one time point for each woman, Boyd and colleagues (32) provided indirect evi-dence that mammographic density was a biomarker of breast cancer risk. Combining data from three nested case-control studies, they found that estrogen plus progestin users who de-veloped breast cancer had higher mammographic density. Crandall and colleagues reported on breast tenderness onset in WHI estrogen plus progestin trial participants (33,34). After one
year, women using estrogen plus progestin compared with placebo experienced breast tenderness more often (36% vs 12%, P<.001) and breast cancer risk increased (P¼.02) for those tak-ing estrogen plus progestin who had breast tenderness. Mammographic breast density was associated with breast ten-derness, yet adjusting for breast tenderness onset did not re-move but lowered the estrogen plus progestin breast cancer risk association (HR¼1.19, 95% CI¼0.94 to 1.76, after adjustment) (33,35). In contrast, in our study, adjustment for mammographic density change eliminated the increased risk among estrogen plus progestin users, suggesting that mammographic density change better predicted breast cancer risk from estrogen plus progestin use than did breast tenderness.
In our analyses, after adjustment for mammographic density change, estrogen plus progestin use no longer increased breast can-cer risk (OR¼1.00, 95% CI¼0.66 to 1.51). Mediation analyses found no residual direct effect of estrogen plus progestin use on breast cancer risk after including the indirect mammographic density change effect. These findings clarify the estrogen plus progestin use, mammographic density change, and breast cancer risk associ-ations. In this study, mammographic density change with estrogen plus progestin use was an intermediate surrogate marker of breast cancer risk. Based on this study, doctors should evaluate changes in mammographic density in women who initiate estrogen plus progestin therapy and discuss the breast cancer risk implications.
Funding
This study was supported by the National Cancer Institute at the National Institutes of Health R01 CA105007 (EDP); the Mammogram Density Ancillary Study was funded by the National Cancer Institute at the National Institutes of Health R01 CA76017 (GH); the Women’s Health Initiative program was funded by the National Heart, Lung, and Blood Institute at the National Institutes of Health, US Department of Health and Human Services, through contracts HHSN268201100046C, HHSN268201100001C, HHSN268201100002C, HSN268201100003C, HHSN268201100004C, and HHSN271201100004C.
Notes
The funders had no role in the design of this study; the collec-tion, analysis, or interpretation of the data; the writing of the manuscript; or the decision to submit the manuscript for publi-cation. The views expressed are those of the authors and do not necessarily reflect the official views of the Uniformed Services University of the Health Sciences or the US Department of Defense.
Table 4.Breast cancer risk by quintile of change in percent mammographic density
Analysis categories Q1* Q2 Q3 Q4 Q5
Placebo (n¼432)
Cut-points† <-2.77 <-0.51 <0.40 <2.2 2.2
OR (95% CI) 1.00 (ref) 0.94 (0.38 to 2.30) 1.38 (0.54 to 3.48) 0.96 (0.38 to 2.43) 1.20 (0.48 to 2.97)
Estrogenþprogestin (n¼475)
Cut-points† <0.64 <4.61 <10.68 <19.32 19.32
OR (95% CI) 1.00 (ref) 1.77 (0.76 to 4.12) 1.04 (0.45 to 2.43) 1.72 (0.74 to 4.02) 3.61 (1.52 to 8.56)
*Q1 is the reference category for comparisons within the treatment arm. All odds ratios adjusted for age, baseline body mass index, clinical center, age at first birth, and parity. CI¼confidence interval; OR¼odds ratio.
†Quintile cut-points of change in percent mammographic density.
ARTICLE
WHI Investigators: Program Office: (National Heart, Lung, and Blood Institute, Bethesda, MD) Jacques Rossouw, Shari Ludlam, Dale Burwen, Joan McGowan, Leslie Ford, and Nancy Geller; Clinical Coordinating Center: (Fred Hutchinson Cancer Research Center, Seattle, WA) Garnet Anderson, Ross Prentice, Andrea LaCroix, and Charles Kooperberg; Investigators and Academic Centers: (Brigham and Women’s Hospital, Harvard Medical School, Boston, MA) JoAnn E. Manson; (MedStar Health Research Institute/Howard University, Washington, DC) Barbara V. Howard; (Stanford Prevention Research Center, Stanford, CA) Marcia L. Stefanick; (The Ohio State University, Columbus, OH) Rebecca Jackson; (University of Arizona, Tucson/Phoenix, AZ) Cynthia A. Thomson; (University at Buffalo, Buffalo, NY) Jean Wactawski-Wende; (University of Florida, Gainesville/ Jacksonville, FL) Marian Limacher; (University of Iowa, Iowa City/Davenport, IA) Robert Wallace; (University of Pittsburgh, Pittsburgh, PA) Lewis Kuller; (Wake Forest University School of Medicine, Winston-Salem, NC) Sally Shumaker; Women’s Health Initiative Memory Study: (Wake Forest University School of Medicine, Winston-Salem, NC) Sally Shumaker.
References
1. Rossouw JE, Anderson GL, Prentice RL, et al. Risks and benefits of estrogen plus progestin in healthy postmenopausal women: Principal results from the Women’s Health Initiative randomized controlled trial.JAMA.2002;288(3): 321–333.
2. Chlebowski RT, Hendrix SL, Langer RD, et al. Influence of estrogen plus pro-gestin on breast cancer and mammography in healthy postmenopausal women: The Women’s Health Initiative Randomized Trial. JAMA.2003; 289(24):3243–3253.
3. Hersh AL, Stefanick ML, Stafford RS. National use of postmenopausal hor-mone therapy: Annual trends and response to recent evidence.JAMA.2004; 291(1):47–53.
4. Haas JS, Kaplan CP, Gerstenberger EP, Kerlikowske K. Changes in the use of postmenopausal hormone therapy after the publication of clinical trial re-sults.Ann Intern Med.2004;140(3):184–188.
5. Hing E, Brett KM. Changes in US prescribing patterns of menopausal hor-mone therapy, 2001–2003.Obstet Gynecol.2006;108(1):33–40.
6. Ravdin PM, Cronin KA, Howlader N, et al. The decrease in breast-cancer inci-dence in 2003 in the United States.N Engl J Med.2007;356(16):1670–1674. 7. Verkooijen HM, Bouchardy C, Vinh-Hung V, Rapiti E, Hartman M. The
inci-dence of breast cancer and changes in the use of hormone replacement ther-apy: A review of the evidence.Maturitas.2009;64(2):80–85.
8. Coombs NJ, Cronin KA, Taylor RJ, Freedman AN, Boyages J. The impact of changes in hormone therapy on breast cancer incidence in the US popula-tion.Cancer Causes Control.2010;21(1):83–90.
9. Hausauer AK, Keegan TH, Chang ET, Glaser SL, Howe H, Clarke CA. Recent trends in breast cancer incidence in US white women by county-level urban/ rural and poverty status.BMC Med.2009;7:31.
10. Byrne C, Schairer C, Wolfe J, et al. Mammographic features and breast cancer risk: Effects with time, age, and menopause status.J Natl Cancer Inst.1995; 87(21):1622–1629.
11. Boyd NF, Lockwood GA, Byng JW, Tritchler DL, Yaffe MJ. Mammographic den-sities and breast cancer risk.Cancer Epidemiol Biomarkers Prev.1998;7(12): 1133–1144.
12. McCormack VA, dosSantos SI. Breast density and parenchymal patterns as markers of breast cancer risk: A meta-analysis.Cancer Epidemiol Biomarkers Prev.2006;15(6):1159–1169.
13. Stomper PC, Van Voorhis BJ, Ravnikar VA, Meyer JE. Mammographic changes associated with postmenopausal hormone replacement therapy: A longitu-dinal study.Radiology.1990;174(2):487–490.
14. Greendale GA, Reboussin BA, Sie A, et al. Effects of estrogen and estrogen-progestin on mammographic parenchymal density. Postmenopausal Estrogen/Progestin Interventions (PEPI) Investigators.Ann Intern Med.1999; 130(4 pt 1):262–269.
15. McTiernan A, Martin CF, Peck JD, et al. Estrogen-plus-progestin use and mammographic density in postmenopausal women: Women’s Health Initiative randomized trial.J Natl Cancer Inst.2005;97(18):1366–1376. 16. Laya MB, Gallagher JC, Schreiman JS, Larson EB, Watson P, Weinstein L. Effect
of postmenopausal hormonal replacement therapy on mammographic den-sity and parenchymal pattern.Radiology.1995;196(2):433–437.
17. Sterns EE, Zee B. Mammographic density changes in perimenopausal and postmenopausal women: Is effect of hormone replacement therapy predict-able?Breast Cancer Res Treat.2000;59(2):125–132.
18. Colacurci N, Fornaro F, De Franciscis P, Palermo M, del Vecchio W. Effects of different types of hormone replacement therapy on mammographic density. Maturitas.2001;40(2):159–164.
19. Boyd NF, Byng JW, Jong RA, et al. Quantitative classification of mammo-graphic densities and breast cancer risk: Results from the Canadian National Breast Screening Study.J Natl Cancer Inst.1995;87(9):670–675.
20. Design of the Women’s Health Initiative clinical trial and observational study. The Women’s Health Initiative Study Group.Control Clin Trials.1998; 19(1):61–109.
21. Chlebowski RT, Anderson GL, Gass M, et al. Estrogen plus progestin and breast cancer incidence and mortality in postmenopausal women.JAMA. 2010;304(15):1684–1692.
22. Stone J, Gunasekara A, Martin LJ, Yaffe M, Minkin S, Boyd NF. The detection of change in mammographic density.Cancer Epidemiol Biomarkers Prev.2003; 12(7):625–630.
23. Byng JW, Boyd NF, Fishell E, Jong RA, Yaffe MJ. The quantitative analysis of mammographic densities.Phys Med Biol.1994;39(10):1629–1638.
24. Yaffe MJ. Mammographic density. Measurement of mammographic density. Breast Cancer Res.2008;10(3):209.
25. Ursin G, Ma H, Wu AH, et al. Mammographic density and breast cancer in three ethnic groups.Cancer Epidemiol Biomarkers Prev.2003;12(4):332–338. 26. Vanderweele TJ. A unification of mediation and interaction: A 4-way
decom-position.Epidemiology.2014;25(5):749–761.
27. Chlebowski RT, Anderson GL. Changing concepts: Menopausal hormone therapy and breast cancer.J Natl Cancer Inst.2012;104(7):517–527.
28. Chlebowski RT, Anderson G, Pettinger M, et al. Estrogen plus progestin and breast cancer detection by means of mammography and breast biopsy.Arch Intern Med.2008;168(4):370–377.
29. Chlebowski RT, Kuller LH, Prentice RL, et al. Breast cancer after use of estro-gen plus progestin in postmenopausal women.N Engl J Med.2009;360(6): 573–587.
30. Manson JE, Chlebowski RT, Stefanick ML, et al. Menopausal hormone therapy and health outcomes during the intervention and extended poststopping phases of the Women’s Health Initiative randomized trials.JAMA.2013; 310(13):1353–1368.
31. Cuzick J, Warwick J, Pinney E, et al. Tamoxifen-induced reduction in mam-mographic density and breast cancer risk reduction: A nested case-control study.J Natl Cancer Inst.2011;103(9):744–752.
32. Boyd NF, Melnichouk O, Martin LJ, et al. Mammographic density, re-sponse to hormones, and breast cancer risk.J Clin Oncol.2011;29(22): 2985–2992.
33. Crandall CJ, Aragaki AK, Chlebowski RT, et al. New-onset breast tenderness after initiation of estrogen plus progestin therapy and breast cancer risk. Arch Intern Med.2009;169(18):1684–1691.
34. Crandall CJ, Aragaki AK, Cauley JA, et al. Breast tenderness and breast cancer risk in the estrogen plus progestin and estrogen-alone Women’s Health Initiative clinical trials. Breast Cancer Res Treat. 2012;132(1): 275–285.
35. Altman DG, Bland JM. How to obtain the confidence interval from aPvalue. BMJ.2011;343:d2090.
ARTI
CLE