
Pak. J. Engg. & Appl. Sci. Vol. 12, Jan., 2013
(
p. 111-126)111
Improving the Environmental Performance of Bus-based Public
Transport System in Lahore-Pakistan
R. Hameed1and G.A. Anjum1
1. Department of City and Regional Planning, University of Engineering and Technology, Lahore. E-mail:[email protected]
Abstract
The bus-based public transport system in developing countries poses serious environmental challenges. This paper explores the environmental performance of buses managed and operated by private companies in Lahore under franchise initiative of Government of Punjab. The empirical evidence shows that buses pollute the air with CO and NOx emissions. The bus-based air pollution is result of obsolete engine technology, poor maintenance regime, excessive passenger load, and inadequate training of bus drivers. The problem of air pollution increases due to lack of regulatory measures on operators to maintain vehicles in good condition. The paper suggests that effective inspection and maintenance regime, careful selection of new engine technologies, mixed fuel strategy and segregated bus ways can help achieving the reduction in total vehicle emissions.
Key Words
: Environmental performance; urban public transport; bus emissions; motor vehicle inspection; private bus operators1. Introduction
Buses being a main mode of urban public transport can play an important role in social and economic development of cities. However, a key environmental concern about bus-based public transport relates to its contribution to local air pollution. Buses can affect air quality both by emitting pollutants as well as by reducing congestion and emissions caused by vehicles replaced by them. The experience from several developed and developing countries suggests that there are many mechanisms for minimizing the environmental impact of public transport. These include the introduction of rail based options, bus rapid transit systems [1][2], enforcement of high technological standards [3] and promoting the use of alternate fuels in public transport [4], introduction of rigorous inspection and maintenance program [5], phasing out old vehicles [1], use of fiscal instruments [6], and traffic management measures [6].
Globally, there is a trend of growing support for bus rapid transit (BRT) systems as an alternative to heavy and light rail systems in many cities of developing countries [7] though examples of BRT system can also be found in some developed countries like Australia, France, South Korea, and
Canada [1]. In particular, the experience of improved bus-based public transport systems in some cities of Latin American countries has come up as the most effective strategy to ensure not only cost-effective and space-efficient motorized travel for a large number of citizens but also to help achieving the reduction in total vehicle emissions. For instance, the bus transit system in Brazilian cities particularly that in the city of Curitiba is well recognized internationally. Based on intersecting busways and supported by a large network of feeder buses, the system caters to the needs of millions of passengers daily with nearly 50% of all daily motorized trips only on buses running in busways [4].
The use of less polluting fuel (composed by a combination of 89.4% diesel, 8% anhydrous alcohol, and 2.6% soybean additive) cuts the emissions of particles to the air by up to 43% [8]. It may be noted that since mid 2009, all buses in Curitiba are using B4+S50 diesel, which means 4% bio-diesel mixed to a diesel that contains 50 parts per million sulphur, which in fact is improvement on previous B4+S500 mix [9]. Further, the system has resulted in increase of ridership by over 2 % a year for over two decades, which was a remarkable achievement at the time when every other Brazilian city was experiencing significant declines in the public transport share [10].
Pak. J. Engg. & Appl. Sci. Vol.12, Jan., 2013
Similarly, the TransMilenio bus system in Bogotá, Columbia has not only gained respect of citizens of the city but has also attracted worldwide attention since commencing service in 2000. The 40-mile network of trunk corridors was carrying over one million passengers per day by early 2006 with up to 41,000 passengers per hour per direction during peak times [11]. By the middle of 2005, 11% of the TransMilenio bus service passengers were former private car drivers [12]. At considerably lower capital cost, the bus system provides one of the most dramatic illustrations of BRT’s ability to accommodate passenger volumes normally associated with rail transit. On the environment front, the system has resulted at least in localized rather than citywide positive impact on air pollution with a 43% reduction in Sulphur Dioxide, an 18% reduction in Nitrogen Dioxide, and a 12% reduction in particulate matter in the vicinity of Caracas Avenue, one of the trunk corridor busway in the city [11].
Likewise, the introduction of bus-way system in Quito, Ecuador has significantly increased bus rider-ship. The system has been developed using electric trolley buses in exclusive lanes. Although it is costly as compared to other bus options, the Quito’s bus-way system neither produces urban emissions nor greenhouse emissions, since the electricity is produced mainly by hydropower [4].
It has been argued that although BRT system holds the potential to make all cities more efficient, cleaner, less congested and more sustainable. But those aspiring to aggressively develop such systems would need to generate sufficient political will as well as require technical assistance and transfer of experience and learning from successful cities [4].
Another important aspect to be considered in the context of bus-based public transport systems is that, a range of options are now available in terms of better engine technologies and cleaner fuels. At the one extreme are options like simply maintaining existing buses to a higher standard and making incremental improvements in diesel buses through improved engine design, emission control and fuel quality. At the other end are hybrid-electric and fuel-cell propulsion systems. Alternative cleaner fuels like compressed natural gas (CNG) and liquefied petroleum gas (LPG) lie anywhere in-between range
of fuels which are neither inexpensive nor easy to establish as system but which could provide interim solution [4]. Given the varying costs and complexity of issues involved in implementation process of these range of options, it is extremely important to carefully select an appropriate option which may not only help in minimizing pollution but also keep bus-based public transport operation viable and affordable.
Further, the lessons based on international experience on the environmental implications of urban buses as laid down in a World Bank briefing note prepared under Energy Sector Management Assistance Programme (ESMAP) can serve as a guide for making improvements in bus-based public transport systems:
“-Imposing high vehicle standards without attention to the financial sustainability of bus operations can undermine their viability with counterproductive effects. -Improving the efficiency of bus operations is critical to the sustainable environmental improvement of bus transport.
-Priority in use of road infrastructure, and particularly the creation of segregated busway systems, is a most effective basis for sustaining environmental standards for buses.
-Competition for franchises also significantly reduces costs and can be designed to support environmental improvement.” [13].
The provincial governments in Pakistan have been striving to redress urban public transport problems through bus operation under public as well as private ownership. Reducing pollution and congestion through the introduction of bus-based public transport system has been at least an implicit goal in addition to the explicit aim of improving accessibility for city residents. In 1999, the Government of Punjab launched a franchised based urban public transport system in five major cities of province (including Lahore) with the view to provide an efficient public transport service that must be safe, convenient, reliable, and environment friendly. As a result several local and foreign transport investors started operation of bus services. An overall assessment of the said franchise
Improving the Environmental Performance of Bus-based Public Transport System in Lahore-Pakistan
113
system with respect to major cities of the province has been done elsewhere [14].
This paper addresses the environmental aspects of the new urban public transport system with particular focus on Lahore. The analysis presented in this paper is based on: firstly, data collected through surveys and interviews with key informants conducted by the authors as part of a faculty research project; and secondly, emission data of selected buses collected as part of two undergraduate research theses under the guidance and close supervision of the authors in the field.
The next section presents a review of literature concerning policy options that can ensure use of low emission buses. This is followed by an overview of Lahore and its urban public transport system. Next, the paper looks at the regulatory framework for motor vehicle inspection and maintenance system in Lahore. Then the underlying causes of dismal environmental performance of buses are discussed. This is followed by a comparative analysis of emissions of selected buses of two bus operators. The final section concludes the discussion by suggesting key interventions to improve the situation.
2. Policy Options for Low Emission
Buses
Internal combustion engine fuelled by a fossil fuel today powers most of the motor vehicles around the globe including urban buses. This technology is advancing and capable of achieving low levels of conventional pollutants, particularly where ultra low sulfur fuel is available [17]. The fully integrated systems approach of the new diesel engine technology encompassing electronic control systems, oxidation catalysts, wall-flow diesel particulate filters, and other improved diesel engine components has resulted in more than order-of-magnitude emission reductions [18]. For instance, based on review developed from 25 studies on comparison of emissions from vehicles fueled with diesel or CNG, researchers [19] have found that exhaust after-treatments like use of oxidation catalysts and catalyzed particulate filters reduced most emissions in diesel buses to levels similar to those in case of CNG buses fitted with oxidation catalysts or three-way catalysts.
In response to air quality concerns, advances in diesel engine technology have also resulted in development of hybrid-electric buses which combine internal combustion engine with electric motor. The experience in some countries shows that diesel hybrid-electric buses are much cleaner than conventional diesel buses. Emission testing of selected New York City Transit’s buses indicated that for hybrid buses using ultra low sulfur diesel, carbon monoxide was 97% lower, NOx were 36% lower, hydrocarbons were 43% lower, particulate matter was 50% lower, and carbon dioxide was 19% lower as compared with conventional diesel buses [20]. Similarly, Sao Paolo has successfully deployed Brazilian made hybrid-electric buses, which meet very stringent Euro V standards and provide 33-39% lower fuel consumption of diesel fuel compared to conventional buses [1].
Fuel cell technology is another alternative with the potential to offer opportunities for significant reductions in emissions. A team of researchers [21] has compared different alternatives of a fleet of buses for urban transport operating in the urban area of Torino, Italy. The comparison involved evaluation of pollutant emissions from selected buses in a year, in addition to economic and social costs. The results of the study showed zero emissions for hydrogen fuel cell bus with respect to hydrocarbons, carbon monoxide, NOx, particulate matter and carbon dioxide as compared with fuel cell bus fuelled with methanol and buses with internal combustion engine using diesel oil and natural gas.
Although the understanding of the fuel cell technology is approaching maturity, many issues remain in early development. In particular, costs, parallel development of electric-drive systems, onboard fuel storage and re-fuelling infrastructure issues are likely to impede hydrogen fuel cells from becoming a competitive technology perhaps for another decade or more [22].
Effective vehicle inspection and maintenance program is another instrument to serve as a major component of an overall strategy of emission reduction from motor vehicles including buses. The inspection and maintenance program being implemented in Santiago de Chile comprises of vehicle type approval, periodical inspection and
road-Pak. J. Engg. & Appl. Sci. Vol.12, Jan., 2013
side inspection. The buses have to fulfill the Euro 3 standards with respect to carbon monoxide, hydrocarbons, and NOx emissions with urban buses additionally required to be equipped with diesel particulate filer to meet Euro 4 standards for particulate emissions. Two of the 25 automated inspection stations managed by private operators are for urban and interurban buses where these are inspected for safety aspects and for exhaust gas emissions. The opacity of buses is measured both at free acceleration, which is the most common form of test worldwide, as well as at full load and maximum torque revolutions per minute. To supplement periodical inspections, road-side inspection is also done whereby vehicles are stopped on the road to perform tests for exhaust gas emissions. Initially, nearly 30% of the buses failed road-side inspection test but now the failure rate has fallen to about 10% [23]. Although it is not possible to isolate the effects of inspection and maintenance program, yet the effects of Santiago’s efforts to clean up the air can be seen from decrease in concentration of PM10 from 106 ug/m3 to 65 ug/m3 and that of PM 2.5, which is associated with diesel exhaust, from 70 ug/m3 to 33 ug/m3 [1].
Similarly Mexico City’s inspection and maintenance program is among the longest running program and widely acknowledged as one of the most successful in the developing world. The program has evolved over the years and currently requires inspection of vehicles of certain age every six months at privatized test only centres funded by inspection fees that result from an effective compliance scheme. Mexico City experience provide compelling evidence in favor of test-only facilities, which are strongly recommended for developing countries due to poor performance of the test-and-repair approach in these countries and because these offer better opportunities to prevent cheating and corruption associated with testing and repairs. However, good management, quality control and political will are still required for effectiveness of even test-only facilities for inspection and maintenance programs [5].
A safe and economical driving style not only can improve road safety but also help mitigate negative environmental impacts of bus transportation through gains from fuel economy. The use of the
concept of eco-driving has been widespread in Europe and the primary thrust of eco-driving is a smoother driving style with the key purpose of reducing fuel consumption and emissions. The eco-driving trainings in Austrian Bus Company NIGGBUS helped reducing fuel consumption by 5% in day-to-day driving in the year 2000 with the effect increasing up to 7% in the year 2001 [24].
Applying eco-driving concept in developing countries can deliver fuel savings and consequent emission reductions. This observation has been validated recently through field tests conducted for over 10 weeks as part of the energy sector management assistance program of the World Bank in three cities of India namely Hyderabad, Vijayawada and Mysore. The field tests involved monitoring of pre-training and post-training performance of 120 drivers concerning fuel-efficient bus driving. The data showed an average fuel economy improvement in the 5 to 10 percent range. Moreover the greatest benefit was found coming from on-road training rather than classroom instruction [25]. Similarly, energy-saving driving courses conducted over the years for bus drivers under the auspices of GTZ in Indonesia, Argentina, Chile and Costa Rica proved that the participants of such courses achieved fuel savings of up to 20 percent [26]. In order to ensure that the drivers adopt and continue applying the more economical style of driving, it is equally important to provide them with some incentives to do so. To this end, providing monetary incentives to drivers are likely to be most effective way to assure sustainability [26].
Another approach taken by countries to ensure reduction in emissions from buses is to improve fuel quality. Reducing the level of sulfur in fuels can cut down harmful emissions in three ways: first, by directly reducing sulfur dioxide and sulfate particulate matter; second, by achieving better performance from the emissions control systems; and thirdly by enabling the use of new emissions control technologies [27]. Ultra low sulfur (<50 ppm) diesel fuel is now available in Europe and the United States, and its use has shown reductions in emissions of sulfur dioxide and particulate matter from heavy duty vehicles like buses, particularly when used in conjunction with exhaust after-treatment systems [4]. For instance, in the New York City Transit Authority
Improving the Environmental Performance of Bus-based Public Transport System in Lahore-Pakistan
115
demonstration program, the emissions test results of transit buses using ultra low sulfur diesel and equipped with continuously regenerating diesel particulate filter showed more than 90% reductions in particulate matter, carbon monoxide, and total hydrocarbons [28]. The technology for reducing sulfur in diesel fuel is available but shifting to ultra low sulfur diesel in case of developing countries is challenging and requires huge refinery investments, legislative backup, and commitment to improving air quality.
Experience in several countries suggests that there are significant benefits associated with shift from conventional fuels for buses to alternative fuels like CNG and LPG. For instance, the implementation of CNG Program in Delhi, India, involving conversion or replacement of buses along with 3-wheelers and taxis in the light of a Supreme Court ruling in 1998 has been impressive. In 2002 the entire bus fleet in Delhi became diesel free [1]. The conversion of all buses to CNG has helped reducing PM10, CO, and SO2 concentrations in Delhi [29].
Another best example of the viability of alternative fuel like LPG for urban buses can be cited of Vienna in Italy where Vienna Transport Board has been using LPG in its bus fleet for decades. The LPG bus costs 10% higher than the diesel versions and maintenance costs are 5-10% higher partly due to frequent inspections of fuel system and catalytic converters. Nevertheless, use of LPG has shown to reduce emissions (particularly CO and PM) from buses as compared to diesel. Moreover, applying three-way catalytic converters on buses has helped reducing NOx emissions by 80% compared to diesel [4].
Diethyl ether is amongst alternative fuels which are currently subject of much interest due to its potential to help reduce emissions. An experimental study evaluating and comparing the performance and exhaust emissions characteristics of neat diesel fuel with diesel fuel blends with 8%, 16% and 24% diethyl ether concluded that diethyl ether as supplement to conventional diesel is a promising fuel for diesel engines. The test results showed that with the exception of unburned hydrocarbons, significant reductions in smoke, NOx and CO emissions were achieved with the use of all the three diethyl ether
diesel fuel blends with respect to those of the neat diesel fuel. Moreover the trend was that higher the percentage of diethyl ether in the blend, the higher was the reduction in emissions [30]. Similarly, renewable bio-fuels like biodiesel are also receiving scientific attention driven by factors such as need to reduce green-house effect and energy dependence. An experimental investigation evaluating the performance of mini-bus diesel engine using sunflower and cottonseed based biodiesel blends concluded that these can be used safely and advantageously with cottonseed biodiesel showing a small superiority over sunflower bio-diesel in terms of soot and CO emissions [31].
3. Lahore and its Urban Public
Transport System
Lahore is the provincial capital of the Punjab and the second largest city of Pakistan. Since independence of the country in 1947, the city has transformed itself into a cultural, educational, recreational, transportation, and industrial centre of the nation. The population of Lahore has increased from 6.3 million in 1998 (when the last national census was conducted) to an estimated 8.7 million in 2011 [32]. Similarly, the average monthly household income in early 1990s was Rs. 3900 [33] whereas it was estimated to be Rs. 10,000 and Rs. 20,000 respectively for low-income and middle-income groups in 2010 [34]. The continually increasing growth in population and economic activities has resulted in steady increase in the demand for transport facilities. The expansion of the city characterised by vast and low-density urban development particularly to the east, southeast and southwest directions has resulted in poor community formation with weak internal relationship, and inconvenient access to urban facilities [34]. This situation has greatly helped in pushing further the demand for high level of transport movement. Consequently, walking and cycling has become increasingly difficult and there is an increase in dependence on private vehicles like motor cycles and cars for commuting with large load on arterial roads. The dependency on private vehicles is also reflected through rapid rate of motorization in Lahore with registered vehicles increasing sharply by 294% and the number of motorized vehicles per 1,000 residents increasing from 95 to 238 vehicles between 2001 and
Pak. J. Engg. & Appl. Sci. Vol.12, Jan., 2013
2008 [34]. It may also be noted that motorcycles made up 60% and cars represented one third of all the registered vehicles in Lahore in 2010 [32]. In addition to housing development in the periphery of the city, other reasons for the sharp growth in the number of private vehicles in Lahore include rapid population growth, unavailability of alternative transport, favourable policies for ownership of private vehicles and heavy investment in roads [35].
Lahore offers a variety of urban public transport services exclusively owned and operated by private sector operators. These include large-sized buses (with capacity of 70 passengers), 15 and 26 seated wagons and mini-buses, 10 seated mini-vans, 6 seated motor-cycle rickshaws and limited number of regular taxi/radio cabs. Besides, a large number of auto-rickshaws are providing service similar to taxis. It has been argued by a researcher [36] that public transport becoming the prerogative of the private sector in Pakistani cities including Lahore due to lack of concerted efforts on the part of the government to strengthen professional, administrative and financial capacity of public transport institutions and the adoption of policy to encourage the private sector in operating public transport services.
The bus-based public transport in Lahore was of low-quality, unsafe, unreliable, inefficient and inadequate because of inappropriate regulatory control and planning [37]. In order to address these problems, brand new large-sized buses were introduced in 1999 in significant number in the city under the franchised based urban public transport system initiative of the Government of Punjab. The purpose was not only to meet the travel needs of the large section of population of sprawling metropolis but also to help reduce air pollution. Considering the reluctance of the private sector operators to invest in full size buses, a package of financial and other incentives was offered. One of the most significant incentives was that the operator would have an exclusive right to operate a bus service on a specific route subject to conditions defined in the franchise agreement. Other incentives included subsidy on mark-up of loan, subsidized lease of depots, and exemption of custom duty on the import of CNG or diesel buses in complete-knock-down (CKD) condition [38].
Several measures were adopted by the franchisees which were meant directly or indirectly to
keep the new buses in road-worthy condition. Thus, some franchisees set up their own workshops. They recruited qualified staff to run these workshops to ensure proper maintenance service for their buses. Similarly some franchisees also instituted training schools to improve driving skills of recruited drivers with the view not only to ensure maximum safety in bus operation but also to keep emissions from buses on the lower side. In order to avoid use of adulterated fuel and to save money through bulk buy, most franchisees set up fuel filling stations too at their depots and entered into agreement with recognized companies, like Shell, Total, Caltex, and Pakistan State Oil, to get fuel direct from the sale points of those companies.
The number of large-sized diesel-run buses peaked in Lahore in 2005 when 925 buses were plying on different routes under the franchise initiative. However, the number of these large-sized buses has been declining since 2005 due to different factors but mainly because of steady rise in price of diesel, increased operational costs and in the wake of decision of the Supreme Court of Pakistan declaring the franchise law as ultra-virus to the Constitution of the country. Resultantly, the Government of Punjab took necessary legislative and administrative measures in the light of direction of the court to ensure that operation of urban public transport system is based on open competition, and it provides equal opportunity to all the operators including the wagon operators. Table 1 presents age-wise data of buses by the year 2008 which were operational under the franchise initiative since 1999 in Lahore.
In the wake of continuous decline in the number of franchise buses owing to reasons mentioned above and with the view to bring improvement in bus operation in the city, the Government of Punjab has established the Lahore Transport Company (LTC) in 2009. The LTC has been tasked to serve as a regulatory body with the mission to plan and facilitate a high quality, safe, efficient, environment friendly and affordable urban public transport in Lahore [39]. Presently, the LTC is regulating the operation of about 300 large-sized buses of private operators in the city which includes both the leftover buses previously operational under the franchise initiative as well as new buses inducted by the new private operators. The LTC is making all out efforts
Improving the Environmental Performance of Bus-based Public Transport System in Lahore-Pakistan
Table 1: Age-wise details of buses operating in Lahore under franchise initiative by 2008 [40]
Sr. No.
Bus Operator
Manufacturer of Bus
No. of buses
No. of buses with respect to age (years)
8 7 6 5 4 3
1. New Khan Hinopak 260 80 80 - 50 50 -
2. Daewoo Daewoo 70 20 50 - - - -
3. Premier Hinopak 121 - - - 55 66 -
4. Bloch Isuzu 24 - - - 24 - -
5. Mono-lite Iveco/Isuzu 61 - - - 52 9 -
6. Al-Barak Isuzu 39 - - - - 39 -
7. Citibus Hinopak 85 - - - 40 45 -
8. BHK Hinopak 44 - - - 15 29 -
9. Skyways Hinopak 40 - - - - 40 -
10. ABC Hinopak/Isuzu 34 - - - - 34 -
11. Makks Hinopak/Isuzu 32 - - - - 20 12
12. Niazi Hinopak 50 - - - - 20 30
TOTAL 860 100 130 - 236 352 42
to induct more buses into the system. Interview with concerned official of LTC has revealed that recently a Chinese transport firm (Foton Bus Company) has brought a fleet of 111 new imported CNG buses in Lahore under an agreement with the LTC. Of the 111 buses, 56 are operating on two routes while the remaining 55 buses of the said company are expected to be running in the city soon following the completion of the process of route allocation. Similarly a pact has been signed recently by the LTC with another Chinese firm, Anhui Ankai Automobile Company, for provision of 575 modern CNG air-conditioned buses [41]. It is also important to note that in order to streamline the urban public transport system in Lahore, the Government of Punjab has completed feasibility study of rapid mass transit system in 2007 [42]. Reference design for one out of four major corridors has also been finalized but due to financial crunch the project has been deferred for the time being.
4. Regulatory Framework for Motor
Vehicle Inspection and Maintenance
An efficient inspection and maintenance system can prove as one of the most cost-effective means of controlling emissions from motor vehicles. In Punjab, the Motor Vehicle Ordinance (MVO) 1965 and the Motor Vehicle Rules (MVR) 1969 provide the legalframework for motor vehicle inspection and maintenance. In particular, Section 35 of the MVO necessitates that each government and private commercial vehicle (including buses) should be issued a bi-annual certificate of fitness after thorough examination by the Motor Vehicle Examiner (MVE) of Provincial Transport Authority [43]. For this, the motor vehicle brought to the office of the MVE must be inspected in accordance with the requirements of MVR with particular emphasis on general condition of vehicle, front suspension, brake system, engine compression and smoke. The purpose is to ensure that only safe and environmentally fit vehicles are allowed to come on road. However, a closer look at the MVR shows that the provisions concerning environmental aspects are of general nature with no specific testing procedures.
Similarly in 1993, the Government of Pakistan notified the National Environmental Quality Standards for motor vehicles, which covered only three parameters viz smoke, carbon monoxide, and noise [44]. These were followed by NEQSs in 2009 for motor vehicle exhaust and noise [45]. The NEQSs notified in 2009 retained the 1993 standards concerning the above mentioned three parameters for in-use vehicles including buses while prescribing permissible limits of carbon monoxide,
Pak. J. Engg. & Appl. Sci. Vol.12, Jan., 2013
118
hydrocarbons, Nitrogen oxides, particulate matter and noise pollution from new heavy-duty diesel engine vehicles separately. Despite that no formal institutional arrangements have been made since the introduction of motor vehicle standards for the first time in 1993 for their effective implementation.
Due to inadequate staffing and equipment, the Government of Punjab has been trying to involve the private sector through out-sourcing of motor vehicle examination system involving licensing of automobile workshops to inspect and issue vehicle fitness certificates. However, efforts in this regard have failed due to political influence in the issuance of licenses to such workshops and the lack of proper check-and-balance arrangements [46]. A proposal for setting of vehicle inspection and testing service is again now being actively considered by the Government of Punjab. Lately it has advertised for request for proposal for advisory services for establishing modern motor vehicle inspection and certification stations in Punjab on public-private modality [47].
5. Causes of Dismal Environmental
Performance of Buses
5.1 Obsolete vehicle engine technology
Table 2 presents the data about types of engines of buses, meeting different emission standards. The buses inducted under the franchise system were either manufactured locally or imported in the form of complete-built-up-unit (CBU). A few manufacturers have set up their assembly and body-building plants in Pakistan. Amongst the local manufacturers, both M/s Hino Pak and M/s Isuzu have supplied a large number of buses currently under the operation of various transport companies. The engines used for these buses are old models of the 1980s, which were generally used in inter-city buses and trucks. More recently, Hino Pak has introduced Euro-I buses but
even these have proved only marginally better than earlier models in terms of environmental performance. Similarly, the engines of imported CBU buses are of Euro and Euro-I standards, but their operational efficiency has also declined rapidly due to poor backup support of spare parts, and inefficient workshop services.
5.2 Inefficient motor vehicle examination system
Interview with Secretary, Provincial Transport Authority reveals that there are only three Motor Vehicle Examiners (MVEs) in case of Lahore. They are responsible to issue vehicle fitness certificate to motor vehicles. This is in addition to several other functions assigned to them, such as inspection of of body-building workshops, rickshaw manufacturing units, and vehicles involved in accident, issue certificate condemning a government vehicle unfit to ply on road, etc. Each of the three MVEs is assisted by a clerk in documentation and record keeping. But even the single task of issuing vehicle fitness certificate is quite huge for MVEs as they are supposed to examine over 60,000 public service vehicles during a period of six months. The problem is compounded by the lack of requisite equipments (like flu gas analyzer, noise meter etc) to assess the emission levels, engine fitness or vehicle alignment. Consequently, the MVEs could inspect the vehicle only by applying rudimentary procedures and issue the fitness certificates without thorough examination of vehicles. Moreover, interviews with operators revealed that they do not bring their buses to the office of the concerned MVE for inspection due to potential loss of daily operating revenue. Instead, the MVE visits bus yards of operators and confer the vehicle fitness certificate based on simple visual inspection. The rampant corruption and nepotism have rendered the existing vehicle inspection system
Table 2: Types of buses with respect to emission standards [39]
Manufacturer of Bus
No. of Buses (by engine type) Manufacturing Status
Euro-I Euro Standard Free
Hinopak 115 - 520 Locally assembled
Isuzu - - 103 Locally assembled
Daewoo - 70 - Imported
Iveco 52 - - Imported
Improving the Environmental Performance of Bus-based Public Transport System in Lahore-Pakistan
a complete failure, and hence it is no surprise to see smoke emitting vehicles plying on roads while displaying fitness certificates
5.3 Inadequate workshop facilities
In order to enhance the performance and overall life of motor vehicles, it is essential that these are subjected to daily and periodic check-ups for which well-equipped and maintained workshops play a key role. The bus operators who got involved early in this business found no difficulty in setting up workshops due to space provided by the government. Those who joined later were unable to do so as they had to arrange the space on their own which they could not find along the routes allocated to them. As a result, with the exception of a few operators like Premier and Daewoo, a majority do not follow any systematic procedures to check buses regularly. Instead, the general trend is that the buses are given proper attention only when they stop working or go into really bad condition or found consuming more fuel than the norm. The absence of trained mechanics, works managers, Foremen and similar other staff at workshops set-up by operators has added to the seriousness of the problem.
5.4 Lack of training of drivers
If driven carelessly, even a perfectly maintained bus with good quality engine will pollute more unnecessarily since good driving habits have a direct linkage not only to fuel economy but also to vehicle emissions. Therefore, trained drivers applying common sense to driving can significantly contribute to lower emissions from buses. But in Lahore, the drivers operating large buses generally lack formal training. Uneven driving in traffic characterized by abrupt or forceful starts and immediate stops is the typical attitude of most drivers. Some researchers [48] have also noted that the behaviour of drivers operating large buses not only cause traffic accidents but also results in excessive emissions as most of them are not equipped with the skills required for urban bus operation.
A majority of the drivers are incompetent because they have either been withdrawn from intercity operations or wagon service with inadequate training of driving skills needed to ply large buses on
busy roads in city areas. The problem seems to have compounded because there are very few institutions in the public as well as in the private sector particularly for training of public service transport drivers. However, amongst the existing bus operators, Dawoo has managed to build a cadre of good-quality drivers and it keeps updating their skills through a systematic on-going training program. Other operators have also set up training facility, but their drivers are imparted training with the focus more on how to fetch maximum passengers than on educating how to take care of safety aspects or maximize fuel efficiency through wise driving.
5.5 Excessive passenger load
Transport vehicles are designed to carry a specified load, and the engines of vehicles should perform well in terms of fuel efficiency and amount of pollution while carrying the recommended load. Although large buses are meant to cater for passenger load of 70 to 80 persons, it is quite common during the peak period to see more than 120 passengers in buses on certain sections of routes. The increased passenger load has a direct impact on engine performance as well as on fuel efficiency, which ultimately leads to levels of emissions proportionately higher than under specified loading conditions. It has been noted that the problem of peak period passenger load is not due to less than the desired number of buses on a route, but it is largely because of management problems [49].
5.6 Noise pollution
Low levels of noise in the interior of the bus play an important role in making the bus ride comfortable and hence attractive for the passengers. The main noise sources in case of a large bus are the engine, the exhaust system, the hydraulic system, and the tires. How much noise comes inside the bus from these sources will depend on the type of bus, the driving conditions, and the location inside the bus. Since the majority of locally manufactured body buses plying on different routes in Lahore have no insulation and because these are front-mounted engine buses, so passengers experience high level of noise, particularly at the front. However, Dawoo buses have rear-mounted engines with properly insulated body. As such, significantly low level of
Pak. J. Engg. & Appl. Sci. Vol.12, Jan., 2013
120
noise can be observed inside the Dawoo buses, particularly as compared to locally manufactured Hino buses, which have front-mounted engine. Many people do not consider these buses fit for travel on account of high level of internal noise, which sometimes become unbearable due to rattling of window glass.
5.7 Quality of fuel
Use of quality fuel can help reduce the level of emissions from motor vehicles. As pointed out earlier, the fuel being used in buses is supplied direct from the sale points of renowned oil companies operating in the country thus ensuring that the fuel is free from adulteration. As such the quality of fuel is fit for use in locally manufactured buses and meets the specifications laid down for these buses by the manufacturing companies. But, improvement in fuel quality would be needed to maintain engine performance and prevent excessive emissions, if Euro I and Euro II standard buses are to become part of the existing fleet.
5.8 Inadequate enforcement of emission control requirements
It was required on the part of the operators under the franchise agreement that they will take appropriate steps in order to ensure that the franchise buses continue performing well in environmental terms during their period of operation. The District Regional Transport Authority (DRTA), Lahore was responsible to monitor this obligation of the operators to keep buses environmentally fit through efficient repair and maintenance regime. However, the DRTA paid little attention to this aspect and gave higher priority to making efforts aimed at attracting operators to bring buses with the view to make the franchise scheme a success. The perception that because the buses being inducted are brand new, these will need not to be tested on environmental grounds for quite some time further helped the DRTA developing a laidback attitude in this respect.
Similarly, in the absence of appropriate mandatory emission standards for motor vehicles, there has been little incentive for the operators to pay due attention to the fitness of buses. Occasionally, during their month-long drive against smoke-emitting vehicles once a year, the Environment Protection
Department Punjab (EPDP) in collaboration with traffic police has been booking those franchise buses plying on specified routes and found emitting visibly high levels of black smoke. But, as soon as its campaign is over or once the smoke problem is fixed by the operators when caught and asked by the EPDP to do so, one can find the business-as-usual situation prevailing with same buses plying on roads and polluting the air. A study [50] found out that existing system of buses contribute to increasing motor vehicular emissions up to 26% because of frequent stoppages of buses on road as well as due to their exit and re-entrance in flow of traffic.
The pollution caused by buses also caught the attention of the Lahore Clean Air Commission which was set up in 2003 by the honourable Lahore High Court in response to petition filed by some concerned residents of Lahore against growing menace of vehicular air pollution in the city. The Commission was tasked to suggest measures for effective action to bring about a meaningful change in quality of vehicular air pollution. The Commission came up with number of recommendations including phasing out of existing buses, introduction of CNG or EURO II equivalent buses, and establishing inspection and monitoring system [51].
6. Comparative Analysis of Emission
Data of Selected Buses
This section presents the analysis of the emission data of selected buses of two companies viz 12 buses of M/s New Khan Metro and 10 buses of M/s Premier Bus Service. The objective is to have some idea concerning the environmental performance of urban buses operating in Lahore.
As mentioned earlier, the emissions data were collected as part of two undergraduate research theses. That data have been used here firstly, because the authors originally conceived the idea of purposefully collecting the said data by involving undergraduate students with the view to train them in this field; secondly, the two data sets collected separately in 2004 and 2009 have been pulled together here to ascertain environmental performance of selected franchise buses over a period of five years of operation--an objective not achieved in either of the above referred undergraduate research theses; and thirdly, the authors
Improving the Environmental Performance of Bus-based Public Transport System in Lahore-Pakistan
not only arranged the equipment required for testing of emissions and negotiated with the management of selected bus companies to permit emission testing of their respective buses but also coordinated the field visits of undergraduate students and supervised the data collection. All this helped in collection of reliable data.
The two companies mentioned above were selected for the study for being the largest bus operators who inducted buses on specified routes in Lahore at the early stages of franchise initiative and who also established their independent repair and maintenance workshops for the buses. The emission data involved testing of tailpipe emissions (in idling condition) of randomly selected buses. The emissions of same buses were measured first in 2004 and then in 2009 with the view to ascertain their performance over a period of five years of operation. At both the occasions, emissions tests were carried out at the respective depots of bus companies. This helped in obtaining the emissions data of selected buses without significantly disrupting their schedule of operation.
For the purpose of measuring the emission levels of selected buses, IMR 2800A (automotive) emission gas analyzer was used in 2004 whereas
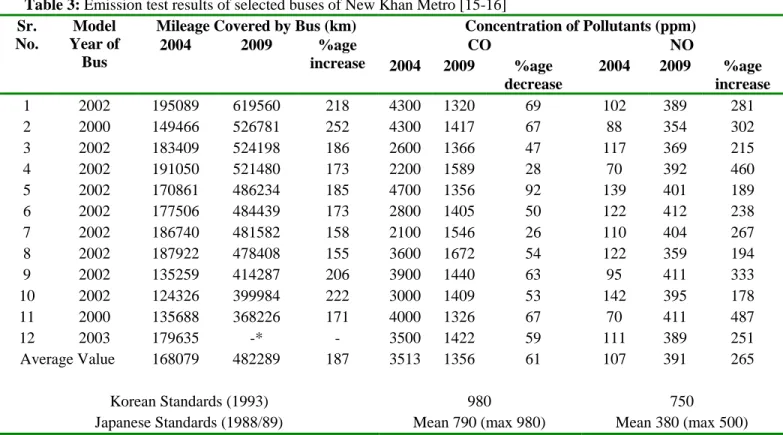
testo 350 flu gas analyzer was used in 2009. The consistency in use of equipment could not be maintained because IMR 2800A was out of order in 2009. But this did not affect the validity of data since the equipments were brand new at the time of their respective use, both were properly calibrated and both were used after obtaining thorough training. Nevertheless, due to this inconsistency in use of equipments, emission level of two pollutants namely carbon monoxide (CO) and nitric oxide (NO) was possible to compare over five-year period of usage of buses. The results so obtained have been examined in the light of relatively older Korean and Japanese emission standards for heavy-duty diesel vehicle engines since these were readily available in units (parts per million) comparable with the observed readings. All the buses selected randomly for comparative analysis of emissions data were standard free and were plying on different routes in the city. The engines in all the sampled buses were of 165 horse-powers. Table 3 shows a summary of
emissions test results of sampled buses of New Khan Metro along with Korean and Japanese standards.
Data concerning nitric oxide is compared with Korean and Japanese standards for heavy-duty diesel vehicle engines with direct injection (DI) design since all the selected buses were also based on DI design. The basic difference between the direct injection and indirect-injection designs is that in the former case, fuel is injected directly into a combustion chamber hollowed out of the top of the piston whereas in the later case, fuel is injected into a separate `pre-chamber’ where it mixes and partly burns before jetting into the main combustion chamber above the piston [52].
It is clear from table 3 that while there is a significant reduction of CO concentrations in case of all the buses over five-year period despite the increase in mileage covered by each bus, there is a corresponding increase in NO emissions in case of all the buses as well. A possible explanation for this is that under ideal combustion, the product gases to be emitted through the tailpipe of the vehicle would consist of CO2, H2O and N2. But, in case of actual combustion, a range of pollutants are going to be produced like CO, SOx, NOx, and HC. Due to wear and tear of materials of walls of the cylinder, the clearance between the surface of wall of the cylinder and the piston may increase. This allows more HC in the fuel to remain un-burnt and escape through the exhaust while simultaneously lowering CO emissions because of low quantity of fuel left for burning in the combustion chamber. On the other hand, the NO emissions may increase side by side since due to passage of time the cooling system may get weaker and overall cylinder operation is not going to be as smooth as in case of new engine. This results in the increase of temperature in the cylinder, which in turn will cause increase of NO emissions case of actual combustion, a range of pollutants are going to be produced like CO, SOx, NOx, and HC. Due to wear and tear of materials of walls of the cylinder, the clearance between the surface of wall of the cylinder and the piston may increase. This allows more HC in the fuel to remain un-burnt and escape through the exhaust while simultaneously lowering CO emissions because of low quantity of fuel left for burning in the combustion chamber. On the other hand, the NO
Pak. J. Engg. & Appl. Sci. Vol.12, Jan., 2013
122
emissions may increase side by side since due to passage of time the cooling system may get weaker
Table 3: Emission test results of selected buses of New Khan Metro [15-16]
* No reading could be recorded because the vehicle’s instrument for indicating distance traveled was out of order and overall cylinder operation is not going to be as
smooth as in case of new engine. This results in the increase of temperature in the cylinder, which in turn will cause increase of NO emissions.
The table 3 also shows that despite showing reduction in the year 2009, the values of CO in case of all the buses are anyway much higher in comparison with Korean and Japanese standards. This is a matter of concern since CO is known for causing toxicity and blood poisoning in humans. It also attacks haemoglobin and reduces the oxygen carrying capacity of blood. As far as the NO emissions are concerned, these are well within permissible limits for both years (2004 and 2009) in comparison with Korean standards for heavy-duty vehicles. However, the 2009 values for NO in case of most of the buses (10 out of 7) are in excess if compared with Japanese standards. This also raises health concerns not only because NO causes respiratory irritation, headache and bronchitis but also because these values show rising trend in emission levels.
If we compare the data presented in table 3 concerning mileage covered by buses up till 2009 with the corresponding percentage increase and/or decrease in concentration of observed pollutants, it becomes clear that no direct relationship emerges between, the more a bus traverses mileage the more it creates pollution. A number of factors could be responsible for this including passenger load on a route, type of route and its length, driver behaviour, traffic conditions forcing frequent stoppages, and quality of bus maintenance service.
Table 4 provides a summary of emissions test results of sampled buses of Premier Bus Service. It can be observed that like the buses of New Khan Metro, the CO values in case of all the buses of Premier Bus Service are also higher than Korean and Japanese standards despite the fact that their concentrations show significant reduction in the year 2009 owing to reasons explained above. However, NO emissions of these buses in 2004 and 2009 are within permissible limits with respect to Korean and Japanese standards.
Sr. No.
Model Year of
Bus
Mileage Covered by Bus (km) Concentration of Pollutants (ppm)
2004 2009 %age
increase
CO NO
2004 2009 %age
decrease
2004 2009 %age
increase
1 2002 195089 619560 218 4300 1320 69 102 389 281 2 2000 149466 526781 252 4300 1417 67 88 354 302 3 2002 183409 524198 186 2600 1366 47 117 369 215 4 2002 191050 521480 173 2200 1589 28 70 392 460 5 2002 170861 486234 185 4700 1356 92 139 401 189 6 2002 177506 484439 173 2800 1405 50 122 412 238 7 2002 186740 481582 158 2100 1546 26 110 404 267 8 2002 187922 478408 155 3600 1672 54 122 359 194 9 2002 135259 414287 206 3900 1440 63 95 411 333 10 2002 124326 399984 222 3000 1409 53 142 395 178 11 2000 135688 368226 171 4000 1326 67 70 411 487
12 2003 179635 -* - 3500 1422 59 111 389 251
Average Value 168079 482289 187 3513 1356 61 107 391 265
Korean Standards (1993) 980 750
Improving the Environmental Performance of Bus-based Public Transport System in Lahore-Pakistan
A comparison of data presented in table 4 about mileage covered by buses of Premier Bus Service up till 2009 with the corresponding percentage increase and/or decrease in CO and NO emissions shows that like New Khan Metro Bus Service, no direct relationship emerges between, the more a bus traverses mileage and the more it creates pollution. The factors like passenger load on a route, type of route and its length, driver behaviour, traffic conditions encountered by bus on prescribed route and quality of bus maintenance service could possibly be responsible for this situation.
Finally, if the emissions of buses of two surveyed companies are compared it can be observed that the average CO values of buses of Premier Bus Service for both the years are better as compared with New Khan Metro. In case of NO emissions, New Khan Metro buses perform better on the whole in the year 2004 whereas the buses of Premier
Bus Service show slightly better result in 2009. It was observed during the survey that Premier Bus Service has relatively improved repair and maintenance regime in place as compared with New Khan Metro.
7. Conclusions
The preceding discussion highlights the environmental performance of the urban buses brought by private operators under the franchise initiative of the Government of Punjab. It has revealed that in general buses are contributing to environmental pollution not only because of inadequate maintenance regime applied by operators but also due to little or no regulatory pressures on operators to keep buses in good condition. Since the buses are getting older, it is becoming vital to control emissions through rigorous maintenance regime for which operators should be exposed to best practices from around the world through training sessions. Also it is becoming imperative to emphasize on appropriate maintenance regime with the view to extend operational life of existing buses in the wake of ever increasing prices of new buses. Moreover, the vehicle inspection and maintenance system should be improved not only through capacity building of MVE involving the provision of equipment and hiring and training of staff but also seriously considering the outsourcing of vehicle fitness certification function. Another aspect that needs to be given appropriate consideration for improving environmental
Table 4: Emission test results of selected buses of Premier Bus Service [15-16]
Sr. No.
Model Year of
Bus
Mileage Covered (km) Concentration of Pollutants (ppm)
2004 2009 %age
increase
CO NO
2004 2009 %age
decrease
2004 2009 %age increase
1 2002 273155 670104 145 3100 1321 57 78 312 300
2 2002 214281 667585 212 2800 1141 59 105 342 226
3 2002 238389 631986 165 3400 1256 63 100 355 255
4 2002 218834 622303 184 4200 1265 70 160 388 143
5 2002 240258 615368 156 2900 1255 57 198 350 77
6 2002 236793 580561 145 3600 1141 68 50 342 584
7 2002 238822 567394 138 3000 1356 55 142 345 143
8 2002 238855 564168 136 3400 1436 58 196 320 63
9 2002 227656 561974 147 3500 1356 61 100 354 254
10 2004 85330 488162 472 4000 1465 63 194 351 81
Average Value 221237 596961 170 3390 1299 62 132 346 162
Korean Standards (1993) 980 750
Pak. J. Engg. & Appl. Sci. Vol.12, Jan., 2013
124
performance of existing buses include formal arrangements on the part of government for training of drivers to ensure smooth bus operation.
Given the rapid increase in population and inability of government to invest in costly alternatives like light rail transit system, buses are going to continue to serve as an important mode of urban public transport in Lahore in the foreseeable future. Moreover, the Government of Punjab is taking keen interest to improve urban public transport in major cities of the Province. As noted above the recent move of the Government to enter into agreement with Chinese investors to induct the new CNG buses in Lahore is a clear reflection of this interest. In this context, a well thought out policy is needed to ensure balance in induction of new buses using advanced engine technologies and type of fuel use in buses. The strategy of mixed fuel use in particular can help minimizing pollution from urban public transport. But, this would require a strenuous effort to attain balance in supply and demand of alternative fuels in a country rampant with cartel culture and because of inconsistent policies. Finally, the suggestion given by some researchers [50] concerning introduction of the bus rapid transit system with segregated bus ways on major roads of Lahore is also worth considering that would help reducing emissions from urban buses. Here it is pertinent to mention that the present Government of the Punjab has already started work on Bus Rapid Transit System (BRTS) project. The first BRTS line along 27 km long corridor stretching from Gajummata to Shahdara is likely to be inaugurated for service on December 25, 2012 [53]. Once completed, how the BRTS will be managed, to what extent it will help solve traffic congestion and have positive impact on localized air pollution levels is yet to be seen.
6
Acknowledgement
The funds for faculty research project entitled “An Evaluation of the Franchise Urban Transport Scheme in Punjab” were approved by the Advanced Studies and Research Board of the University of Engineering and Technology, Lahore during the financial year 2003-2004.
7
References
[1] UNEP; Cleaning up Urban Bus Fleets: With a Focus on Developing and Transition Countries, (2009).
[2] L. Wright; Proc. Int. Conf for Renewable Energies, Bonn, Germany, (2004).
[3] M. Linster, Background Facts and Figures, In: ECMT, Transport Policy and the Environment, ECMT Ministerial Session, (1990).
[4] OECD/IEA; Bus Systems for the Future: Achieving Sustainable Transport Worldwide,
International Energy Agency, Paris, (2002). [5] USAID/PA Government Services, Inc, Vehicle
Inspection and Maintenance Programs: International Experience and Best Practices.
Washington D.C.: Office of Energy and Information Technology, USAID, (2004). [6] D. Bayliss, Urban Traffic Management, In:
ECMT, Transport Policy and the Environment, ECMT Ministerial Session, (1990).
[7] D. A. Hensher; Transport Policy, 14(2007) 98-102.
[8] UNEP; Transported to the Future. URL: http://www.unep.org/OurPlanet/imgversn/121/ tanig.html, accessed May 5th 2012
[9] URBS – Urbanization Company of Curitiba.
URBS Official Website (in Portuguese). Available at www.urbs.curitiba.pr.gov.br. Accessed 10 May 2010 quoted in Lindau, L.A. Lindau, D. Hidalgo, and D. Facchini, Curitiba, the cradle of Bus Rapid Transit, URL: http://www.sibrtonline.org/downloads/built-
environment-curitiba-oct19-4db0b5ac230da.pdf, accessed 5th May 2012. [10] L. Wright; Bus Rapid Transit, Sustainable
Transport: A Source for Policy-Makers in Developing Cities. Eschborn: DeutscheGesellschaft fur Technische Zzusammenarbeit (GTZ) GmbH, (2003). [11] A. Cain et al; Applicability of Bogota’s
TransMilenio BRT System to the United States,
National Bus Rapid Transit Institute, Center for Urban Transportation Research, University of South Florida, (2006).
Improving the Environmental Performance of Bus-based Public Transport System in Lahore-Pakistan
[12] L. Wright and K. Fjellstrom; Mass Transit Options, Sustainable Transport: A Source for Policy-Makers in Developing Cities. Eschborn: DeutscheGesellschaft fur Technische Zzusammenarbeit (GTZ) GmbH, (2005). [13] ESMAP, Urban Air Pollution: How can
Urban Bus Policy Reduce Air Pollution? South Asia Urban Air Quality Management Briefing Note No. 3, World Bank, (2001).
[14] G. A. Anjum and R. Hameed; Pakistan Journal of Engineering and Applied Sciences, 1(2007) 73-83.
[15] H. Naseer and A. S. Khan; A Study on Environmental Performance of Selected Franchised Buses in Lahore, B Sc Thesis, University of Engineering and Technology, Lahore, (2004).
[16] M. Zakir, M. Nafees and A. Imtiaz;
Environmental Nuisance Caused by Buses of Private Operators in Lahore, B Sc Thesis, University of Engineering and Technology, Lahore, (2009).
[17] M.P. Walsh and R. Kolke, Cleaner Fuels and Vehicle Technologies, Sustainable Transport: A Source for Policy-Makers in Developing Cities. Eschborn: DeutscheGesellschaft fur Technische Zzusammenarbeit (GTZ) GmbH, (2005).
[18] R.O. McClellan, T.W. Hesterberg and J.C. Wall, Regulatory Toxicology and Pharmacology, 63 (2012) 225-258.
[19] T.W. Hesterberg, C.A. Lapin and W.B. Bunn,
Environmental Science and Technology, 42 (2008) 6437-6445.
[20] K. Chandler, K. Walkowicz and L. Eudy, New York City Transit Diesel Hybrid-Electric Buses: Final Results, Virginia: US Department of Commerce, (2002).
[21] M.G.L. Santarelli, M. Cali and A. Bertonasco,
Energy Conversion and Management, 44 (2003) 2353-2370.
[22] A. Jolley, Transport Technologies, Climate Change Working Paper No. 5, Melbourne: Centre for Strategic Economic Studies, Victoria University, (2006).
[23] R. Kolke, Inspection and Maintenance and Roadworthiness, Sustainable Transport: A Sourcebook for Policy-Makers in Developing Cities. Eschborn: DeutscheGesellschaft fur Technische Zzusammenarbeit (GTZ) GmbH, (2011).
[24] http://www.ecodrive.org/en/what_is_
ecodriving-/benefits_of_ecodriving/, accessed 6th August 2012.
[25] ESMAP; Best Operational and Maintenance Practices for City Bus Fleets to Maximize Fuel Economy, Briefing Note 010/11,Washington D.C., IBRD/The World Bank, (2011).
[26] M. Breithaupt and O. Eberz, EcoDriving, Sustainable Transport: A Source for Policy-Makers in Developing Cities. Eschborn: DeutscheGesellschaft fur Technische Zzusammenarbeit (GTZ) GmbH, (2005). [27] A. Stanislaus, A. Marafi and M.S. Rana,
Catalysis Today, 153 (2010) 1-68.
[28] T. Lanni, S. Chatterjee, R. Conway, H. Windawi, D. Rosenblatt, C. Bush, D. Lowell, J. Evans and R. McLean, Performance and Durability Evaluation of Continuously Regenerating Particulate Filters on Diesel Powered Urban Buses at NY City Transit, Society of Automotive Engineers, Inc., (2001). [29] U. Narain and A. Krupnick, The Impact of Delhi’s CNG Program on Air Quality, Discussion paper, Wshington D.C.: Resources for the future, (2007).
[30] D.C. Rakopoulos, C.D. Rakopoulos, E.G. Giakoumis and A.M. Dimaratos, Energy, 43 (2012) 214-224.
[31] C.D. Rakopoulos, D.C. Rakopoulos, D.T. Hountalas, E.G. Giakomis and E.C. Andritsakis, Fuel, 87 (2008) 147-157.
[32] GoPb/BOS, Punjab Development Statistics 2011, Government of the Punjab, Bureau of Statistics, Lahore.
[33] JICA/TEPA; Comprehensive Study on Transportation System in Lahore, Final Report, Traffic Engineering and Planning Agency, Lahore, (1991).
Pak. J. Engg. & Appl. Sci. Vol.12, Jan., 2013
126
[34] GoPb/JICA; The Project for Lahore Transport Master Plan (LUTMP) in the Islamic Republic of Pakistan (Phase II), Draft Final Report, Vol I, November 2011, Government of the Punjab, Transport Department, Lahore.
[35] I. Muhammad. Institutional Barriers to Sustainable Urban Transport in Pakistan, Karachi, Oxford University Press, (2010). [36] I. Muhammad. Journal of Public
Transportation, 12 (2009) 53-83.
[37] J. R. E. Russell and G. A. Anjum; Transport Reviews, 17 (1997) 61-80.
[38] G. A. Anjum; Proc. Int. Conf on Road Transport, PCSIR, Lahore, (2001).
[39] http://www.ltc.gop.pk/mission.php, accessed 24th June 2011.
[40] Data collected by the authors.
[41] The News; Punjab Signs Pact with Chinese Firm for 575 Buses, Tuesday, 29th November 2011.
[42] Feasibility Study on Lahore Rapid Mass Transit System, MVA Consultants, (2007). [43] GOP; The [Balochistan, NWFP, Punjab,
Sindh] Motor Vehicle Ordinance 1965,
Government of Pakistan, Islamabad, (1965). [44] GOP; National Environmental Quality
Standards for Motor Vehicle Exhaust and Noise, Government of Pakistan, Islamabad, (1993).
[45] GOP; National Environmental Quality Standards for Motor Vehicle Exhaust and Noise, Government of Pakistan, Islamabad, (2009).
[46] ENERCON; Strengthening the Institution of Motor Vehicle Examiners (MVE) in Pakistan,
Islamabad, (2002).
[47] http://ipdf.gov.pk/tmpnew/PDF/RFP%20 for%20Hiring%20TA%20for%20VICS%20in %20Punjab.pdf, accessed 24th June 2011. [48] R. Aziz and S. Saeed; A Study of Bus Drivers’
Behavior Causing Road Accidents in Lahore,
B Sc. Thesis, University of Engineering and Technology, Lahore, (2005).
[49] U. L. Naqvi and Q. Islam; A Study of Passenger Load Management on Franchise Routes in Lahore, B Sc. Thesis, University of Engineering and Technology, Lahore, (2004). [50] A. Aziz and I. U. Bajwa; Environmental
Monitoring and Assessment, 137 (2008) 25-33.
[51] S. M. Ali; Paper presented at the National Workshop on Urban Air Quality and Integrated Traffic Management, Karachi,
(2006). URL:
http://cleanairinitiative.org/portal/node/2823, accessed 26th November 2012.
[52] A. Faiz, C. S. Weaver and M. P. Walsh; Air Pollution from Motor Vehicles: Standards and Technologies for Controlling Emissions,
Washington D.C., IBRD/The World Bank, (1996).
[53] http://www.thenews.com.pk/Todays-News-5- 144295-BRTS-to-be-functional-on-Quaids-birth-anniversary, accessed 27th November, 2012.
![Table 1: Age-wise details of buses operating in Lahore under franchise initiative by 2008 [40]](https://thumb-us.123doks.com/thumbv2/123dok_us/8386158.2228183/8.918.82.832.163.497/table-age-details-buses-operating-lahore-franchise-initiative.webp)
![Table 4: Emission test results of selected buses of Premier Bus Service [15-16]](https://thumb-us.123doks.com/thumbv2/123dok_us/8386158.2228183/14.918.73.825.675.1053/table-emission-test-results-selected-buses-premier-service.webp)
