ISSN: 2252-8938 81
The Optimal Thresholding Technique for Image Segmentaion
Using Fuzzy Otsu Method
P. Rambabu1, C. Naga Raju2 1Department of Computer Science & Engineering, JNTUK, Kakinada, India. 2
Department of Computer Science & Engineering, YSR Engineering college of Y VU, Proddatur
Article Info ABSTRACT
Article history: Received May 22, 2015 Revised July 12, 2015 Accepted August 1, 2015
Image Segmentation plays a very important role in image processing. The single-mindedness of image segmentation is to partition the image into a set of disconnected regions with the homogeneous and uniform attributes like intensity, tone, color and texture. There are various methods for image segmentation but no method is suitable for low contrast images. In this paper, we are presenting an efficient and optimal thresholding image segmentation technique that can be used to separate the object and background pixels of the image to improve the quality of low contrast images. This innovative method consists of two steps. Firstly fuzzy logics are used to find optimum mean value using S-curve with automatic selection of controlled parameters to avoid the fuzziness in the image. Secondly, the fuzzy logic’s optimal threshold value used in Otsu method to improve the contrast of the image. This method, gives better results than traditional Otsu and Fuzzy logic techniques. The graphs and tables of values show that the proposed method is superior to traditional methods.
Keyword: BCV Fuzzy Logic Otsu
Segmentation
Copyright © 2015 Institute of Advanced Engineering and Science. All rights reserved. Corresponding Author:
P. Rambabu,
Department of Computer Science & Engineering, Jawaharlal Nehru Technological University Kakinada, Kakinada, Andhra Pradesh, India.
Email: [email protected]
1. INTRODUCTION
Image segmentation plays an important role in image processing and computer vision applications. It is often used to partition an image into separate regions, which ideally correspond to different real world objects. It is a major step towards content analysis and image understanding. Otsu method [1] is a very popular global automatic thresholoding technique, which can be applied to a wide range of applications. This method is selected by maximizing the discriminant measure η. Otsu method is nonparametric and unsupervised nature of threshold selection. In order to increases the effectiveness of calculation for the optimal thresholds of an image, Ping-Sung, et al [2], suggested a faster version of Otsu’s method. In this method, first, a condition is defined that maximizing the modified between-class variance (BCV) that is same as to the condition of maximizing the usual BCV is proposed for image segmentation. Based on this condition, in order to find the optimal threshold value a recursive algorithm is designed. Based on improved thresholding algorithm, Ch. Hima Bindu [3], proposed a new optimized Otsu method. This method reduces the operating time and increases the reparability factor in medical image segmentation. D Liu, et al [4] proves that in multilevel thresholding based on minimizing the within-class variance, the objective function of both Otsu method and K-means method is same. In order to do multilevel thresholding, a two-stage Otsu optimization approach was proposed by D Hunang et al [5]. This method is called as modified two-stage multi threshold Otsu (TSMO). This procedure gives the same results as obtained by using traditional Otsu
method. The main advantage of this method is decreases the required computation time for large number of clusters.
X Yang et al, [6], presented a new technique that improves the performance of the Otsu algorithm. HJ Vala et al [7], provides the information about the different Otsu algorithms and compare the performances of these methods. VP Patel et al [8] implemented the Otsu method in different approaches like iteration approach and custom approach. They implemented these techniques in MATLAB and compare the results and shows that both has given almost the same threshold value for segmenting the image but custom approach requires less computations. Firstly, the idea of entropy for thresholding was used by Pun [10], this was extended by Kapur et al [9], in entropy based algorithms. This method concludes that when the summation of the background and object entries reaches its maximum, the threshold value is obtained. By using the pixels gray value and local average of neighborhood gray values of the pixels, a 2D histogram was determined and by using this Abutaleb extended Kapur’s method using 2 D entropies [11]. As an enhancement, this technique is simplified by AD Brink [12].
In 1965, Zadeh proposed fuzzy logic in his research Fuzzy Sets [13].He well-defined the fuzzy sets and fuzzy logic in additional to the membership function which assign each grade to a value between 1 and 0 and introduces theoretical background. In segmentation process, Fuzzy based techniques were used by numerous authors. To select the threshold value, c-partition entropy fuzzy was used by Cheng et al [14]. To achieve this, maximum entropy principle and fuzzy c-partition was used. They have assumed a fixed and known number of the clusters and classified the pixels into these clusters. The ultra-fuzzy (fuzzy II) algorithms used to find the threshold value suggested by Tizhoosh [15]. C. Naga Raju et al [16], they derive fuzzy rules for π – function. By using effective selection of Region of Interest (ROI), this procedure is to optimize the image threshold. To estimate the fuzziness of an image and to determine an adequate threshold value, by utilizing the measure of fuzziness, Ambar Dutta, et al [17], proposed a two-stage fuzzy set theoretic approach to image thresholding. To avoid the fuzziness in the image and makes good regions in the image, a new segmentation technique by using the fuzzy logic which produce optimal threshold value was proposed by C Naga Raju et al [18]. C Naga Raju et al [19], proposed a new technique to address the multi-dimensional optimized problem with optimal thresholding using fuzzy entropy for image enhancement.
2. PROPOSED METHOD
2.1. Otsu Method
Otsu method [1] is a very popular global automatic thresholoding technique. For the given image, the pixels can be denoted in gray levels, -. At each gray level, the number of pixels denoted by and the total pixels of image by . The gray level histogram is normalized by probability distribution function:
∑ (1)
We assigned as the threshold value, to classify the background and object of the image, the normalized fraction of pixels will be used.
( ) ∑ ( ) (2)
( ) ∑ ( )
(3)
( ) ( ) (4)
The background mean and object mean of gray level value of pixels will be: ( ) ∑ ( )
( ) ( )∑ ( ) (5)
( ) ∑ ( )
( ) ( )∑ ( )
(6)
∑ ( )
∑ ( ) ∑ ( )
(7)
The background variance and object variance of gray level value of pixels will be: ( ) ∑ ( ) ( )
∑ ( ) ( )∑ ( ) ( ) (8)
( ) ∑ ( ) ( )
∑ ( ) ( )∑ ( ) ( )
(9)
Then, the whole gray level image, whose variance is calculated as:
∑ ( ) ( ) (10)
Within-class and between-class variance The variance can be defined as:
( ) ( ) ( ) ( ) ( )( ( ) ) ( )( ( ) )
( ) ( ) (11)
Where ( ) is the within – class variance and ( ) is the between-class variance. 2.1.1. Determining the threshold
Since the total variance does not depend on , the minimizing will be the maximizing . Let’s consider maximizing , we can rewrite as:
, ( ) (
)-( ) ( ) (12)
Where, ( ) ∑ ( ).
In order to maximizes , starts from the commencement of the histogram and check each gray level image value for the likelihood of being the threshold .Otsu method proved that optimal threshold is the value that maximize the between-class variance as:
* ( )+ (13)
2.1.2. Limitations of the Otsu method
We could not find a good union of thresholds to the global optimum for the gray level images by using the traditional Otsu algorithm. The Otsu algorithm is suitable only when there are two classes in the image. If there exists more than two classes in the image, the method must be customized in order to decide the multi thresholds. It allows the largest among-class variance and the least in-class variance. The image is divides into two groups by using Otsu algorithm, yet no actual sense is made by division because of no suitable mean value calculation with equation (15). In variable illumination conditions, this method could not be applied straight. To avoid this, Fuzzy S-curve membership function is used to calculate the optimum mean value.
2.2. Fuzzy Based Methodology
Abutaleb [11] and AD Brink [12] did some good work in obtaining the segmentation of a gray image incorporating the spatial correlation among the pixels of the image by constructing the 2D histogram. Fundamentally these methods attract maximum entropy criterion function to establish the optimal threshold for any given image.
Measures of fuzziness in contrast to fuzzy measures indicate the degree of fuzziness of fuzzy set. The membership degree of any value in the universe of discourse can be estimated by using any membership function. The membership degree can be expressed by a mathematical function ( ) that allocates, to each element in the set, a membership degree between 0 to 1. Let be the universe of discourse and is an element of . Fuzzy set in is defined as {( ( )) }
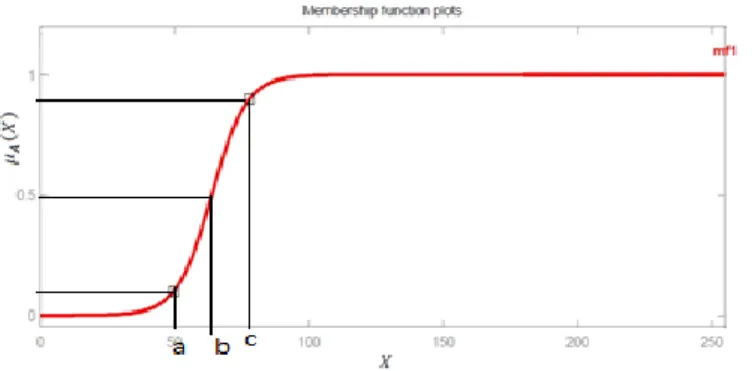
Figure 1. Typical Shape of S– Membership Function
S-membership function is used for modeling the membership degrees. This function is suitable to represent the set of bright pixels if image is considered as one dimensional signal and is defined as:
( ) ( )
( ) ∫ ∫ . / ∫ ( . / ) ∫ (14)
Where ( ) initial seed sets, and controls S-function. 2.3. Automatic Selection of parameters
The S – function show in the Figure 1 can be controlled through and parameters. Parameter is called the cross over point. Where the higher the gray level of a pixel, higher the membership value and vice versa. However the selection of parameters is difficult to automate the technique. Here the mean ( ) and standard deviation ( ) are calculated from equations (15) and (16), fuzzy seed set values , and are estimated automatically as:
∑ ( ) (15)
√ ∑ ( ) (16)
From equations (15) and (16) fuzzy seed set values , and are estimated automatically as:
(17)
(18)
(19)
by substituting these parameters in s-curve we can achieve better selection of parameters for low contrasted images.
3. QUALITY PARAMETERS
3.1. Mean
Mean is defined as the average gray levels of the image. In gray level image the mean is calculated as:
( )
∑ ∑ ( )
(20)
Where ( ) is the gray level image, and are number of rows and number of columns of resulting image.
3.2. Standard Deviation
The standard deviation of gray level image is calculated as:
( ) √
∑ ∑ ( ( ) )
(21)
Where ( ) is the gray level the image, and are the number of rows and number of columns of the resulting image and is the mean of the image.
4. RESULTS AND ANALYSIS
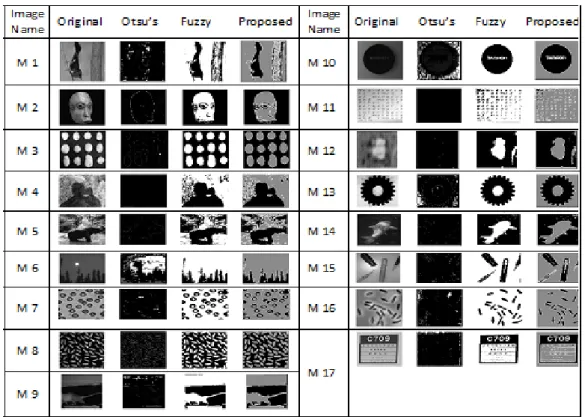
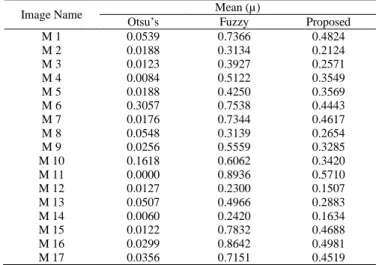
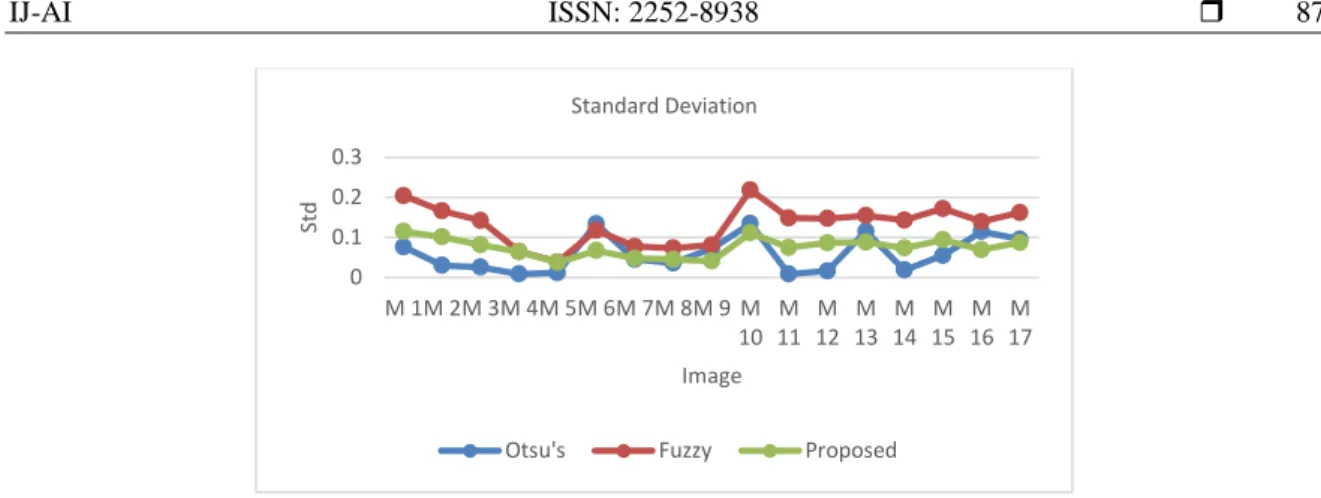
To elucidate the performance of the proposed methodology, we consider 17 images as an image set, it contains similar and dissimilar gray level histogram characteristics, changing from uni model to multi model histograms. For each sample image its histogram and a ground truth image, which is produced manually has been used as gold standard are shown in Figure 2, to compare results and their performance. We undertake this process with two measures similarity and diversity between the output image and its corresponding ground truth image. From the experiments for each test image we obtain mean (μ) computed from equation (20) is compared with gold standard images by all three different methods including Otsu, Fuzzy and Proposed is shown in Table 1. Figure 3 shows the comparison of means (μ) of three different methods containing Otsu, Fuzzy and Proposed. The proposed method gives the optimum threshold value compared to the other two methods. From the experiments for each test image we obtain standard deviation (σ) computed from equation (21) is compared with gold standard images by all three different methods including Otsu, Fuzzy and Proposed is shown in Table 2. Figure 4 shows the comparison of standard deviation (σ) of three different methods including Otsu, Fuzzy and Proposed. The proposed method gives the optimum threshold value compared to the other two methods. The proposed method confirms the qualitative enhancement over the existing methods. Figure 2 shows threshold results obtained by various methods.
Figure 2. From Left to Right Original Images and Corresponding Results for the Three Algorithms Otsu, Fuzzy and Proposed Algorithms
Table 1. Comparision of Mean (µ) for Different Methods
Image Name Otsu’s Mean (µ)
Fuzzy Proposed
M 1 0.0539 0.7366 0.4824
M 2 0.0188 0.3134 0.2124
M 3 0.0123 0.3927 0.2571
M 4 0.0084 0.5122 0.3549
M 5 0.0188 0.4250 0.3569
M 6 0.3057 0.7538 0.4443
M 7 0.0176 0.7344 0.4617
M 8 0.0548 0.3139 0.2654
M 9 0.0256 0.5559 0.3285
M 10 0.1618 0.6062 0.3420
M 11 0.0000 0.8936 0.5710
M 12 0.0127 0.2300 0.1507
M 13 0.0507 0.4966 0.2883
M 14 0.0060 0.2420 0.1634
M 15 0.0122 0.7832 0.4688
M 16 0.0299 0.8642 0.4981
M 17 0.0356 0.7151 0.4519
Table 2. Comparision of Standard Deviation ( ) for Different Methods
Image Name Otsu’s Standard Deviation ( )
Fuzzy Proposed
M 1 0.0767 0.2046 0.1148
M 2 0.0303 0.1662 0.1014
M 3 0.0257 0.1422 0.0815
M 4 0.0086 0.0648 0.0646
M 5 0.0117 0.0386 0.0374
M 6 0.1344 0.1179 0.0673
M 7 0.0450 0.0775 0.0477
M 8 0.0361 0.0734 0.0449
M 9 0.0722 0.0810 0.0409
M 10 0.1348 0.2190 0.1112
M 11 0.0086 0.1486 0.0746
M 12 0.0162 0.1473 0.0863
M 13 0.1153 0.1543 0.0881
M 14 0.0186 0.1430 0.0733
M 15 0.0550 0.1718 0.0940
M 16 0.1148 0.1396 0.0696
M 17 0.0953 0.1619 0.0875
Figure 4. Comparison of Standard Deviation for the Otsu, Fuzzy and Proposed Method
5. CONCLUSION
In this paper by using three thresholding techniques of Otsu, Fuzzy and Proposed method, determined the optimal threshold values and they are tested with natural images as well as a variety of representing low contrasted images for image enhancement. The proposed method threshold value compared with existing Otsu and fuzzy thresholding techniques for image enhancement. It is proved that proposed method is best fit for even low contrasted images. By using mean and standard deviation, the tables and graphs are constructed. Even though the proposed method produces better results, it fails to show the important feature like moon in image M6 in Figure 2. The values of a and c of S-curve are defined automatically. We are not added any noise to the original image data set.In future work, we can overcome those problems by extending to speckle noise and poison noise removal and find all the important features of image.
REFERENCES
[1] N Otsu. A Threshold Selection Method from Gray-Level Histogram. IEEE Transactions on Systems, MAN, and Cybernetics, 1979; SMC-9(1): 62-66.
[2] Ping-Sung Liao, Tse-Sheng Chen, Pau-Choo Chung. A Fast Algorithm for Multilevel Thresholding. Journal of Information Science and Engineering. 2001; 17: 713-727.
[3] Ch Hima Bindu. An Improved Medical Image Segmentation Algorithm Using Otsu Method. International Journal of Recent Trends in Engineering. 2009; 2(3).
[4] Dongju Liu, Jian Yu. Otsu method and K-means. Ninth International Conference on Hybrid Intelligent Systems 2009: 344-349.
[5] Deng-Yuan Huang, Ta-Wei Lin. Automatic Multilevel Thresholding Base on Two-Stage Otsu’s Method with Cluster Determination by Valley Estimation. International Journal of Innovative Computing, Information and Control. 2011; 7(10): 5631-5644.
[6] Xiaolu Yang, Xuanjing Shen, Jianwu Long, Haipeng Chen. An Improved median-based Otsu image thresholding Algorithm. SciVerse ScienceDirect, AASRI Procedia. 2012; 3: 468-473.
[7] Hetal J Vala, Astha Baxi. A Review on Otsu Image Segmentation Algorithm. IJARCET. 2013; 2(2).
[8] S Kalathiya, VP Patel. Implementation of Otsu Method with Two Different Approaches. International Journal of Software & Hardware Research in Engineering. 2014; 2(2).
[9] JN Kapur, PK Sahoo, AKC Wong. A new method for graylevel picture thresholding using the entropy of the histogram. Graph Models Image Process. 1985; 29(3): 273-285.
[10] T Pun. A new method for gray-level picture thresholding using the entropy of the histogram. Signal Process. 1980; 2(3): 223-237.
[11] AS Abutaleb. Automatic Thresholding of gray-level pictures using two-dimensional entropy. Computer vision, Graphics and Image Processing. 1980; (47): 22-32.
[12] AD Brink. Thresholding of digital images using two dimensional entropies. Pattern recognition, 1989; 25(8): 22-32. [13] LA Zadeh, Fuzzy Sets. Information and Control. 1965; (8): 338-353.
[14] HD Cheng, Chen, JLi. Threshold selection based on fuzzy c-partition entropy approach. Pattern recognition. 1998; 31(7): 857-887.
[15] HR Tizhoosh. Image thresholding using type II fuzzy sets. Pattern recognition, 2005; (38): 2363-2372.
[16] M Seetharama Prasad, T Divakar, B Srinivasa Rao, C Naga Raju. Unsupervised Image Thresholding using Fuzzy Measures. International Journal of Computer Applications. 2011; 27(2): 32-41.
[17] Ambar Dutta, Avijit Kar, BN Chatterji. Fuzzy Set Theoretic Approach to Image Thresholding. International Journal of Computer Science, Engineering and Applications. 2011; 1(6): 63-71.
0 0.1 0.2 0.3
M 1M 2M 3M 4M 5M 6M 7M 8M 9 M 10 M 11 M 12 M 13 M 14 M 15 M 16 M 17 St d Image Standard Deviation
[18] PGK Sirisha, R Pradeep Kumar Reddy, C Naga Raju. An Efficient Fuzzy Technique for Detection of Brain Tumor. International Journal of Computers & Technology. 2013: 8(2): 813-818.
[19] U Sesadri, B Siva Sankar, C Naga Raju. Fuzzy Entropy Based Optimal Thresholding Technique for Image Enhancement. International Journal on Soft Computing, 2015; 6(2).
BIOGRAPHIES OF AUTHORS
RAMBABU PEMULA, received his B.Tech Degree in Computer Science and Engineering from J.N.T.University Hyderabad and M.Tech Degree in Software Engineering from J.N.T.University Hyderabad. Presently pursuing Ph.D in the area of Digital Image Processing in the Department of Computer Science and Engineering from J.N.T.University Kakinada. He is currently working as Assistant Professor and Head of the Department in Computer Science and Engineering, Nimra Institute of Engineering and Technology, Ongole, Andhra Pradesh. He got 8 years of teaching experience. He is member of various professional societies like IEEE, ACM and ISTE.
Dr. C. Naga Raju is currently working as Associate professor and Head of the Department of Computer Science and Engineering at YSR Engineering College of Yogi Vemana University, Proddatur, YSR Kadapa District, Andhra Pradesh, India. He received his B.Tech Degree in Computer Science and Engineering from J.N.T.University, Anantapur, and M.Tech Degree in Computer Science from J.N.T.University Hyderabad and Ph.D in Digital Image Processing from J.N.T.University Hyderabad. He has got 18 years of teaching experience. He received research excellence award, teaching excellence award and Rayalaseema Vidhyaratna award for his credit. He wrote text book on C & Data Structures and Pattern Recognition. He has six Ph.D scholars. He has published fifty six research papers in various National and International Journals and about thirty research papers in various National and International Conferences. He has attended twenty seminars and workshops. He delivered 10 keynote addresses. He is member of various professional societies like IEEE, ISTE and CSI.