Sharif University of Technology
Scientia IranicaTransactions A: Civil Engineering www.scientiairanica.com
A new accelerated rey algorithm for size
optimization of truss structures
A. Baghlani
, M.H. Makiabadi and H. Rahnema
Faculty of Civil and Environmental Engineering, Shiraz University of Technology, Shiraz, Iran. Received 7 July 2012; received in revised form 18 April 2013; accepted 28 May 2013
KEYWORDS Firey algorithm; Truss structures; Size optimization; Metaheuristics.
Abstract. An Accelerated Firey Algorithm (AFA) for fast size optimization of truss structures is proposed in this paper. Metaheuristic rey algorithm has been recently developed and its eectiveness in solving practical problems such as sizing optimization of truss structures has not been thoroughly explored. The numerical experiments show that although the standard Firey Algorithm (FA) is a powerful approach for truss optimization, it suers from slow rate of convergence, and hence it should be modied to solve real-life problems. The proposed AFA imposes some improvements on the searching procedure by both reduction of randomness and scaling the random term in reies' motion. The eectiveness and robustness of the algorithm are investigated by solving some benchmark problems. The results revealed that the proposed AFA remarkably enhances the rate of convergence and stability of standard rey algorithm.
c
2013 Sharif University of Technology. All rights reserved.
1. Introduction
Trusses are among the most widely-used structures in civil engineering projects. The overall cost of a truss can be reduced by optimizing size, topology and conguration of the truss. Hence, optimization of truss structures has usually been an interesting subject for many researchers. For many years, the most popular and sophisticated optimization method, in engineering applications in general, and in truss optimization in particular, has been Genetic Algorithm (GA) [1-7]. Re-cently, other nature-inspired metaheuristic algorithms such as Ant Colony Optimization (ACO) [8-10] and Particle Swarm Optimization (PSO) [11-15] are gradu-ally taking the place of traditional GA because of their robustness and simplicity at the same time. Other well-*. Corresponding author. Tel.: 0098 9177101923;
Fax: 0098 7117264102
E-mail addresses: [email protected] (A. Baghlani), [email protected] (M.H. Makiabadi),
[email protected] (H. Rahnema)
known population-based optimization methods include Harmony Search (HS) [16-18], Simulated Annealing (SA) [19-20], and Charged System Search algorithm (CSS) [21].
All aforementioned evolutionary optimization methods start the search with initial solution candi-dates. These candidates are technically called chro-mosomes (in GA), particles (in PSO) and so on; depending on the algorithm being used. The collection of candidates is called population (in GA), swarm (in PSO) and so on. Then, the algorithm tries to modify the solution via an iterative procedure to enhance the tness of the objective function. Unfortunately, most iterative optimization algorithms undergo slow rate of convergence even in simple practical problems with a few design variables. For real-life problems such as planar or spatial trusses with many members, the searching space is very extensive. Therefore, the com-putational eort of nding the optimal solution is high and hence, the optimization algorithm may fail to nd the solution even after a large number of iterations. For this reason, many researchers are tried to enhance the
iterative optimization methods to make them suitable to solve practical problems [12,13,17,18,22].
Firey Algorithm (FA) is one of the most re-cently developed nature-inspired metaheuristic algo-rithms. The algorithm was rst developed by Yang (2008) [22] inspired by the light attenuation over the distance and reies' mutual attraction. Despite of having very attractive strategy, very few articles can be found in the literature concerning the application of rey algorithm in structural optimization prob-lems. Gandomi et al. [23] used rey algorithm to solve mixed continuous and discrete structural opti-mization problems. Gomes employed FA for shape and size optimization of structures including dynamic constraints [24]. Kazemzadeh Azad and Kazemzadeh Azad tried to improve the eciency of rey algorithm for optimization of trusses [25]. Gandomi et al. [26] introduced chaos in rey algorithm to increase its global search mobility.
Similar to other iterative optimization techniques, rey algorithm undergoes slow convergence rate. In this paper, an Accelerated Firey Algorithm (AFA) is proposed in order to successfully overcome this intrinsic drawback of the algorithm and to turn it into a pow-erful tool for optimization of truss structures involving constraints. The new algorithm modies the movement of reies by reduction of randomness as well as a simple scaling technique which are found to be very eective in reducing the number of iterations required to nd the optimal solution. The eectiveness and robustness of the method are investigated by solving some benchmark problems. In order to separately investigate the eect of each modication on the search capability of the algorithm, all problems are solved using standard Firey Algorithm (FA), standard rey algorithm with reduction of randomness (FA-R), and the proposed Accelerated Firey Algorithm (AFA). Standard tests including statistical studies are carried out for each problem to thoroughly investigate the eectiveness and stability of the proposed approach. The rest of the paper is organized as follows.
In Section 2 the problem of size optimization of truss structures is dened. In Section 3 an overview on standard rey algorithm is presented. Section 4 describes the modications needed to improve FA and presents the Accelerated Firey Algorithm (AFA). Section 5 deals with penalty function formulation which will be used in all rey algorithms for constrain handling. In Section 6 some design examples are presented and eectiveness of the proposed technique is investigated. Finally, in Section 7 summary and conclusion are included.
2. Problem formulation
Weight optimization of pin connected structures with
axially loaded members involves optimizing cross sec-tions Ai of the members such that the weight of the
structure W is minimized and some constraints with respect to design criteria are satised as follows: Minimize:
W (A) =Xng
k=1Ak
Xmk
i=1iLi: (1)
Subject to:
low i up; i = 1; 2; ; nm; (2)
b
i i 0; i = 1; 2; ; ncm; (3)
low i up; i = 1; 2; ; nn; (4)
Alow Ai Aup; i = 1; 2; ; ng; (5)
in which A is the vector containing the design variables (i.e. cross sections A = fA1; A2; ; Angg), W (A)
is the weight of the truss structure, i is the density
of member i, Li is the length of member i, nm is
the number of members in the structure, ncm is the number of compression members, nn is the number of nodes, ng is the total number of member groups (i.e. design variables), Ak is the cross-sectional area
of the members belonging to group k, mk is the total number of members in group k, i is the stress of the
ith member, b
i is the allowable buckling stress for the
ith member, iis the displacement of the ith node, and
low and up are the lower and upper bounds for stress, displacement and cross-sectional area.
3. An overview on rey algorithm
The Firey Algorithm (FA) is one of the latest meta-heuristic algorithms. Firey algorithm is a nature-inspired algorithm, which was rst developed by Yang [22] inspired by the light attenuation over the distance and reies' mutual attraction. In the algo-rithm, reies try to move to a greater light source than their own. Firey algorithm idealizes some of the characteristics of the rey behavior in nature. They follow three rules:
i) All the reies are unisex.
ii) Attractiveness is proportional to their ashing brightness which decreases as the distance from the other rey increases due to the fact that the air absorbs light. The most attractive rey is the brightest one which convinces neighbors to move toward him. In case of no brighter one, it freely moves in any direction.
iii) Brightness of every rey determines its quality of solution; in most of the cases, it is proportional to the objective function.
Firey algorithm starts with initializing a swarm of reies, each of which is determined by the ashing light intensity. During the loop of pairwise comparison of light intensities, the rey with lower light intensity moves toward the higher one. The moving distance depends on the attractiveness. After moving, the new rey is evaluated and updated for the light intensity. During pairwise comparison loop, the best-so-far solution is iteratively updated. The pairwise comparison process is repeated until termination cri-teria are satised. Finally, the best-so-far solution is visualized.
To dene the most important parameters in rey algorithm suppose a night with absolute darkness where the only visible light is the light produced by re-ies. The light intensity of each rey is proportional to the quality of the solution it is currently located at. In order to improve his own solution, the rey needs to advance towards the reies that have brighter light emission than his own.
Although the theoretical background of rey algorithm can be found in Yang's article [22], a brief overview is presented as follows.
In rey algorithm it is assumed that the attrac-tiveness of a rey is determined by its brightness I which in turn is associated with the objective func-tion. The attractiveness varies with the distance rij between rey i and rey j. Moreover, from a
physical point of view, light intensity decreases with the distance from its source, and light is also absorbed in the media. Hence, the light intensity I(r) can be assumed to vary according to inverse square law [22]:
I(r) = Irs2; (6)
in which Isis the intensity at the source. For a medium
with a xed light absorption coecient, , the light intensity I varies with the distance as:
I(r) = I0exp( r); (7)
where I0 is the original light intensity. To avoid
singularity at r = 0 in Eq. (6), the combined eect of both the inverse square law and absorption is approximated by the following Gaussian form:
I(r) = I0exp( r2): (8)
Since the attractiveness of a rey is proportional to the light intensity observed by neighbor reies, the attractiveness, , of a rey is dened as:
= 0exp( r2); (9)
in which, 0, is the attractiveness in distance r = 0 and
is light absorption coecient in the range [0; 1). The distance r between rey i and j at xiand xj, is dened
as Cartesian distance: r = rij= kxi xjk =
v u u tXd
k=1
(xi;k xj;k)2; (10)
where xi;k is the kth component of the spatial
coor-dinate, xi, of the ith rey and d is the number of
dimensions. Finally, the movement of rey i which is attracted by a more attractive or brighter rey j is given by the following equation:
xi= xi+ 0exp( r2)(xj xi) + ( 0:5); (11)
where the second term is due to the attraction. The third term is randomization with being the ran-domization parameter such that 2 [0; 1], and is a vector of random numbers drawn from a Gaussian distribution or uniform distribution in the range [0; 1]. Furthermore, for most problems, one can take 0= 1.
In the case of size optimization of trusses, the cross-sectional areas of bars are considered as design variables to be optimized with d being the number of bars in the truss. The formulation of standard rey algorithm, i.e. Eq. (11), is denoted by FA throughout the manuscript.
4. Accelerated Firey Algorithm (AFA)
Similar to most other metaheuristic optimization tech-niques, the standard rey algorithm suers from slow rate of convergence. This means that for real-world problems with many design variables, the structure should be analyzed several times with no guaranty to achieve the optimal solution. Our experiments on standard rey algorithm revealed that even for simple truss structures a large number of iterations (about 3000 iterations) are required to obtain a solution. If the initial population has a number o,f say, 50 reies, the overall 150,000 structural analyses are needed.
In this section some modications on standard rey algorithm are proposed that can remarkably improve the performance and the rate of convergence of the rey algorithm. These modications include grad-ual reduction of randomness and scaling the random term. The aforementioned procedures are presented in the following subsections.
4.1. Gradual randomness reduction
The rst modication of rey algorithm is to adjust the randomization parameter, , in Eq. (11), so as it gradually decreases as the solution is approached. Consider:
= 0t; (12)
in which t 2 [0; tmax] is the simulation time
Moreover, 0 is the initial randomization parameter
and 2 (0; 1] is the randomization reduction constant. Applying Eq. (12) in Eq. (11) gives:
xi = xi+ 0exp( r2)(xj xi) + 0t( 0:5):
(13) The formulation of Eq. (13), which imposes reduction of randomness in the standard rey algorithm, is denoted by FA-R in this paper.
The idea of decreasing randomization, as the iteration proceeds, is actually not new and it has been already employed [23,26].
4.2. Scaling the random term
The main new idea in improving the rate of convergence of rey algorithm is scaling. The random term (third term in Eq. (13)) can be further modied by dening a scaling parameter as the dierence between lower bound and upper bound of design variables as:
=(Upper variable boundary
lower variable boundary): (14)
This is a general formula proposed for which can be used in any optimization problem. For the problem at
hand, according to the variables boundary dened in Eq. (5), the above equation can be written as:
= Aup Alow: (15)
Then, the random term in Eq. (13) can be further modied using as:
xi= xi+ 0exp( r2)(xj xi) + 0t( 0:5):
(16) Eq. (16) is the basic formula for the proposed Accel-erated Firey Algorithm (AFA). The pseudo code for accelerated rey algorithm is given in Table 1. 5. Constraints handling
Most optimization problems contain specied con-straints which should be satised. In the case of truss structures, according to Eqs. (2) through (5), some constraints have been dened. The problem-specied constraints (Eqs. (2)-(4)) usually dictate constraints on the magnitude of stress within the bar elements or nodal displacements. Variable constraints (Eq. (5)) usually indicate that the design variables should be chosen within a specied range due to availability of cross-sectional areas of bars. The most popular
Table 1. The pseudo code for Accelerated Firey Algorithm (AFA). Objective function f(x), x = (x1; x2; ; xd)T d = no. of design variables
Generate initial population of reies randomly Xi, i = 1; 2; ; n n = no. of reies
Light intensity Iiat xiis determined by f(xi)
Dene light absorption coecient Dene randomness reduction constant Dene initial randomization parameter 0
Dene attractiveness at (r = 0), 0
Calculate scaling parameter = (upper variable boundary lower variable boundary) while t maximum number of generation or convergence criteria met
Calculate = 0t
for i = 1 to n for j = 1 to n
if (Ii> Ij)
Calculate the distance rij=xi xj
Calculate = 0exp( r2ij)
Generate random number vector "i
Update design variable xi= xi+ (x
j xi) + "i
end if end for j end for i
Rank the reies and nd the current global best end while
method for handling constraints in optimization algo-rithms is penalty function formulation. The method has been already employed successfully to deal with constraints [11,23-25]. The main reason of popularity of the method is its simplicity and its direct appli-cability regardless of the optimization method being used. Therefore, the method can also be used in rey algorithm. This formulation utilizes general information of the swarm of reies, such as the average of the objective function and the level of violation of each constraint in each iteration, in order to dene dierent penalties for dierent constraints. The basic equation is [11]:
f0(x) =
8 < :
f(x) if x is feasible
f(x) +Pm
i=1kigl(x) otherwise
(17) in which ki is penalty parameter and is calculated in
each iteration by: ki = f(x)Pmgi(x)
j=1[gj(x)]2
; (18)
with f(x) being the objective function and m being the number of constraints. Moreover, in rey algo-rithm gi(x) is specic constraint value so that violated
constraints have values greater than zero, f(x) is the average of objective function in current reies and gi(x) is the violation of the ith constraint averaged over
the current swarm of reies.
The illustration of Eq. (17) is that the problem is actually solved as an unconstrained one, where in minimization case, the objective function is designed such that non-feasible solutions are characterized by high function values.
6. Design examples
To study the eectiveness of the proposed accelerated rey algorithm in optimal design of truss structures, three benchmark problems are presented and are fully discussed in various aspects in terms of computational eort, stability and optimal results. Moreover, from a technical point of view, in order to study the eect of each modication on the results and to distinguish the strategies, each problem is optimized using three dierent algorithms, i.e. standard rey algorithm (FA, Eq. (11)), rey algorithm with the reduction of randomness (FA-R, Eq. (13)), and the proposed accelerated rey algorithm (AFA, Eq. (16)). Gener-ally, the parameters of rey algorithm depend on the optimization problem and appropriate values should be found to suit the problem by a trial and error procedure. For most problems in sizing optimization of truss structures, we found that the values of = 0:97,
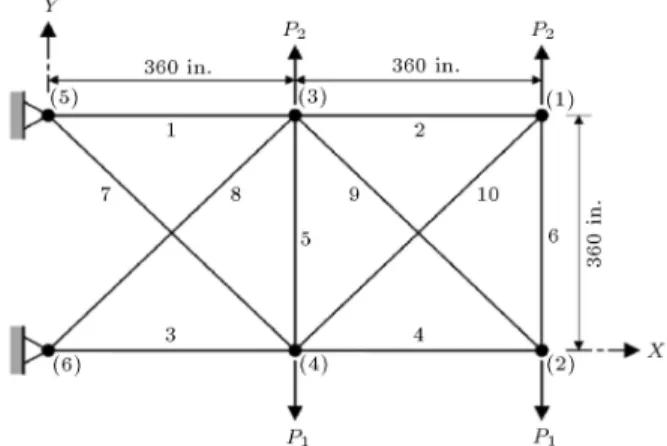
Figure 1. A 10-bar planar truss structure.
= 0:05, 0= 1 and 0= 1 are suitable to be used in
the algorithm. Furthermore, in all examples, the initial swarm contains 100 reies.
A nite element code was developed to analyze the planar and spatial trusses. The results are com-pared with the results obtained by other researchers as well.
6.1. 10-bar planar truss
The well-known planar 10-bar truss shown in Figure 1 has been analyzed by many researchers to test the eciency and robustness of various optimization al-gorithms [11,12,16-18,27-31]. The material density of all members was 0.1 lb/in3 and the Young's modulus
of elasticity was 10,000 ksi. The maximum allowable stress in all bars was 25 ksi with nodal displacement limitations of 2:0 inches for both directions. The minimum cross-sectional area of each bar element was 0.1 in2. The weight optimization of truss have been
studied for two cases: Case 1 with p1 = 100 kips and
p2= 0; Case 2 with p1= 150 kips and p2= 50 kips.
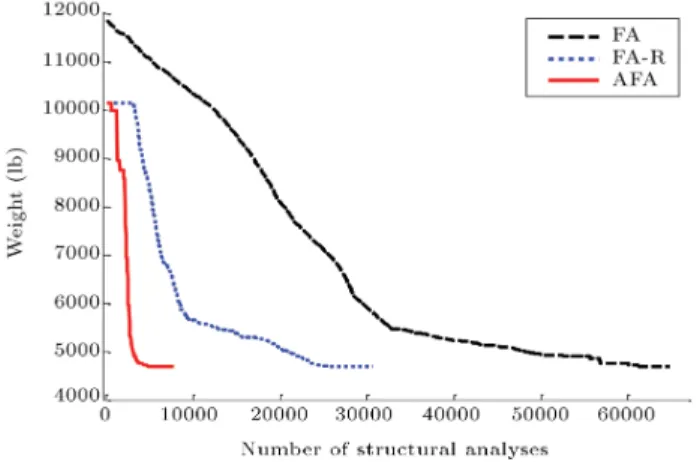
Table 2 reports the results of optimizing the truss using FA, FA-R and AFA and the results found by other studies for Case 1. The cross-sectional areas found by each algorithm are included for comparison. As reported in Table 2 for Case 1, the weight of optimal structure is 5060.14 lb, 5060.07 lb, and 5059.22 lb for FA, FA-R and AFA, respectively. The results show that the proposed AFA leads to a lighter structure than FA and FA-R. The structure found by AFA is the lightest structure among the structures reported in Table 2 for Case 1. Moreover, the structural analyses required to obtain the optimal structure is dramatically reduced from 62675 analyses for FA to 23325 analyses for FA-R, and only 8000 analyses for AFA. The table also shows that although the reduction of randomness in rey algorithm (FA-R) can improve the rate of convergence of FA, it is not yet competitive with AFA from this aspect. The rates of convergence of the three algorithms are compared in Figure 2. As the gure shows, the rate of convergence of FA-R is lower than
Table 2. Comparison of optimal designs for the 10-bar planar truss structure (Case 1).
Variables
Optimal cross-sectional areas (in2)
Sedaghati [27]
Farshi and
Alinia-ziazi [28]
Lamberti and Pappalettere
[29]
Li et al. [12] Degertekin [17] This study
HS PSO IHS PSO PSOPC HPSO EHS SAHS FA FA-R AFA
1 A1 30.5218 30.5208 30.5222 33.469 30.569 30.704 30.208 30.394 30.968 30.374 30.301
2 A2 0.1000 0.1000 0.1000 0.110 0.100 0.100 0.100 0.100 0.100 0.100 0.100
3 A3 23.1999 23.2040 23.2005 23.177 22.974 23.167 22.698 23.098 23.215 23.766 23.203
4 A4 15.2229 15.2232 15.2232 15.475 15.148 15.183 15.275 15.491 15.043 15.050 15.207
5 A5 0.100 0.1000 0.1000 3.649 0.100 0.100 0.100 0.100 0.100 0.100 0.100
6 A6 0.5514 0.5515 0.5513 0.116 0.547 0.551 0.529 0.529 0.591 0.621 0.5366
7 A7 7.4572 7.4669 7.4572 8.328 7.493 7.460 7.558 7.488 7.453 7.390 7.441
8 A8 21.0364 21.0342 21.0368 23.340 21.159 20.978 21.559 21.189 20.866 20.742 20.984
9 A9 21.5284 21.5294 21.5288 23.014 21.556 21.508 21.491 21.342 21.461 21.652 21.739
10 A10 0.1000 0.1000 0.1000 0.190 0.100 0.100 0.100 0.100 0.100 0.100 0.100
Weight (lb) 5060.85 5061.40 5060.82 5529.50 5061.00 5060.92 5062.39 5061.42 5060.14 5060.07 5059.22 No of analyses N/A N/A N/A 150000 150000 125000 9791 7081 62675 23325 8000
Figure 2. Comparison of the convergence rates of the three algorithms for the 10-bar planar truss structure (Case 1) .
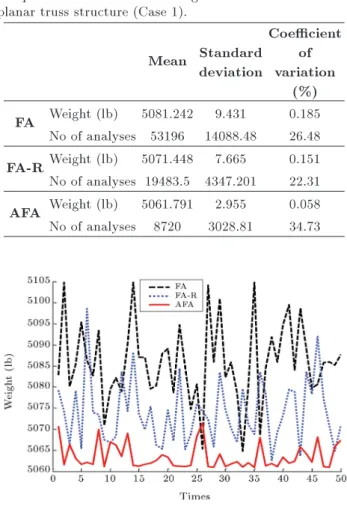
AFA and higher than FA. To study the robustness of the algorithms, the statistical results of 50 independent runs of these three algorithms for Case 1 are reported in Table 3. Figure 3 compares the optimal weights found by each algorithm after these 50 independent runs. As it is clear from Table 3, AFA gives the best performance among the aforementioned algorithms. The mean value of the weight and number of structural analyses are considerably decreased by employing AFA. The least values of the standard deviation of weight and the associated coecient of variations after 50 runs indicate better stability of the proposed algorithm than FA and FA-R. Figure 3 shows that the proposed AFA is more stable than FA and FA-R. Table 4 reports the optimal
Table 3. Comparison of statistical results for fty independent runs of the three algorithms for the 10-bar planar truss structure (Case 1).
Mean Standard deviation
Coecient of variation
(%) FA Weight (lb) 5081.242 9.431 0.185 No of analyses 53196 14088.48 26.48 FA-R Weight (lb) 5071.448 7.665 0.151 No of analyses 19483.5 4347.201 22.31 AFA Weight (lb) 5061.791 2.955 0.058 No of analyses 8720 3028.81 34.73
Figure 3. Comparison of the stability of the three algorithms for the 10-bar planar truss structure (Case 1).
Table 4. Comparison of optimal designs for the 10-bar planar truss structure (Case 2).
Variables
Optimal cross-sectional areas (in2)
Lee and Geem
[16]
Schmit and Farshi
[30]
Kaveh and Talatahari
[18]
Rizzi
[31] Li et al. [12] Degertekin [17] This study
HS HPSACO PSO PSOPC HPSO EHS SAHS FA FA-R AFA
1 A1 23.25 24.29 23.194 23.53 22.935 23.743 23.353 23.589 23.525 23.891 23.702 23.707
2 A2 0.102 0.100 0.100 0.100 0.113 0.101 0.100 0.100 0.100 0.100 0.100 0.100
3 A3 25.73 23.35 24.585 25.29 25.355 25.287 25.502 25.422 25.429 25.598 25.371 25.352
4 A4 14.51 13.66 14.221 14.37 14.373 14.413 14.250 14.488 14.488 14.234 14.285 14.270
5 A5 0.100 0.100 0.100 0.100 0.100 0.100 0.100 0.100 0.100 0.100 0.100 0.100
6 A6 1.977 1.969 1.969 1.97 1.990 1.969 1.972 1.975 1.992 1.988 1.997 1.969
7 A7 12.21 12.67 12.489 12.39 12.346 12.362 12.363 12.362 12.352 12.375 12.446 12.352
8 A8 12.61 12.54 12.925 12.83 12.923 12.694 12.894 12.682 12.698 12.773 12.843 12.691
9 A9 20.36 21.97 20.952 20.33 20.678 20.323 20.356 20.322 20.341 20.043 20.143 20.408
10 A10 0.100 0.100 0.101 0.100 0.100 0.103 0.101 0.100 0.100 0.100 0.100 0.100
Weight (lb) 4668.81 4691.84 4675.78 4676.92 4679.47 4677.70 4677.29 4679.02 4678.84 4678.64 4678.09 4677.01 No of analyses 15000 N/A 9925 N/A 150000 150000 125000 11402 7267 64800 30625 7760 Table 5. Comparison of statistical results for fty
independent runs of the three algorithms for the 10-bar planar truss structure (Case 2).
Mean Standard deviation
Coecient of variation
(%) FA Weight (lb) 4738.081 83.312 1.758 No of analyses 54893.00 15437.20 28.12 FA-R Weight (lb) 4711.657 37.602 0.798 No of analyses 18754.50 5286.56 28.19 AFA Weight (lb) 4685.650 4.575766 0.097 No of analyses 7668.8 2280.29 29.73
cross-sectional areas obtained by this study and other studies for Case 2. The weights of structures are 4678.64, 4678.09, and 4677.01 for FA, FA-R and AFA, respectively. The results are very satisfactory and close to those found by using other techniques. The rates of convergence of FA, FA-R and AFA for 10-bar planar truss are compared in Figure 4 for Case 2. As Figure 4 shows, AFA has improved the rate of convergence of both FA and FA-R. Statistical results reported in Table 5 for the three algorithms after 50 independent runs also indicate better performance of AFA than FA and FA-R for this case as well. Figure 5 compares the weight of the structure obtained using each of the algorithms for 50 independent runs to investigate the stability of each algorithm. As the gure indicates, the stability of AFA is more than both FA-R and FA by producing very close results after each run.
Figure 4. Comparison of the convergence rates of the three algorithms for the 10-bar planar truss structure (Case 2).
Figure 5. Comparison of the stability of the three algorithms for the 10-bar planar truss structure (Case 2).
6.2. 25-bar space truss structure
Figure 6 shows the 25-bar spatial truss in which modulus of elasticity of the material was 10,000 ksi and its density was 0.1 lb/in3. Table 6 reports the two load
cases examined for this example. The structure should satisfy the problem-specied constraints for both cases. The design variables of the structure are categorized in 8 groups, and the allowable stress values for all groups are listed in Table 7. All nodes in all directions are subjected to the displacement limits of 0:35 in. Moreover, the minimum cross-sectional area for each group of elements was 0.01 in2.
Table 8 reports optimization results obtained for 25-bar truss by this study and by other
re-Figure 6. A 25-bar spatial truss structure .
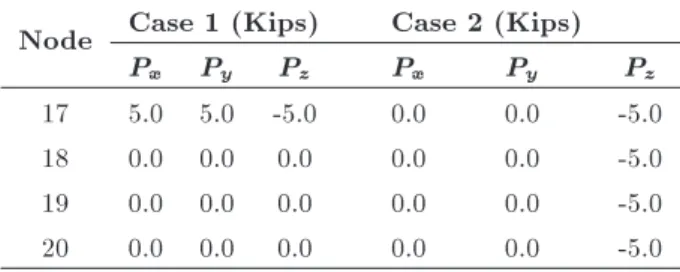
Table 6. Load cases for the 25-bar spatial truss structure. Node Case 1 (Kips) Case 2 (Kips)
Px Py Pz Px Py Pz
1 0.0 20.0 -5.0 1.0 10.0 -5.0 2 0.0 -20.0 -5.0 0.0 10.0 -5.0
3 0.0 0.0 0.0 0.5 0.0 0.0
6 0.0 0.0 0.0 0.5 0.0 0.0
Table 7. Member stress limits for the 25-bar spatial truss structure.
Variables
Compressive stress limitations
(Ksi)
Tensile stress limitations
(Ksi)
1 A1 35.092 40.0
2 A2 A5 11.590 40.0
3 A6 A9 17.307 40.0
4 A10 A11 35.092 40.0
5 A12 A13 35.092 40.0
6 A14 A17 6.759 40.0
7 A18 A21 6.959 40.0
8 A22 A25 11.802 40.0
searches [12,16-18,29,32]. As reported in Table 8, the optimal weight of 545.25 lb, 546.61 lb, and 544.75 lb were found by FA, FA-R, and AFA, respectively. The table shows that all three algorithms lead to very satisfactory results, close to results of other algorithms. However, the computational eort of AFA is very low compared to most other methods. Moreover, the optimal weight found by AFA is less than the weight of most other structures reported in Table 8. Figure 7 compares the rate of convergence of FA, FA-R and AFA, revealing remarkable improvement of FA in reducing the number of structural analyses required for convergence by using AFA. The results of optimal weights found by the three algorithms after 50 independent runs for 25-bar spatial truss structure is shown in Figure 8 and the associated statistical results are presented in Table 9. As Figure 8 and Table 9 show, AFA is very stable and robust compared to FA and FA-R.
6.3. 72-bar spatial truss
The problem of weight optimization of 72-bar spatial truss structure shown in Figure 9 is presented in this
Figure 7. Comparison of the convergence rates of the three algorithms for the 25-bar spatial truss structure.
Figure 8. Comparison of the stability of the three algorithms for the 25-bar spatial truss structure.
Table 8. Comparison of optimal designs for the 25-bar spatial truss structure.
Variables
Optimal cross-sectional areas (in2)
Lee and Geem
[16]
Lamberti [29]
Kaveh and Talatahari
[18]
Camp
[32] Li et al. [12]
Degertekin
[17] This study
HS CMLPSA HPSACO BB-BC PSO PSOPC HPSO EHS SAHS FA FA-R AFA
1 A1 0.047 0.0100 0.010 0.010 9.863 0.010 0.010 0.010 0.010 0.0100 0.0100 0.0100
2 A2A5 2.022 1.9870 2.054 2.092 1.798 1.979 1.970 1.995 2.074 1.9722 1.7785 1.9995
3 A6A9 2.950 2.9935 3.008 2.964 3.654 3.011 3.016 2.980 2.961 3.0074 3.1628 2.9598
4 A10A11 0.010 0.0100 0.010 0.010 0.100 0.100 0.010 0.010 0.010 0.0100 0.0100 0.0100
5 A12A13 0.014 0.0100 0.010 0.010 0.100 0.100 0.010 0.010 0.010 0.0100 0.0100 0.0100
6 A14A17 0.688 0.6840 0.679 0.689 0.596 0.657 0.694 0.696 0.691 0.6852 0.7079 0.6904
7 A18A21 1.657 1.6769 1.611 1.601 1.659 1.678 1.681 1.679 1.617 1.6836 1.7934 1.6824
8 A22A25 2.663 2.6621 2.678 2.686 2.612 2.693 2.643 2.652 2.674 2.6564 2.5671 2.6531
Weight (lb) 544.38 545.15 544.99 545.38 629.08 545.27 545.19 545.49 545.12 545.25 546.61 544.75 No of analyses 15000 N/A 9875 20566 150000 150000 125000 10391 9051 38775 16225 6750 Table 9. Comparison of statistical results for fty
independent runs of the three algorithms for the 25-bar spatial truss structure.
Mean Standard deviation
Coecient of variation
(%) FA Weight (lb) 575.806 27.813 4.830 No of analyses 30904 8936.75 28.92 FA-R Weight (lb) 574.430 23.213 4.041 No of analyses 13974 1663.69 11.90 AFA Weight (lb) 549.024 4.279 0.779 No of analyses 6593 1653.97 25.08
Figure 9. A 72-bar spatial truss structure.
section. This truss has been already investigated by many researchers [11,12,16-18,29,32,33]. The modulus of elasticity of the material was 10,000 ksi and material density was 0.1 lb/in3. The cross-sectional areas of
members as design variables are separated into 16 groups:
(1) A1-A4, (2) A5-A12, (3) A13-A16, (4) A17-A18, (5) A19-A22, (6) A23-A30, (7) A31-A34, (8) A35-A36, (9) A37-A40, (10) A41-A48, (11) A49-A52, (12) A53-A54, (13) A55-A58, (14) A59-A66, (15) A67-A70, (16) A71-A72.
The maximum allowable stress in all members was equal in tension and compression and it was 25 ksi. Maximum allowable displacement of uppermost nodes was 0:25 inches in both x and y directions. Table 10 gives the two load cases for this example. This problem was analyzed for two cases: Case 1 in which minimum cross-sectional area of each members was 0.1 in2, and Case 2 in which this value was 0.01
in2.
Table 11 compares the optimal cross-sectional
Table 10. Load cases for the 72-bar spatial truss structure
Node Case 1 (Kips) Case 2 (Kips)
Px Py Pz Px Py Pz
17 5.0 5.0 -5.0 0.0 0.0 -5.0
18 0.0 0.0 0.0 0.0 0.0 -5.0
19 0.0 0.0 0.0 0.0 0.0 -5.0
Table 11. Comparison of optimal designs for the 72-bar spatial truss structure (Case 1).
Variables
Optimal cross-sectional areas (in2)
Lee and Geem
[16]
Perez and Behdinan
[11]
Kaveh and Talatahari
[18]
Camp [32]
Li et al. [12]
Degertekin
[17] This study
HS PSO HBB-BC BB-BC PSO EHS SAHS FA FA-R AFA
1 A1A4 1.7901 1.7427 1.9042 1.8577 41.794 1.967 1.860 1.8898 2.0554 1.9046
2 A5A12 0.521 0.5185 0.5162 0.5059 0.195 0.510 0.521 0.5062 0.4894 0.5236
3 A13A16 0.100 0.1000 0.1000 0.1000 10.797 0.100 0.100 0.1023 0.1042 0.1000
4 A17A18 0.100 0.1000 0.1000 0.1000 6.861 0.100 0.100 0.1000 0.1003 0.1000
5 A19A22 1.229 1.3079 1.2582 1.2476 0.438 1.293 1.271 1.2781 1.1904 1.2462
6 A23A30 0.522 0.5193 0.5035 0.5269 0.286 0.511 0.509 0.5258 0.4865 0.5067
7 A31A34 0.100 0.1000 0.1000 0.1000 18.309 0.100 0.100 0.1000 0.1000 0.1000
8 A35A36 0.100 0.1000 0.1000 0.1012 1.220 0.100 0.100 0.1000 0.1000 0.1000
9 A37A40 0.517 0.5142 0.5178 0.5209 5.933 0.499 0.485 0.5506 0.5217 0.4726
10 A41A48 0.504 0.5464 0.5214 0.5172 19.545 0.501 0.501 0.5135 0.5276 0.5224
11 A49A52 0.100 0.1000 0.1000 0.1004 0.159 0.100 0.100 0.1000 0.1000 0.1011
12 A53A54 0.101 0.1095 0.1007 0.1005 0.151 0.100 0.100 0.1145 0.1322 0.1002
13 A55A58 0.156 0.1615 0.1566 0.1565 10.127 0.160 0.168 0.1573 0.1548 0.1569
14 A59A66 0.547 0.5092 0.5421 0.5507 7.320 0.522 0.584 0.5238 0.5534 0.5546
15 A67A70 0.442 0.4967 0.4132 0.3922 3.812 0.478 0.433 0.4576 0.4352 0.3995
16 A71A72 0.590 0.5619 0.5756 0.5922 18.196 0.591 0.520 0.5337 0.5743 0.5546
Weight (lb) 379.27 381.91 379.66 379.85 6818.67 381.03 380.62 380.50 381.30 379.54 No of analyses 20000 N/A 13200 19621 150000 15044 13742 72925 36500 12780
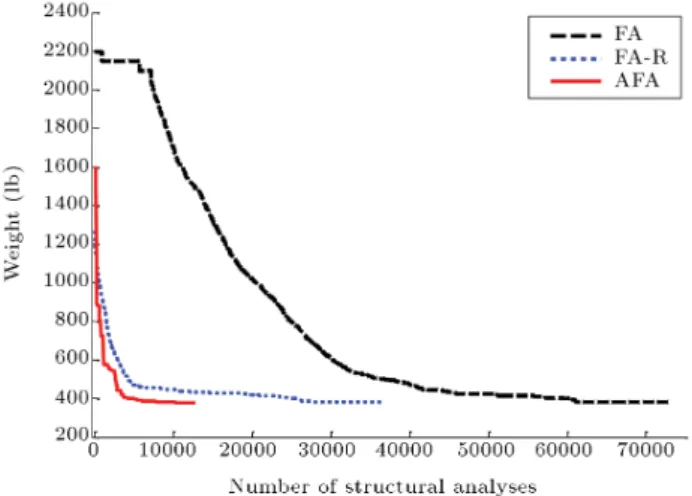
areas and overall weight of structures found by FA, FA-R and AFA and those obtained by other studies. As Table 11 shows for Case 1, the weights of 380.50 lb, 381.30 lb, and 379.54 lb were obtained using FA, FA-R, and AFA, respectively. AFA nds the optimal struc-ture, which is lighter than most of structures reported in Table 11, after 12780 structural analyses. Figure 10
Figure 10. Comparison of the convergence rates of the three algorithms for the 72-bar spatial truss structure (Case 1).
compares convergence rates of the algorithms. The gure shows that AFA outperforms the other two algorithms in fast optimization of structure. Tables 12 reports statistical results obtained after 50 independent runs of these three algorithms, and Figure 11 compares the stability of these algorithms for Case 1. As the results show, AFA is a very stable algorithm compared to FA and FA-R. The optimal results of 72-bar spatial truss structure for Case 2, by using various algorithms, are given in Table 13. As it is clear from the table,
Table 12. Comparison of statistical results for fty independent runs of the three algorithms for the 72-bar spatial truss structure (Case 1).
Mean Standard deviation
Coecient of variation
(%) FA Weight (lb) 405.505 29.195 7.200
No of analyses 71377 24783.75 34.72232 FA-R Weight (lb) 392.412 13.162 3.354
No of analyses 33318.4 7564.00 22.70 AFA Weight (lb) 381.489 1.115 0.292 No of analyses 13132.80 2999.74 22.84
Table 13. Comparison of optimal designs for the 72-bar spatial truss structure (Case 2).
Variables
Optimal cross-sectional areas (in2)
Lee and Geem
[16]
Lamberti
[29] Samara [33] Li et al. [12]
Degertekin
[17] This study
HS CMLPSA Simple
GA
Simple
GA PSO PSOPC HPSO EHS SAHS FA FA-R AFA
1 A1A4 1.963 1.8866 2.141 1.732 40.053 1.652 1.907 1.889 1.889 1.8539 1.8927 1.9085
2 A5A12 0.481 0.5169 0.510 0.522 0.237 0.547 0.524 0.502 0.520 0.5123 0.5217 0.5130
3 A13A16 0.010 0.0100 0.054 0.010 21.692 0.100 0.010 0.010 0.010 0.0100 0.0100 0.0100
4 A17A18 0.011 0.0100 0.010 0.013 0.657 0.101 0.010 0.010 0.010 0.0100 0.0497 0.0100
5 A19A22 1.233 1.2903 1.489 1.345 22.144 1.102 1.288 1.284 1.289 1.2889 1.1831 1.2553
6 A23A30 0.506 0.5170 0.551 0.551 0.266 0.589 0.523 0.526 0.524 0.5406 0.5051 0.5142
7 A31A34 0.011 0.0100 0.057 0.010 1.654 0.011 0.010 0.010 0.010 0.0100 0.0124 0.0100
8 A35A36 0.012 0.0100 0.013 0.013 10.284 0.010 0.010 0.010 0.010 0.0100 0.0100 0.0100
9 A37A40 0.538 0.5207 0.565 0.492 0.559 0.581 0.544 0.528 0.539 0.5151 0.5277 0.5487
10 A41A48 0.533 0.5180 0.527 0.545 12.883 0.458 0.528 0.525 0.519 0.5183 0.5327 0.5194
11 A49A52 0.010 0.0100 0.010 0.066 0.138 0.010 0.019 0.010 0.015 0.0100 0.0100 0.0100
12 A53A54 0.167 0.1141 0.066 0.013 0.188 0.152 0.020 0.063 0.105 0.1012 0.1354 0.1050
13 A55A58 0.161 0.1665 0.174 0.178 29.048 0.161 0.176 0.173 0.167 0.1686 0.1655 0.1670
14 A59A66 0.542 0.5363 0.425 0.524 0.632 0.555 0.535 0.550 0.532 0.5198 0.5456 0.5343
15 A67A70 0.478 0.4460 0.437 0.396 3.045 0.514 0.426 0.444 0.425 0.4131 0.4105 0.4500
16 A71A72 0.551 0.5761 0.641 0.595 1.711 0.648 0.612 0.592 0.579 0.6577 0.6375 0.5925
Weight (lb) 364.33 363.818 372.40 364.40 5417.02 368.45 364.86 364.36 364.05 363.98 364.57 363.85 No of analyses 20000 N/A N/A N/A 150000 125000 125000 13755 12852 41085 21990 11000
Figure 11. Comparison of the stability of the three algorithms for the 72-bar spatial truss structure (Case 1).
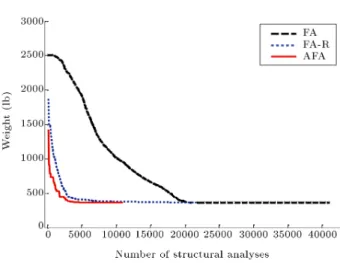
the weights of 363.98 lb, 364.57 lb, and 363.85 lb were found using FA, FA-R, and AFA, respectively. The structure obtained by AFA is lighter than most other structures reported in the table. In addition, the proposed AFA requires very less computational eort than other techniques. It is worthy of remark that as it is clear from Tables 11 and 13, the well-known PSO algorithm has been practically unable to nd a solution
Figure 12. Comparison of the convergence rates of the three algorithms for the 72-bar spatial truss structure (Case 2).
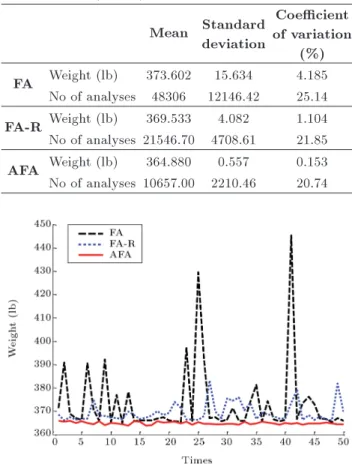
for both cases. This implies that the rey algorithm might be superior to PSO in truss optimization, since in all our experiments satisfactory solutions were obtained by all versions of rey algorithm. Figure 12 compares convergence rates of the algorithms for Case 2 of this problem. Table 14 gives statistical results obtained after 50 independent runs of these three algorithms and
Table 14. Comparison of statistical results for fty independent runs of three algorithms for the 72-bar spatial truss structure (Case 2).
Mean Standard deviation
Coecient of variation
(%) FA Weight (lb) 373.602 15.634 4.185 No of analyses 48306 12146.42 25.14 FA-R Weight (lb) 369.533 4.082 1.104 No of analyses 21546.70 4708.61 21.85 AFA Weight (lb) 364.880 0.557 0.153 No of analyses 10657.00 2210.46 20.74
Figure 13. Comparison of the stability of the three algorithms for the 72-bar spatial truss structure (Case 2).
Figure 13 is presented to compare the stability of these algorithms for Cases 1 and 2, respectively. Superiority of AFA compared to FA and AFA in producing very close results after each independent run is obvious from these gures.
7. Summary, discussion and conclusion
The capability of rey algorithm in weight optimiza-tion of truss structures was rst investigated in this paper. Firey algorithm is a recently developed tech-nique and is not thoroughly tested in optimizing real-life problems. The studies showed that rey algorithm is a robust approach and suitable for size optimization of truss structures. As indicated in this paper, in some cases, the standard PSO algorithm is not capable of nding the optimal solution for the problem contrary to rey algorithm. More specically, an asymptotic case of rey algorithm is the standard PSO by approaching the light absorption coecient to zero ( ! 0). On the other hand, when ! 1, attraction is almost zero in the sight of other reies, and hence, no rey can be seen and reies randomly move in the search space and hence this extreme case is reduced to random
search method. Since the range of variation of is extensive, appropriate value for this parameter should be found for each problem. As mentioned by Yang [22] and shown in this paper, it is possible to adjust the parameters and such that FA outperforms PSO. However, the number of iterations required for conver-gence is still considerable. Therefore, in the second part of this paper, the standard FA was improved to accelerate the algorithm. The accelerated rey algorithm (AFA) was based on gradually decreasing the randomness as the solution is approached, and scaling the random part of reies' movement. To clearly distinguish between these two modications, two algorithms including the reduction only (indicated by FA-R) and both reduction and scaling (indicated by AFA) were examined. The eectiveness and stabil-ity of each algorithm were tested through optimizing some benchmark truss structures. The results show that the reduction of randomness imposed in FA-R can improve the stability and performance of the standard FA. However, signicant improvement in computational eort, stability and performance can be achieved by considering both reduction and scaling in AFA. The enhanced eciency of the proposed AFA is impressing in optimizing complicated real-life truss structures.
References
1. Hajela, P. and Lee, E. \Genetic algorithms in truss topological optimization", Int. J. Solids. Struct., 32, pp. 3341-3357 (1995).
2. Kaveh, A. and Kalatjari, V. \Topology optimization of trusses using genetic algorithm, force method, and graph theory", Int. J. Numer. Methods. Eng., 58, pp. 771-791 (2003).
3. Krishnamoorthy, C.S., Venkatesh, P.P. and Sudarshan, R. \Object-oriented framework for genetic algorithms with application to space truss optimization", J. Com-put. Civil. Eng., 16, pp. 66-75 (2002).
4. Oshaki, M. \Genetic algorithms for topology design optimization trusses", Comput. Struct., 57, pp. 219-225 (1995).
5. Rajeev, S. and Krishnamoorthy, C.S. \Genetic algorithms-based methodologies for design optimiza-tion of trusses", J. Struct. Eng., 123, pp. 350-358 (1997).
6. Tang, W., Tong, L. and Gu, Y. \ Improved genetic algorithm for design optimization of truss structures with size, shape and topology variables", Int. J. Numer. Methods. Eng., 62, pp. 1737-1762 (2005). 7. Togan, V. and Daloglu, A.T. \Optimization of 3d
trusses with adaptive approach in genetic algorithms", Eng. Struct., 28, pp. 1019-1027 (2006).
using ant colony optimization", J. Struct. Eng., ASCE, 130, pp. 741-751 (2004).
9. Kaveh, A., Farahmand Azar, B. and Talatahari, S. \Ant colony optimization for design of space trusses", Int. J. Space. Struct., 23, pp. 167-81 (2008).
10. Serra, M. and Venini, P. \On some applications of ant colony optimization metaheuristic to plane truss optimization", Struct. Multidisc. Optim., 32, pp. 499-506 (2006).
11. Perez, R.E. and Behdinan, K. \Particle swarm ap-proach for structural design optimization", Comput. Struct., 85, pp. 1579-88 (2007).
12. Li, L.J., Huang, Z.B., Liu, F. and Wu, Q.H. \A heuristic particle swarm optimizer for optimization of pin connected structures", Comput. Struct., 85, pp. 340-9 (2007).
13. Li, L.J., Huang, Z.B. and Liu, F. \A heuristic particle swarm optimization method for truss structures with discrete variables", Comput. Struct., 87, pp. 435-43 (2009).
14. Luh, G.C. and Lin, C.Y. \Optimal design of truss structures using particle swarm optimization", Com-put. Struct., 89, pp. 2221-32 (2011).
15. Schutte, J.J. and Groenwold, A.A. \Sizing design of truss structures using particle swarms", Struct. Multidisc. Optim., 25, pp. 261-9 (2003).
16. Lee, K.S. and Geem, Z.W. \A new structural optimiza-tion method based on the harmony search algorithm", Comput. Struct., 82, pp. 781-98 (2004).
17. Degertekin, S.O. \Improved harmony search algo-rithms for sizing optimization of truss structures", Comput. Struct., 92-93, pp. 229-41 (2012).
18. Kaveh, A. and Talatahari, S. \Particle swarm opti-mizer, ant colony strategy and harmony search scheme hybridized for optimization of truss structures", Com-put. Struct., 87, pp. 267-83 (2009).
19. Hasanceby, O. and Erbatur, F. \Layout optimization of trusses using simulated annealing", Adv. Eng. Soft-ware., 33, pp. 681-96 (2002).
20. Lamberti, L. \An ecient simulated annealing algo-rithm for design optimization of truss structures", Comput. Struct., 86, pp. 1936-53 (2008).
21. Kaveh, A. and Ahmadi, B. \Simultaneous analysis, design and optimization of structures using the force method and supervised charged system search algo-rithm", Scientia Iranica, 19, pp. 1-12 (2013).
22. Yang, X.-S. \Firey algorithms for multimodal op-timization", in Stochastic Algorithms: Foundations and Applications, O. Watanabe, and T. Zeugmann T, SAGA 2009, Lecture notes in computer science, 5792, Berlin, Springer-Verlag, pp. 169-78 (2009).
23. Gandomi, A.H., Yang, X.S. and Alavi, A.H. \Mixed
variable structural optimization using rey algo-rithm", Comput. Struct., 89, pp. 2325-36 (2011). 24. Gomes, H.M. \A rey metaheuristic algorithm for
structural size and shape optimization with dynamic constraints", Mecanica Computacional, 76, pp. 2059-74 (2011).
25. Kazemzadeh Azad, S. and Kazemzadeh Azad, S. \Op-timum design of structures using an improved rey", Int. J. Optim. Civil. Eng., 2, pp. 327-340 (2011). 26. Gandomi, A.H., Yang, X.S. and Alavi, A.H. \Firey
algorithm with chaos", Communications in nonlinear Science and Numerical Simulation, 18, pp. 2059-74 (2012).
27. Sedaghati, R. \Benchmark case studies in structural design optimization using the force method", Int. J. Solids. Struct., 42, pp. 5848-587164 (2005).
28. Farshi, B. and Alinia-ziazi, A. \Sizing optimization of truss structures by method of centers and force formulation", Int. J. Solids. Struct., 47, pp. 2508-2524 (2010).
29. Lamberti, L. and Pappalettere, C. \An improved harmony-search algorithm for truss structure opti-mization", In Proceedings of the Twelfth International Conference, Civil, Structural and Environmental Engi-neering Computing, B.H.V. Topping, L.F.C. Neves and R.C. Barros, Eds., Stirlingshire, Scotland: Civil-Comp Press (2009).
30. Schmit, Jr L.A. and Farshi, B. \Some approximation concepts for structural synthesis", AIAA J., 12, pp. 692-9 (1974).
31. Rizzi, P. \Optimization of multiconstrained structures based on optimality criteria", AIAA/ASME/SAE 17th Structures, Structural Dynamics, and Materials Con-ference, King of Prussia, PA (1976).
32. Camp, C.V. \Design of space trusses using big bang-big crunch optimization", J. Struct. Eng., ASCE, 87, pp. 267-83 (2007).
33. Sarma, K.C. And Adeli, H. \Fuzzy genetic algorithm for optimization of steel structures", J. Struct. Eng., ASCE, 126, pp. 596-604 (2000).
Biographies
Abdolhossein Baghlani is currently the assistant professor of Shiraz University of Technology, Shiraz, Iran. He received his BS degree in Civil Engineering, his MS and PhD degrees in Civil Engineering-Hydraulic Structures at Shiraz University, Shiraz, Iran. His areas of research and interest are optimization in civil engineering, numerical methods, computational uid dynamics, hydraulic structures, and sediment transport.
Mohammad Hadi Makiabadi is currently the MS graduate student of Earthquake Engineering at Shiraz University of Technology, Shiraz, Iran. His areas
of research and interest are earthquake engineering, structural optimization, seismic behavior of structures, and reliability analysis.
Hossein Rahnema is currently assistant professor of Shiraz University of Technology, Shiraz, Iran. He
received his BS degree in Civil Engineering, his MS and PhD degrees in Civil Engineering-Geotechnical Engi-neering at Shiraz University, Shiraz, Iran. His elds of study and interest are: Earthquake engineering, soil-structure interaction, design and analysis of space frames, geotechnical engineering.